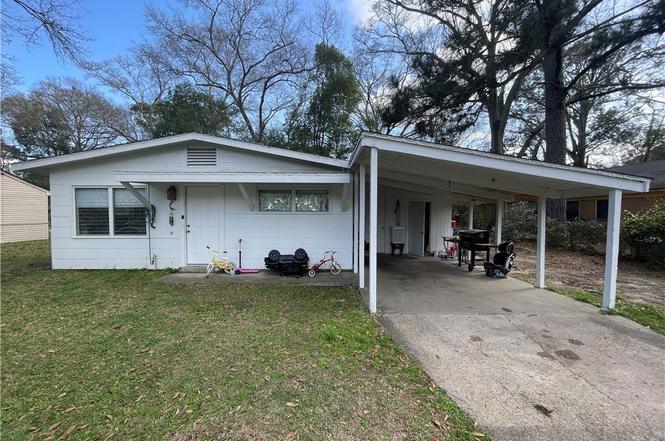
3021 Louise Dr N · Mobile, AL
Flood risk 1/10 · Minimal
- FEMA flood zone
- X (unshaded)
- Chance of flooding over 30 yrs
- 0.0%
- Est. flood insurance / yr
- $507 – $1,088
Fire risk 1/10 · Minimal
- Est. fire insurance / yr
- $916 – $1,700
Heat risk 9/10 · Severe
- Hot days now (above 105°F)
- 7 days/yr
- Hot days in 30 yrs
- 21 days/yr
Wind risk 9/10 · Severe
- Chance of severe wind over 30 yrs
- 99.0%
Air-quality risk 2/10 · Minimal
- Unhealthy air days now
- 1 days/yr
- Unhealthy air days in 30 yrs
- 1 days/yr
Risk factors via First Street. Map © Google.
Why this score? — see what drove the B+ grade
The composite is a weighted blend of 9 inputs, each scored 0–100. Each bar is that input's sub-score; the figure is the points it added to the 100-point composite (weight × sub-score).
- Cash flow +30.0/30.0
- ARV discount +15.0/15.0
- DSCR +10.0/10.0
- 1% rule +9.3/10.0
- Rent growth +3.8/5.0
- Livability +3.8/5.0
- Condition / age +2.5/5.0
- Schools +2.3/10.0
- Appreciation +0.0/10.0
$89,900
🖨 Deal sheet 📄 Offer letter ✓ Due diligence
Listing remarks
Cash flowing slab foundation house in a convenient and desirable area of Mobile! This 3 bedroom / 1 bath updated rental property receives $1,100 / month in rent and there's room to grow to reach fair market rent. Updates within the last few years include a new architectural roof, new heating and air, new water heater, luxury vinyl plank floor, appliances, and other cosmetic updates such as new paint (inside and out), some new doors and all new electrical, plumbing and hardware finishes. Property is rented. Advance notice of showing required. This property can also be purchased as a package with 11 other occupied rental houses. Buy all of them or pick and choose. Contact listing agent for de
Key facts
- Slab foundation
- New water heater
- New paint
Tags
Neighborhood map
What this means for you Summary
Snapshot
- This is a 3-bed/1.0-bath single-family listed at $90k.
Deal economics
- At list price, monthly cash flow is $455 ($5k/yr) — positive.
- The deal already cash-flows at list — no discount required.
- Meets the 1% rule at list price ($1k rent vs $90k).
- Cap rate 12.4% vs local median 4.9% in Mobile — top-decile yield for the area; either an underpriced asset or a hidden risk that comps aren't pricing in. Stress-test before assuming the spread holds.
Location & tenants
- Location reads 75/100 on livability (#20 in AL, #4,262 nationally) — a middle-class / working-renter tenant base. Strengths: commute A+, cost of living A+, housing A+; Watch: crime F, employment D-.
- Mobile County (urban): math 15% / reading 39% proficiency, ranked #81 of 129 in AL (top 63%) — low school quality limits family demand, transient renter base, plan for 1-2y turnover; 67% free/reduced lunch — lower-income household profile, screen leases tightly.
- Zoned schools: Lillie B Williamson High School (math 2% / reading 12%, grade F, #273 of 305 statewide, top 89%, 956 students, 94% FRL) — zoned schools average 94% FRL vs 67% district-wide (27 pts higher); higher-poverty schools than district average — tighter screening recommended.
- Zoned-school proficiency averages 7% at this address vs 27% district-wide (-20 pts) — the specific schools serving this property underperform the Mobile County average; the district grade overstates school quality for this exact location.
- Market conditions: Rents rising fast (+5.1%/yr); 174 active listings in the ZIP; 38 comparable units currently listed for rent nearby; rentals at typical pace (median 21d on market — plan ~3-4 weeks tenant-placement turnaround); 47% of comp listings sitting > 30 days — soft ceiling on asking rent; 1,678 units permitted in Mobile County in 2024 (264 in 5+ unit buildings).
Forward outlook
- Local home prices are declining (-3.0%/yr); year-one equity from $622 of loan paydown is wiped out by about $3k of value loss. Plan a longer hold.
- Mobile County population projected to shrink 8% by 2050 — rents likely to lag national; underwrite the cash flow, not the appreciation.
- At projected returns (-3.0% appreciation + 5.1% rent growth), your $25k cash investment doubles in ~6 years — after that, you're playing with house money.
Negotiation context
- Only 6 days on market — expect competitive offers; lowballing is unlikely to land.
- 2 sale attempts with the ask held roughly flat each time — persistent listings suggest the price (not the market) is what's stuck; bring a comps-based counter.
Risks & watch-outs
- Watch-outs: built in 1955 — expect roof / HVAC / electrical / plumbing capex.
- Climate carrying-cost: severe wind risk, 99% chance of damaging wind over 30y; extreme-heat days projected 7→21/yr by 2055 (HVAC capex compounding) — expect insurance premiums to compound above CPI over the hold.
Questions for the listing agent
- Built in 1955 — when were the roof, HVAC, electrical panel, plumbing, and water heater last replaced?
- Is there a deadline driving the sale (1031 exchange, divorce, estate, relocation)? That informs how much negotiation room exists.
- Schools are D-rated, which usually means shorter tenancies and higher turnover. Who's the typical renter profile here, and what's been the actual vacancy rate?
- Crime grade is F in this area — have there been break-ins, vandalism, or insurance claims at this property in the last 3 years? What carrier currently insures it and at what premium?
- What's the average days-on-market for RENTAL listings here right now (not sales)? A rising rental-DOM trend means longer vacancies and softer asking-rent achievability than the comps imply.
- What's the recent tenant-quality profile in this submarket — average credit score on applications, eviction rate, late-payment / NSF rate, and stable-employment percentage? A property-management company in the area should have these aggregated.
- How much new for-sale + rental construction is in the pipeline within 1–3 miles? Heavy new supply typically softens prices + rents 12–24 months out; constrained supply supports both.
Investment metrics
- 1% rule
- 1.43% ✓
- Cap rate
- 12.37%
- Cash-on-cash
- 21.69%
- DSCR
- 1.96
- GRM
- 5.8
CMA / ARV
- ARV (on-the-fly)
- $151,000
- Comps found
- 8
Show comp detail 8 sales within ~0.75 mi
| Address | Dist | Beds/Ba | Sqft | Sold | Price | $/sf | Match |
|---|---|---|---|---|---|---|---|
| 3021 Louise Dr N | 0.00mi | 3/1.0 | 1,000 (0%) | 0mo | $87,799 | $88 | 100 |
| 3114 Angus Dr N | 0.25mi | 3/1.0 | 925 (-8%) | 0mo | $140,000 | $151 | 76 |
| 3105 Rand Ct | 0.21mi | 3/1.0 | 925 (-8%) | 9mo | $153,900 | $166 | 71 |
| 3063 Cottage Hill Rd | 0.07mi | 3/1.0 | 1,150 (+15%) | 5mo | $135,000 | $117 | 68 |
| 3051 Angus Dr S | 0.31mi | 2/1.0 (-1) | 1,075 (+8%) | 3mo | $121,000 | $113 | 65 |
| 953 Kenny St | 0.52mi | 3/1.0 | 1,064 (+6%) | 6mo | $161,500 | $152 | 60 |
| 1016 Shady Brook Dr | 0.71mi | 3/1.0 | 975 (-2%) | 16mo | $86,000 | $88 | 49 |
| 321 Thornhill Cir | 0.74mi | 3/2.0 | 1,091 (+9%) | 4mo | $178,668 | $164 | 43 |
Match score weights: distance 35% · size 25% · config 20% · recency 20%. Top-matched comps best support the ARV.
Projected returns pro-forma
-3.0% appreciation · 5.06% rent growth · sell at horizon
- IRR
- 16.5%
- Equity multiple
- 1.68×
- Total profit
- $17,101
- Equity at exit
- $13,404
- IRR
- 26.4%
- Equity multiple
- 3.53×
- Total profit
- $63,732
- Equity at exit
- $7,773
Cash invested: $25,172 (down + closing). Projections, not guarantees.
Landlord ↔ Tenant lean methodology
- Overall (STATE)
- 90 Strongly Landlord-Friendly
- State Alabama
- 90 Strongly Landlord-Friendly · R+15
- County
- — inherits STATE
- City
- — inherits STATE
ZIP-level market 36606
- Rents YoY
- 5.1%
- Active inventory
- 174
- Price-to-rent
- 5.8×
Monthly cashflow live
- Estimated rent
- $1,282 high interval (Pro) →
- Mortgage (P&I)
- −$471
- Tax from tax record
- −$49 /mo · $591/yr
- Insurance
- −$37
- HOA
- −$0
- Vacancy / Maint / Mgmt
- −$269
- Net cashflow
- $455
Break-even live
UW: 25.0% down · 7.5% · 30yr · 1.5% tax · 5.0% vac · 8.0% maint · 8.0% mgmt
Financing live
Cash to close
- Down payment
- $22,475
- Closing costs
- $2,697
- Reserves months
- —
- Total cash needed
- —
Loan-product check · same deal, 3 products live
Conventional
25% down · 7.5% · 30yr
- Down + closing
- —
- Monthly P&I
- —
- Monthly cashflow
- —
- DSCR
- —
- Eligible?
- —
Personal DTI + credit; lowest rate.
DSCR
20% down · 8.5% · 30yr
- Down + closing
- —
- Monthly P&I
- —
- Monthly cashflow
- —
- DSCR
- —
- Eligible?
- —
No personal income docs; deal must DSCR.
Hard money
10% down · 12.0% · 12mo
- Down + closing
- —
- Monthly P&I
- —
- Monthly cashflow
- —
- DSCR
- —
- Eligible?
- —
Short-term bridge; refi at stabilization.
Rent comps 38 comps
| Address | Beds | Baths | Sqft | Rent | $/sqft | DOM | Units | Dist |
|---|---|---|---|---|---|---|---|---|
| 505 Bel Air Blvd Mobile, AL | 1.0–2.0 | 1.0–2.0 | 976 | $1,274 | $1.30 | 13d | 16 | 0.23mi |
| 751 Farnell Ln Mobile, AL | 2.0 | 1.0 | 1100 | $1,400 | $1.27 | 43d | 1 | 0.26mi |
| 3210 Pleasant Valley Rd Mobile, AL | 2.0 | 1.0 | 850 | $825 | $0.97 | 43d | 1 | 0.40mi |
| 2904 Pleasant Valley Rd Mobile, AL | 2.0 | 1.0 | 815 | $899 | $1.10 | 43d | 1 | 0.41mi |
| 3171 Pleasant Valley Rd Mobile, AL | 2.0 | 1.0 | 875 | $800 | $0.91 | 43d | 1 | 0.42mi |
| 461 Magnolia Rd Unit A Mobile, AL | 2.0 | 1.0 | 989 | $825 | $0.83 | 43d | 1 | 0.46mi |
| 916 Delmar Dr Mobile, AL | 3.0 | 1.0 | 1100 | $1,400 | $1.27 | 13d | 1 | 0.51mi |
| 276 S Sage Ave Mobile, AL | 1.0–2.0 | 1.0 | 850 | $1,055 | $1.24 | 43d | 1 | 0.72mi |
| 418 Durande Dr Mobile, AL | 3.0 | 2.0 | 1456 | $1,350 | $0.93 | 13d | 1 | 0.79mi |
| 2859 Brierwood Dr Mobile, AL | 3.0 | 1.0 | 1057 | $1,500 | $1.42 | 13d | 1 | 0.83mi |
| 3661 Airport Blvd Mobile, AL | 1.0–3.0 | 1.0–2.5 | 1187 | $1,621 | $1.37 | 13d | 24 | 0.87mi |
| 955 Cloverdale Dr Mobile, AL | 3.0 | 1.5 | 1128 | $1,125 | $1.00 | 43d | 1 | 0.90mi |
| 2861 Potter Dr Unit 1043844P Mobile, AL | 3.0 | 2.0 | 1496 | $2,492 | $1.67 | 21d | 1 | 1.00mi |
| 2863 Potter Dr Unit 1043693P Mobile, AL | 4.0 | 2.0 | 1496 | $3,049 | $2.04 | 13d | 1 | 1.00mi |
| 2855 Potter Dr Mobile, AL | 2.0 | 1.0 | 1127 | $1,050 | $0.93 | 43d | 1 | 1.01mi |
| 3600 Michael Blvd Mobile, AL | 2.0 | 1.5 | 750 | $949 | $1.27 | 13d | 3 | 1.08mi |
| 900 Courtney St Mobile, AL | 2.0 | 1.0 | 1020 | $1,200 | $1.18 | 43d | 1 | 1.11mi |
| 168 W Collins St Mobile, AL | 3.0 | 1.0 | 968 | $725 | $0.75 | 21d | 1 | 1.11mi |
| 3060 Emogene St Mobile, AL | 3.0 | 1.0 | 1200 | $1,400 | $1.17 | 13d | 1 | 1.12mi |
| 1030 Montlimar Dr Mobile, AL | 1.0–3.0 | 1.0–2.0 | 997 | $1,509 | $1.51 | 13d | 17 | 1.13mi |
| 2656 Pathway Pl Mobile, AL | 2.0–3.0 | 1.0 | 778 | $1,261 | $1.62 | 13d | 9 | 1.15mi |
| 150 Dunn Ave Mobile, AL | 3.0 | 2.0 | 1455 | $1,250 | $0.86 | 21d | 1 | 1.17mi |
| 120 Paris Ave Mobile, AL | 2.0 | 1.0 | 1054 | $1,150 | $1.09 | 21d | 1 | 1.21mi |
| 817 Hawkins St Mobile, AL | 3.0 | 1.0 | 1217 | $1,200 | $0.99 | 43d | 1 | 1.25mi |
| 3252 Orleans St Mobile, AL | 2.0 | 1.0 | 900 | $850 | $0.94 | 43d | 1 | 1.26mi |
| 200 S Florida St Unit 101 Mobile, AL | 2.0 | 2.0 | 1150 | $1,375 | $1.20 | 21d | 1 | 1.30mi |
| 767 Jemison St Mobile, AL | 2.0 | 1.0 | 850 | $750 | $0.88 | 43d | 1 | 1.34mi |
| 2425 Nortons Ln Unit C Mobile, AL | 2.0 | 1.0 | 1050 | $1,200 | $1.14 | 43d | 1 | 1.35mi |
| 2425 Nortons Ln Unit D Mobile, AL | 2.0 | 1.0 | 1050 | $1,100 | $1.05 | 13d | 1 | 1.35mi |
| 957 Navco Rd Mobile, AL | 2.0 | 1.5 | 812 | $850 | $1.05 | 21d | 1 | 1.38mi |
| 2503 Richard Ave Mobile, AL | 2.0 | 1.0 | 928 | $805 | $0.87 | 13d | 1 | 1.43mi |
| 615 Mohawk St Mobile, AL | 3.0 | 1.0 | 1172 | $1,500 | $1.28 | 43d | 1 | 1.43mi |
| 728 Bankhead Pl Mobile, AL | 2.0 | 1.0 | 810 | $675 | $0.83 | 43d | 1 | 1.44mi |
| 618 Clarke St Mobile, AL | 3.0 | 1.0 | 1427 | $1,200 | $0.84 | 43d | 1 | 1.44mi |
| 2507 Taylor Ave Mobile, AL | 3.0 | 1.0 | 1230 | $1,495 | $1.22 | 13d | 1 | 1.45mi |
| 400 Westwood St Mobile, AL | 1.0–2.0 | 1.0 | 750 | $1,005 | $1.34 | 43d | 1 | 1.46mi |
| 146 Yester Oaks Dr Mobile, AL | 1.0–3.0 | 1.0–2.5 | 1203 | $1,596 | $1.33 | 13d | 12 | 1.46mi |
| 2500 Taylor Ave Mobile, AL | 2.0 | 1.0 | 840 | $1,195 | $1.42 | 43d | 1 | 1.49mi |
Listing history 7 events
-
2026-04-26status Pending
-
2026-04-21status Active
-
2026-03-13status Pending
-
2026-03-13historical
-
2026-03-12$89,900 Active
-
2006-04-13soldstatus $114,598
-
2005-05-26soldstatus $33,200
ⓘ Source: listings_history table (triggers on properties + properties_extension) + one-shot
backfill from property_details.listing_events for pre-trigger history.
Tax reassessment forecast AL · Resets to sale price
- Current annual tax
- $591 · $49/mo
- Projected year-2 tax
- $591 · $49/mo
- Expected delta
- $0/yr ($0/mo · 0.0%)
ⓘ Screening estimate from a state-policy table — verify with the county assessor before closing.
Climate risk First Street
- Flood 1/10 Low FEMA zone X (unshaded) · 0% chance over 30 yrs
- Wildfire 1/10 Low
- Heat 9/10 Extreme 7 d/yr ≥105°F today · 21 d/yr by 30 yrs out
- Wind 9/10 Extreme 99% chance of damaging wind over 30 yrs
- Air quality 2/10 Low 1 unhealthy d/yr today · 1 by 30 yrs out
Nearby sold comps map
Loading sold comps map…
Walkable amenities ~0.75 mi
Loading nearby amenities…
Taxation est. · year 1
- Rental income
- $15,388
- − Mortgage interest
- −$5,036
- − Property taxes
- −$591
- − Insurance
- −$450
- − Repairs & maintenance
- −$1,231
- − Management
- −$1,231
- − Depreciation
- −$2,615
- Taxable income
- $4,235
- Est. tax owed @ 24.0%
- −$1,016
- After-tax cash flow
- $4,443/yr
For passive investors: Depreciation is non-cash, so a rental often shows a tax loss while cash-flowing — sheltering income. Rental losses are passive: they offset passive income freely, and up to $25,000/yr can offset ordinary (W-2) income if you actively participate and your MAGI is under $100k (phasing out to $0 by $150k); unused losses carry forward. On sale, claimed depreciation is recaptured at up to 25%, and gains may owe capital-gains tax (a 1031 exchange can defer both). Figures are a year-1 estimate at your 24.0% rate — not tax advice; consult a CPA.
Schools (NCES district)
- District
- Mobile County
- NCES district ID
- 0102370
- Math proficiency
- 15% ▼ -28.00%
- Reading proficiency
- 39% ▬ 0.00%
- Median HH income
- $42,455
- Composite
- 22.9/100
- National rank
- #8002
- State rank
- #81 of 129 in AL
Livability — Mobile
- Score
- 75/100
- State rank
- #20
- US rank
- #4262
Category grades
Schools grade is shown separately in the Schools card above.
Census & demographics
- Census place
- Mobile, AL
- County
- Mobile County · 246,577 people
- City population
- 205,729
- Metro
- Mobile, AL
- Population (ZIP)
- 18,728
- Household income
- $51,303
- Rent vs Own
- Severe rent burden
- 999.0
Population outlook (Mobile County) Hauer SSP2
- Today (2025)
- 415,303 people
- By 2030
- 411,755 · -0.9%
- By 2040
- 399,670 · -3.8%
- By 2050
- 382,616 · -7.9%
- By 2075
- 337,353 · -18.8%
- By 2100
- 283,391 · -31.8%
Race, ethnicity, and origin ACS 2023
- Neighborhood character
- Majority Black (56%)
- Race & ethnicity
- Black 56% White 37% Two or more races 5% Hispanic / Latino 4%
- Common ancestry
- Italian 2% Scottish 2% Lithuanian 1%
- Foreign-born
- 3% · Canada
- Languages at home
- 96% English-only · Spanish 3%
Political lean MEDSL · Mobile
- 2024 margin
- R (+16.4) · D 41.3% · R 57.7%
- 2008→2024 swing
- -7.7pp toward R · 2008: -8.7pp · 2024: -16.4pp
- All cycles
- 2024: R+16.4 2020: R+11.9 2016: R+13.9 2012: R+9.3 2008: R+8.7
Not yet ingested
- Civics
- —
Market trends
- HPI YoY
- ▼ -232.19%
- Current HPI
- 145.9025
- Rent YoY
- ▲ 5.06%
- Metro
- Mobile, AL
- State GDP YoY
- ▲ 2.94%
- F500 in state
- 4
Industry mix (Fortune 500 HQ in AL)
| Industry | F500 HQs | Revenue |
|---|---|---|
| Financial Services | 1 | $8B |
|
||
| Healthcare | 1 | $5B |
|
||
Price history
+170.8% since first listed7 events — show timeline
- 2026-04-26 Pending — GCMLS AL
- 2026-04-21 Relisted — GCMLS AL
- 2026-03-13 Pending — GCMLS AL
- 2026-03-13 Delisted — GCMLS AL
- 2026-03-12 Listed $89,900 GCMLS AL
- 2006-04-13 Sold (Public Records) $114,598 Public Records
- 2005-05-26 Sold (Public Records) $33,200 Public Records
Property tax history
+9.0%/yrLatest (2025): $591 · +0.0% YoY. Source: county tax records.
Cash-flow waterfall
monthlySold comps — $/sqft
last 12 mo · ≤1 miLoading sold comps…