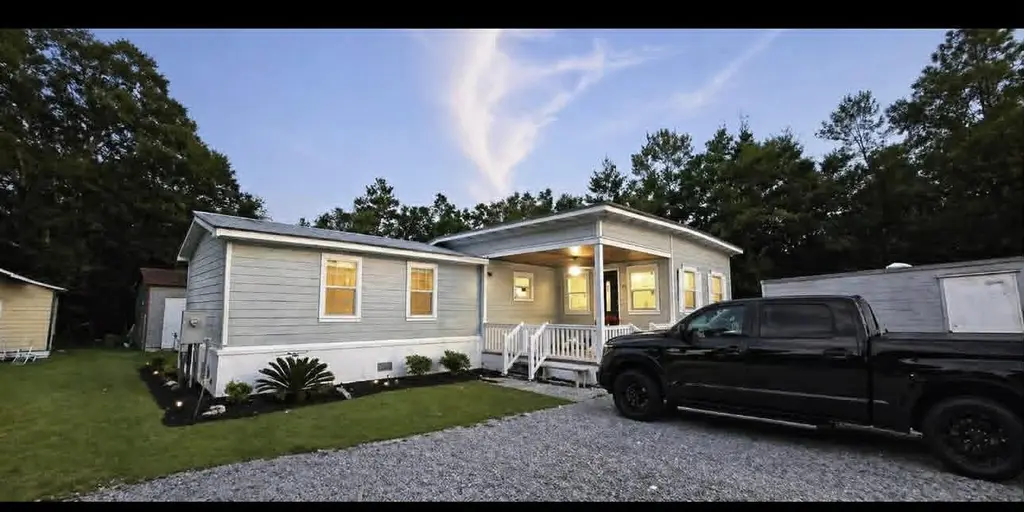
266 Smith Rd · DeFuniak Springs, FL
Flood risk 1/10 · Minimal
- FEMA flood zone
- X (unshaded)
- Chance of flooding over 30 yrs
- 0.0%
- Est. flood insurance / yr
- $507 – $1,088
Fire risk 5/10 · Moderate
- Est. fire insurance / yr
- $947 – $1,759
Heat risk 9/10 · Severe
- Hot days now (above 107°F)
- 7 days/yr
- Hot days in 30 yrs
- 19 days/yr
Wind risk 9/10 · Severe
- Chance of severe wind over 30 yrs
- 99.0%
Air-quality risk 1/10 · Minimal
- Unhealthy air days now
- 0 days/yr
- Unhealthy air days in 30 yrs
- 0 days/yr
Risk factors via First Street. Map © Google.
Why this score? — see what drove the B- grade
The composite is a weighted blend of 9 inputs, each scored 0–100. Each bar is that input's sub-score; the figure is the points it added to the 100-point composite (weight × sub-score).
- Cash flow +23.2/30.0
- Appreciation +10.0/10.0
- ARV discount +9.2/15.0
- DSCR +7.5/10.0
- Schools +5.2/10.0
- 1% rule +4.7/10.0
- Livability +3.2/5.0
- Rent growth +2.5/5.0
- Condition / age +2.5/5.0
$179,000
🖨 Deal sheet 📄 Offer letter ✓ Due diligence
Listing remarks
Beautifully updated 4-bedroom, 3-bath home offering modern finishes and peaceful privacy on a spacious wooded lot. Inside, you'll find an open-concept layout, fresh neutral tones, upgraded lighting, and a stylish kitchen with custom cabinetry, center island, and ample counter space. Both bathrooms have been tastefully renovated with quality finishes, including a stunning primary bath with oversized vanity. The split-bedroom floor plan provides comfort and functionality for everyday living. Outside, enjoy plenty of room for vehicles, boats, or toys, plus a workshop, a separate storage shed, and a screened-in back porch perfect for relaxing or entertaining. Convenient country setting with roo
Key facts
- Custom cabinetry
- Ample counter space
- Updated home
Tags
Property features AI
Finance
- HOA & community: Located in the Oakwood Hills subdivision
Exterior
- Utilities: Public water; Septic tank
- Home design: Manufactured home; Single-story
- Construction: Built in 1995
- Exterior features: Paved road access; Paved road surface; Lot dimensions approximately 200 x 300
Interior
- Bedrooms: 4 bedrooms; Master bedroom on the first floor
- Bathrooms: 3 bathrooms (all full)
- Heating & cooling: Central heating; Central air conditioning; Electric heat controls
- Interior features: Living room on the first floor; 6 total rooms
Neighborhood map
What this means for you Summary
Snapshot
- This is a 3-bed/2.0-bath manufactured listed at $179k.
Deal economics
- At list price, monthly cash flow is $324 ($4k/yr) — positive.
- The deal already cash-flows at list — no discount required.
- To meet the 1% rule (rent ≥ 1% of price), the offer needs to be $174k (2.7% below list).
- Recommended offer: $174k (3.0% below list) — sets the bar for market timing.
- Cap rate 8.5% vs local median 4.8% in DeFuniak Springs — top-decile yield for the area; either an underpriced asset or a hidden risk that comps aren't pricing in. Stress-test before assuming the spread holds.
Location & tenants
- Location reads 64/100 on livability (#694 in FL) — a middle-class / working-renter tenant base. Strengths: cost of living A+, housing A+; Watch: health & safety C-, crime D, amenities F.
- Walton (rural): math 62% / reading 61% proficiency, ranked #10 of 73 in FL (top 14%) — acceptable for families but not a draw, mixed tenant base, ~2y average lease.
- Zoned schools: Maude Saunders Elementary School (math 58% / reading 52%, grade C, #872 of 2,144 statewide, top 42%, 553 students, 87% FRL); Walton High School (math 52% / reading 53%, grade C-, #154 of 667 statewide, top 24%, 856 students, 65% FRL) — zoned schools average 76% FRL vs 48% district-wide (28 pts higher); higher-poverty schools than district average — tighter screening recommended.
- Market conditions: 422 active listings in the ZIP; 2,883 units permitted in Walton County in 2024 (1,322 in 5+ unit buildings).
Forward outlook
- In year one you build about $19k of equity ($1k loan paydown + $18k appreciation (10.0% local appreciation)).
- Walton County population projected at +46% by 2050 — long-run rental-demand tailwind backs the buy-and-hold thesis.
- At projected returns (10.0% appreciation + 3.0% rent growth), your $50k cash investment doubles in ~3 years — after that, you're playing with house money.
- By year 2, paydown + projected appreciation supports a ~$31k cash-out refi (75% LTV) — recoverable capital for the next deal without selling this one.
Negotiation context
- It's been on market 52 days — a 3% lower offer ($174k) is reasonable based on typical stale-listing flexibility.
- 7 sale attempts since 18y ago with the ask held roughly flat each time — persistent listings suggest the price (not the market) is what's stuck; bring a comps-based counter.
- Current owner paid $40k; list at $179k implies a 348% gain — meaningful room to come down on a strong offer.
Risks & watch-outs
- Climate carrying-cost: severe wind risk, 99% chance of damaging wind over 30y; moderate wildfire risk; extreme-heat days projected 7→19/yr by 2055 (HVAC capex compounding) — expect insurance premiums to compound above CPI over the hold.
Questions for the listing agent
- It's been on market 52 days. Have you received any prior offers? Is the seller open to a 3% concession, seller financing, or rate buy-down credit?
- Is there a deadline driving the sale (1031 exchange, divorce, estate, relocation)? That informs how much negotiation room exists.
- Schools are D-rated, which usually means shorter tenancies and higher turnover. Who's the typical renter profile here, and what's been the actual vacancy rate?
- Crime grade is D in this area — have there been break-ins, vandalism, or insurance claims at this property in the last 3 years? What carrier currently insures it and at what premium?
- What's the average days-on-market for RENTAL listings here right now (not sales)? A rising rental-DOM trend means longer vacancies and softer asking-rent achievability than the comps imply.
- What's the recent tenant-quality profile in this submarket — average credit score on applications, eviction rate, late-payment / NSF rate, and stable-employment percentage? A property-management company in the area should have these aggregated.
- How much new for-sale + rental construction is in the pipeline within 1–3 miles? Heavy new supply typically softens prices + rents 12–24 months out; constrained supply supports both.
Investment metrics
- 1% rule
- 0.97% ✗
- Cap rate
- 8.47%
- Cash-on-cash
- 7.76%
- DSCR
- 1.35
- GRM
- 8.6
CMA / ARV
- ARV (on-the-fly)
- $186,010
- Comps found
- 1
Show comp detail 1 sale within ~0.75 mi
| Address | Dist | Beds/Ba | Sqft | Sold | Price | $/sf | Match |
|---|---|---|---|---|---|---|---|
| 714 E Picasso Cir | 0.29mi | 3/2.0 | 2,052 (+5%) | 2mo | $195,500 | $95 | 77 |
Match score weights: distance 35% · size 25% · config 20% · recency 20%. Top-matched comps best support the ARV.
Projected returns pro-forma
10.0% appreciation · 3.0% rent growth · sell at horizon
- IRR
- 29.9%
- Equity multiple
- 3.36×
- Total profit
- $118,046
- Equity at exit
- $161,257
- IRR
- 25.9%
- Equity multiple
- 7.61×
- Total profit
- $331,216
- Equity at exit
- $347,758
Cash invested: $50,120 (down + closing). Projections, not guarantees.
Landlord ↔ Tenant lean methodology
- Overall (STATE)
- 87 Strongly Landlord-Friendly
- State Florida
- 87 Strongly Landlord-Friendly · R+3
- County
- — inherits STATE
- City
- — inherits STATE
ZIP-level market 32433
- Home prices YoY
- 4.2%
- Active inventory
- 422
- Price-to-rent
- 8.6×
Monthly cashflow live
- Estimated rent
- $1,741 medium interval (Pro) →
- Mortgage (P&I)
- −$939
- Tax from tax record
- −$38 /mo · $455/yr
- Insurance
- −$75
- HOA
- −$0
- Vacancy / Maint / Mgmt
- −$366
- Net cashflow
- $324
Break-even live
UW: 25.0% down · 7.5% · 30yr · 1.5% tax · 5.0% vac · 8.0% maint · 8.0% mgmt
Financing live
Cash to close
- Down payment
- $44,750
- Closing costs
- $5,370
- Reserves months
- —
- Total cash needed
- —
Loan-product check · same deal, 3 products live
Conventional
25% down · 7.5% · 30yr
- Down + closing
- —
- Monthly P&I
- —
- Monthly cashflow
- —
- DSCR
- —
- Eligible?
- —
Personal DTI + credit; lowest rate.
DSCR
20% down · 8.5% · 30yr
- Down + closing
- —
- Monthly P&I
- —
- Monthly cashflow
- —
- DSCR
- —
- Eligible?
- —
No personal income docs; deal must DSCR.
Hard money
10% down · 12.0% · 12mo
- Down + closing
- —
- Monthly P&I
- —
- Monthly cashflow
- —
- DSCR
- —
- Eligible?
- —
Short-term bridge; refi at stabilization.
Listing history 31 events
-
2026-06-18days on market $179,000 Active 52 DOM
-
2026-06-17days on market $179,000 Active 51 DOM
-
2026-06-16days on market $179,000 Active 50 DOM
-
2026-06-15days on market $179,000 Active 49 DOM
-
2026-06-14days on market $179,000 Active 47 DOM
-
2026-06-13days on market $179,000 Active 46 DOM
-
2026-06-10days on market $179,000 Active 44 DOM
-
2026-06-09days on market $179,000 Active 43 DOM
-
2026-06-08days on market $179,000 Active 42 DOM
-
2026-06-07days on market $179,000 Active 41 DOM
-
2026-06-05days on market $179,000 Active 38 DOM
-
2026-06-03days on market $179,000 Active 37 DOM
-
2026-06-03days on market $179,000 Active 36 DOM
-
2026-06-01days on market $179,000 Active 35 DOM
-
2026-05-31days on market $179,000 Active 34 DOM
-
2026-05-30days on market $179,000 Active 33 DOM
-
2026-04-27$179,000 Active
-
2018-10-26historical
-
2018-04-26$305,000
-
2018-04-26$305,000
-
2016-08-16soldstatus $40,000
-
2016-08-11soldstatus $40,000
-
2016-08-11soldstatus $40,000
-
2016-08-03$40,000
-
2010-09-02soldstatus $46,000
-
2010-04-30soldstatus $46,000
-
2010-04-30soldstatus $46,000
-
2010-04-01$46,000
-
2010-04-01$46,000
-
2008-01-09$49,500
-
2000-02-28soldstatus $15,000
ⓘ Source: listings_history table (triggers on properties + properties_extension) + one-shot
backfill from property_details.listing_events for pre-trigger history.
Tax reassessment forecast FL · Resets to sale price
- Current annual tax
- $455 · $38/mo
- Projected year-2 tax
- $1,486 · $124/mo
- Expected delta
- +$1,031/yr (+$86/mo · 226.5%)
ⓘ Screening estimate from a state-policy table — verify with the county assessor before closing.
Climate risk First Street
- Flood 1/10 Low FEMA zone X (unshaded) · 0% chance over 30 yrs
- Wildfire 5/10 Major
- Heat 9/10 Extreme 7 d/yr ≥107°F today · 19 d/yr by 30 yrs out
- Wind 9/10 Extreme 99% chance of damaging wind over 30 yrs
- Air quality 1/10 Low 0 unhealthy d/yr today · 0 by 30 yrs out
Nearby sold comps map
Loading sold comps map…
Walkable amenities ~0.75 mi
Loading nearby amenities…
Taxation est. · year 1
- Rental income
- $20,892
- − Mortgage interest
- −$10,027
- − Property taxes
- −$455
- − Insurance
- −$895
- − Repairs & maintenance
- −$1,671
- − Management
- −$1,671
- − Depreciation
- −$5,207
- Taxable income
- $965
- Est. tax owed @ 24.0%
- −$232
- After-tax cash flow
- $3,658/yr
For passive investors: Depreciation is non-cash, so a rental often shows a tax loss while cash-flowing — sheltering income. Rental losses are passive: they offset passive income freely, and up to $25,000/yr can offset ordinary (W-2) income if you actively participate and your MAGI is under $100k (phasing out to $0 by $150k); unused losses carry forward. On sale, claimed depreciation is recaptured at up to 25%, and gains may owe capital-gains tax (a 1031 exchange can defer both). Figures are a year-1 estimate at your 24.0% rate — not tax advice; consult a CPA.
Schools (NCES district)
- District
- Walton
- NCES district ID
- 1201980
- Math proficiency
- 62% ▼ -4.00%
- Reading proficiency
- 61% ▼ -2.00%
- Median HH income
- $46,794
- Composite
- 52.03/100
- National rank
- #1634
- State rank
- #10 of 73 in FL
Livability — DeFuniak Springs
- Score
- 64/100
- State rank
- #694
- US rank
- #14475
Category grades
Schools grade is shown separately in the Schools card above.
Census & demographics
- County
- Walton County · 70,839 people
- City population
- 19,746
- Metro
- Crestview-Fort Walton Beach-Destin, FL
- Population (ZIP)
- 19,746
- Household income
- $52,199
- Rent vs Own
- Severe rent burden
- 356.0
Population outlook (Walton County) Hauer SSP2
- Today (2025)
- 80,014 people
- By 2030
- 88,120 · +10.1%
- By 2040
- 103,537 · +29.4%
- By 2050
- 117,034 · +46.3%
- By 2075
- 143,901 · +79.8%
- By 2100
- 155,138 · +93.9%
Race, ethnicity, and origin ACS 2023
- Neighborhood character
- Predominantly White (75%)
- Race & ethnicity
- White 75% Black 10% Hispanic / Latino 8% Two or more races 7% Native American 1%
- Hispanic origin (detail)
- Mexican 5%
- Common ancestry
- Slovak 3% Italian 2% Lithuanian 2%
- Foreign-born
- 6% · Canada
- Languages at home
- 92% English-only · Spanish 4% Other Indo-European 1% French/Haitian/Cajun 1%
Political lean MEDSL · Walton
- 2024 margin
- Solid R (+57.8) · D 20.7% · R 78.6%
- 2008→2024 swing
- -12.0pp toward R · 2008: -45.8pp · 2024: -57.8pp
- All cycles
- 2024: R+57.8 2020: R+51.7 2016: R+56.1 2012: R+52.0 2008: R+45.8
Not yet ingested
- Civics
- —
Market trends
- HPI YoY
- ▲ 14.77%
- Current HPI
- 367.046
- Rent YoY
- —
- Metro
- Crestview-Fort Walton Beach-Destin, FL
- State GDP YoY
- ▲ 3.28%
- F500 in state
- 36
Industry mix (Fortune 500 HQ in FL)
| Industry | F500 HQs | Revenue |
|---|---|---|
| Industrial Technology | 2 | $29B |
|
||
| Insurance | 2 | $17B |
|
||
| Retail | 1 | $60B |
|
||
| Technology Distribution | 1 | $58B |
|
||
| Homebuilding | 1 | $35B |
|
||
| Technology Manufacturing | 1 | $35B |
|
||
Price history
+1093.3% since first listed15 events — show timeline
- 2026-04-27 Listed $179,000 ECAR
- 2018-10-26 Listing Removed — NAMLS
- 2018-04-26 Listed $305,000 NAMLS
- 2018-04-26 Listed $305,000 ECAR
- 2016-08-16 Sold (Public Records) $40,000 Public Records
- 2016-08-11 Sold (MLS) $40,000 NAMLS
- 2016-08-11 Sold (MLS) $40,000 ECAR
- 2016-08-03 Listed $40,000 NAMLS
- 2010-09-02 Sold (Public Records) $46,000 Public Records
- 2010-04-30 Sold (MLS) $46,000 ECAR
- 2010-04-30 Sold (MLS) $46,000 NAMLS
- 2010-04-01 Listed $46,000 ECAR
- 2010-04-01 Listed $46,000 NAMLS
- 2008-01-09 Listed $49,500 ECAR
- 2000-02-28 Sold (Public Records) $15,000 Public Records
Property tax history
+3.3%/yrLatest (2025): $455 · +2.1% YoY. Source: county tax records.
Cash-flow waterfall
monthlySold comps — $/sqft
last 12 mo · ≤1 miLoading sold comps…