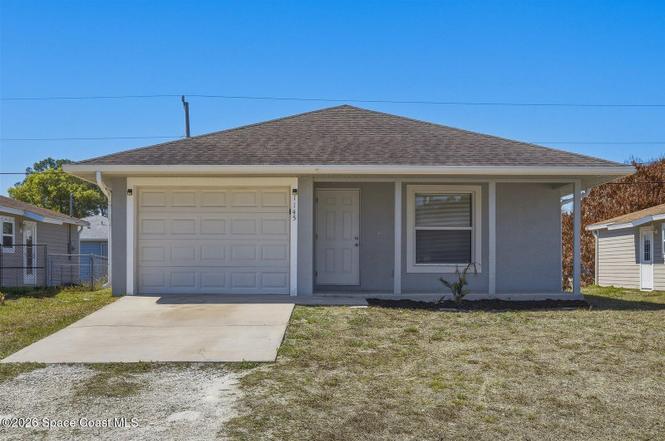
1145 11th Ct SW · Florida Ridge, FL
Flood risk 1/10 · Minimal
- FEMA flood zone
- X (unshaded)
- Chance of flooding over 30 yrs
- 0.0%
- Est. flood insurance / yr
- $507 – $1,088
Fire risk 2/10 · Minimal
- Est. fire insurance / yr
- $947 – $1,759
Heat risk 10/10 · Severe
- Hot days now (above 106°F)
- 7 days/yr
- Hot days in 30 yrs
- 24 days/yr
Wind risk 10/10 · Severe
- Chance of severe wind over 30 yrs
- 99.0%
Air-quality risk 1/10 · Minimal
- Unhealthy air days now
- 0 days/yr
- Unhealthy air days in 30 yrs
- 0 days/yr
Risk factors via First Street. Map © Google.
Why this score? — see what drove the D grade
The composite is a weighted blend of 9 inputs, each scored 0–100. Each bar is that input's sub-score; the figure is the points it added to the 100-point composite (weight × sub-score).
- Cash flow +11.6/30.0
- ARV discount +7.9/15.0
- Schools +4.2/10.0
- Livability +3.6/5.0
- Rent growth +3.5/5.0
- DSCR +3.4/10.0
- 1% rule +3.3/10.0
- Condition / age +2.5/5.0
- Appreciation +0.0/10.0
$257,500
🖨 Deal sheet 📄 Offer letter ✓ Due diligence
Listing remarks MLS
This is a well built 3-bedroom 2 bath 1 car garage home is Oslo Park. Close to downtown, schools. parks beaches. and shopping. good sized yard. tile floors, throughout. tenant occupied until 2/28 --Broker is related to seller.--
Key facts
- Modernized kitchen
- Upgraded countertops
- Split floor plan
Tags
Property features AI
Finance
- Other: Living area approximately 1,155; Additional parcel: 8684700
Exterior
- Parking: Garage (1 space)
- Utilities: Septic tank; Electricity available; Water available
- Home design: Single family residence; One story; Faces south
- Construction: Block, concrete and stucco construction
- Exterior features: Cleared lot
Interior
- Kitchen: Dishwasher; Electric oven; Microwave
- Bedrooms: 3 bedrooms
- Flooring: Tile
- Bathrooms: 2 full bathrooms
- Heating & cooling: Central heating; Central air conditioning
- Interior features: Tile flooring
- Laundry & utility: Washer hookup; Electric dryer hookup
Neighborhood map
What this means for you Summary
Snapshot
- This is a 3-bed/2.0-bath single-family listed at $258k.
Deal economics
- At list price, monthly cash flow is $-81 ($-974/yr) — negative.
- To cash-flow at today's rent, offer at most $243k (5.6% below list).
- To meet the 1% rule (rent ≥ 1% of price), the offer needs to be $215k (16.6% below list).
- Recommended offer: $215k (16.6% below list) — sets the bar for 1% rule.
- Cap rate 5.9% vs local median 4.5% in Florida Ridge — top-decile yield for the area; either an underpriced asset or a hidden risk that comps aren't pricing in. Stress-test before assuming the spread holds.
Location & tenants
- Location reads 72/100 on livability (#353 in FL) — a middle-class / working-renter tenant base. Strengths: commute A+, cost of living A+, housing A+; Watch: schools D, employment D, amenities F.
- Indian River (other): math 48% / reading 52% proficiency, ranked #35 of 73 in FL (top 48%) — acceptable for families but not a draw, mixed tenant base, ~2y average lease.
- Market conditions: Rents rising fast (+4.2%/yr); 348 active listings in the ZIP; 12 comparable units currently listed for rent nearby; rentals at typical pace (median 21d on market — plan ~3-4 weeks tenant-placement turnaround); 564 units permitted in Indian River County in 2024 (281 in 5+ unit buildings).
- This rent runs 39% of the median local income ($67k/yr) — at the standard rent-burdened threshold; future hikes will face affordability resistance.
Forward outlook
- Local home prices are declining (-3.0%/yr); year-one equity from $2k of loan paydown is wiped out by about $8k of value loss. Plan a longer hold.
- Indian River County population projected at +18% by 2050 — long-run rental-demand tailwind backs the buy-and-hold thesis.
Negotiation context
- It's been on market 83 days — a 6% lower offer ($242k) is reasonable based on typical stale-listing flexibility.
- 7 sale attempts since 4y ago with the ask held roughly flat each time — persistent listings suggest the price (not the market) is what's stuck; bring a comps-based counter.
Risks & watch-outs
- Climate carrying-cost: severe wind risk, 99% chance of damaging wind over 30y; extreme-heat days projected 7→24/yr by 2055 (HVAC capex compounding) — expect insurance premiums to compound above CPI over the hold.
Questions for the listing agent
- What do current leases actually rent for vs. the listed asking? Can we see a recent rent roll and the last 12 months of T-12 income?
- It's been on market 83 days. Have you received any prior offers? Is the seller open to a 17% concession, seller financing, or rate buy-down credit?
- Why hasn't it sold? Are there any deal-killer items the seller is aware of (foundation, flood, title, zoning, code violations)?
- Is there a deadline driving the sale (1031 exchange, divorce, estate, relocation)? That informs how much negotiation room exists.
- Schools are D-rated, which usually means shorter tenancies and higher turnover. Who's the typical renter profile here, and what's been the actual vacancy rate?
- The area grade is low — what's the realistic commute time and amenity access for the typical tenant pool here? Any planned neighborhood developments (good or bad) we should know about?
- What's the average days-on-market for RENTAL listings here right now (not sales)? A rising rental-DOM trend means longer vacancies and softer asking-rent achievability than the comps imply.
- What's the recent tenant-quality profile in this submarket — average credit score on applications, eviction rate, late-payment / NSF rate, and stable-employment percentage? A property-management company in the area should have these aggregated.
- How much new for-sale + rental construction is in the pipeline within 1–3 miles? Heavy new supply typically softens prices + rents 12–24 months out; constrained supply supports both.
Investment metrics
- 1% rule
- 0.83% ✗
- Cap rate
- 5.91%
- Cash-on-cash
- -1.35%
- DSCR
- 0.94
- GRM
- 10.0
CMA / ARV
- ARV (on-the-fly)
- $259,875
- Comps found
- 12
Show comp detail 12 sales within ~0.75 mi
| Address | Dist | Beds/Ba | Sqft | Sold | Price | $/sf | Match |
|---|---|---|---|---|---|---|---|
| 1175 13th Ave SW | 0.21mi | 3/2.0 | 1,118 (-3%) | 2mo | $270,000 | $242 | 83 |
| 1140 11th Ter SW | 0.02mi | 3/2.0 | 984 (-15%) | 3mo | $215,000 | $218 | 72 |
| 1255 18th Ave SW | 0.53mi | 3/1.0 | 1,152 (-0%) | 1mo | $229,000 | $199 | 70 |
| 1221 18th Ave SW | 0.52mi | 3/2.0 | 1,176 (+2%) | 4mo | $195,000 | $166 | 69 |
| 1210 12th Ct SW | 0.15mi | 3/2.0 | 1,314 (+14%) | 2mo | $295,000 | $225 | 68 |
| 1150 19th Ave SW | 0.54mi | 3/2.0 | 1,128 (-2%) | 4mo | $264,900 | $235 | 67 |
| 1365 19th Ave SW | 0.62mi | 3/2.0 | 1,170 (+1%) | 4mo | $299,000 | $256 | 66 |
| 1550 17th Ct SW | 0.66mi | 3/2.0 | 1,152 (-0%) | 5mo | $240,000 | $208 | 65 |
| 1195 13th Ave SW | 0.21mi | 3/2.0 | 1,314 (+14%) | 6mo | $299,000 | $228 | 62 |
| 1320 21st Ave SW | 0.72mi | 2/2.0 (-1) | 1,146 (-1%) | 9mo | $239,000 | $209 | 53 |
| 1435 17th Ct SW | 0.58mi | 3/2.0 | 1,280 (+11%) | 6mo | $239,900 | $187 | 50 |
| 1420 18th Ave SW | 0.59mi | 2/1.0 (-1) | 1,090 (-6%) | 9mo | $250,000 | $229 | 47 |
Match score weights: distance 35% · size 25% · config 20% · recency 20%. Top-matched comps best support the ARV.
Projected returns pro-forma
-3.0% appreciation · 4.18% rent growth · sell at horizon
- IRR
- -17.2%
- Equity multiple
- 0.39×
- Total profit
- $-44,288
- Equity at exit
- $38,394
- IRR
- -7.1%
- Equity multiple
- 0.52×
- Total profit
- $-34,261
- Equity at exit
- $22,264
Cash invested: $72,100 (down + closing). Projections, not guarantees.
Landlord ↔ Tenant lean methodology
- Overall (STATE)
- 87 Strongly Landlord-Friendly
- State Florida
- 87 Strongly Landlord-Friendly · R+3
- County
- — inherits STATE
- City
- — inherits STATE
ZIP-level market 32962
- Rents YoY
- 4.2%
- Active inventory
- 348
- Price-to-rent
- 10.0×
Monthly cashflow live
- Estimated rent
- $2,146 high interval (Pro) →
- Mortgage (P&I)
- −$1,350
- Tax from tax record
- −$319 /mo · $3,830/yr
- Insurance
- −$107
- HOA
- −$0
- Vacancy / Maint / Mgmt
- −$451
- Net cashflow
- $-81
Break-even live
UW: 25.0% down · 7.5% · 30yr · 1.5% tax · 5.0% vac · 8.0% maint · 8.0% mgmt
Financing live
Cash to close
- Down payment
- $64,375
- Closing costs
- $7,725
- Reserves months
- —
- Total cash needed
- —
Loan-product check · same deal, 3 products live
Conventional
25% down · 7.5% · 30yr
- Down + closing
- —
- Monthly P&I
- —
- Monthly cashflow
- —
- DSCR
- —
- Eligible?
- —
Personal DTI + credit; lowest rate.
DSCR
20% down · 8.5% · 30yr
- Down + closing
- —
- Monthly P&I
- —
- Monthly cashflow
- —
- DSCR
- —
- Eligible?
- —
No personal income docs; deal must DSCR.
Hard money
10% down · 12.0% · 12mo
- Down + closing
- —
- Monthly P&I
- —
- Monthly cashflow
- —
- DSCR
- —
- Eligible?
- —
Short-term bridge; refi at stabilization.
Rent comps 12 comps
| Address | Beds | Baths | Sqft | Rent | $/sqft | DOM | Units | Dist |
|---|---|---|---|---|---|---|---|---|
| 721 Timber Ridge Trl SW Unit D Vero Beach, FL | 2.0 | 2.0 | 1368 | $2,300 | $1.68 | 21d | 1 | 0.69mi |
| 650 N Center Ct SW Unit 102 Vero Beach, FL | 3.0 | 2.0 | 1440 | $2,100 | $1.46 | 21d | 1 | 0.82mi |
| 710 Timber Ridge Trl SW Vero Beach, FL | 3.0 | 2.0 | 1498 | $2,500 | $1.67 | 21d | 1 | 0.88mi |
| 734 5th Pl SW Vero Beach, FL | 3.0 | 1.0 | 1402 | $1,800 | $1.28 | 21d | 1 | 0.92mi |
| 826 Middleton Dr SW Vero Beach, FL | 3.0 | 2.0 | 1464 | $2,150 | $1.47 | 21d | 1 | 0.98mi |
| 2565 Langrove Ln SW Vero Beach, FL | 3.0 | 2.0 | 1464 | $2,000 | $1.37 | 21d | 1 | 1.07mi |
| 2619 Langrove Ln SW Unit 2619 Vero Beach, FL | 3.0 | 2.0 | 1464 | $2,450 | $1.67 | 21d | 1 | 1.12mi |
| 2543 Stockbridge Sq SW Vero Beach, FL | 3.0 | 2.0 | 1464 | $2,200 | $1.50 | 13d | 1 | 1.17mi |
| 355 6th Rd SW Vero Beach, FL | 3.0 | 1.0 | 880 | $1,800 | $2.05 | 21d | 1 | 1.17mi |
| 16 Vista Palm Ln Vero Beach, FL | 1.0–2.0 | 1.5–2.0 | 800 | $1,700 | $2.12 | 21d | 2 | 1.33mi |
| 161 6th Ct SW Vero Beach, FL | 2.0 | 1.0 | 1298 | $1,590 | $1.22 | 13d | 1 | 1.38mi |
| 985 23rd Pl SW Vero Beach, FL | 3.0 | 2.0 | 1176 | $2,200 | $1.87 | 21d | 1 | 1.50mi |
Listing history 25 events
-
2026-05-20status Pending
-
2026-05-15price $257,500
-
2026-03-13price $265,000
-
2026-02-26$269,900 Active
-
2024-02-15historical $1,845
-
2024-02-14historical $1,845
-
2024-02-02price $1,845
-
2024-01-31price $1,895
-
2024-01-20price $1,945
-
2024-01-08$1,995
-
2024-01-06price $1,995
-
2023-12-19$2,045
-
2023-12-13historical $1,845
-
2023-12-13historical $1,845
-
2023-11-24$1,845
-
2023-11-15$1,845
-
2023-10-20historical $1,845
-
2023-10-13$1,845
-
2022-04-06soldstatus $287,000 Closed 230-char remark
Show marketing remark (230 chars)
This is a well built 3-bedroom 2 bath 1 car garage home is Oslo Park. Close to downtown, schools. parks beaches. and shopping. good sized yard. tile floors, throughout. tenant occupied until 2/28 --Broker is related to seller.--
-
2022-02-22historical Active Under Contract 230-char remark
Show marketing remark (230 chars)
This is a well built 3-bedroom 2 bath 1 car garage home is Oslo Park. Close to downtown, schools. parks beaches. and shopping. good sized yard. tile floors, throughout. tenant occupied until 2/28 --Broker is related to seller.--
-
2022-02-15$268,000 Active 230-char remark
Show marketing remark (230 chars)
This is a well built 3-bedroom 2 bath 1 car garage home is Oslo Park. Close to downtown, schools. parks beaches. and shopping. good sized yard. tile floors, throughout. tenant occupied until 2/28 --Broker is related to seller.--
-
2022-02-01historical $268,000 230-char remark
Show marketing remark (230 chars)
This is a well built 3-bedroom 2 bath 1 car garage home is Oslo Park. Close to downtown, schools. parks beaches. and shopping. good sized yard. tile floors, throughout. tenant occupied until 2/28 --Broker is related to seller.--
-
2006-08-18soldstatus $181,800
-
2005-01-20soldstatus $19,000
-
2004-12-29soldstatus $13,000
ⓘ Source: listings_history table (triggers on properties + properties_extension) + one-shot
backfill from property_details.listing_events for pre-trigger history.
Tax reassessment forecast FL · Resets to sale price
- Current annual tax
- $3,830 · $319/mo
- Projected year-2 tax
- $3,830 · $319/mo
- Expected delta
- $0/yr ($0/mo · 0.0%)
ⓘ Screening estimate from a state-policy table — verify with the county assessor before closing.
Climate risk First Street
- Flood 1/10 Low FEMA zone X (unshaded) · 0% chance over 30 yrs
- Wildfire 2/10 Low
- Heat 10/10 Extreme 7 d/yr ≥106°F today · 24 d/yr by 30 yrs out
- Wind 10/10 Extreme 99% chance of damaging wind over 30 yrs
- Air quality 1/10 Low 0 unhealthy d/yr today · 0 by 30 yrs out
Nearby sold comps map
Loading sold comps map…
Walkable amenities ~0.75 mi
Loading nearby amenities…
Taxation est. · year 1
- Rental income
- $25,756
- − Mortgage interest
- −$14,424
- − Property taxes
- −$3,830
- − Insurance
- −$1,288
- − Repairs & maintenance
- −$2,061
- − Management
- −$2,061
- − Depreciation
- −$7,491
- Taxable loss
- −$5,397
- Est. tax savings @ 24.0%
- +$1,295
- After-tax cash flow
- $321/yr
For passive investors: Depreciation is non-cash, so a rental often shows a tax loss while cash-flowing — sheltering income. Rental losses are passive: they offset passive income freely, and up to $25,000/yr can offset ordinary (W-2) income if you actively participate and your MAGI is under $100k (phasing out to $0 by $150k); unused losses carry forward. On sale, claimed depreciation is recaptured at up to 25%, and gains may owe capital-gains tax (a 1031 exchange can defer both). Figures are a year-1 estimate at your 24.0% rate — not tax advice; consult a CPA.
Schools (NCES district)
- District
- Indian River
- NCES district ID
- 1200930
- Math proficiency
- 48% ▼ -9.00%
- Reading proficiency
- 52% ▼ -3.00%
- Median HH income
- $46,597
- Composite
- 42.45/100
- National rank
- #3218
- State rank
- #35 of 73 in FL
Livability — Florida Ridge
- Score
- 72/100
- State rank
- #353
- US rank
- #6129
Category grades
Schools grade is shown separately in the Schools card above.
Census & demographics
- Census place
- Florida Ridge, FL
- County
- Indian River County · 143,738 people
- City population
- 25,629
- Metro
- Sebastian-Vero Beach, FL
- Population (ZIP)
- 25,522
- Household income
- $66,664
- Rent vs Own
- Severe rent burden
- 425.0
Population outlook (Indian River County) Hauer SSP2
- Today (2025)
- 165,104 people
- By 2030
- 172,869 · +4.7%
- By 2040
- 185,640 · +12.4%
- By 2050
- 194,465 · +17.8%
- By 2075
- 211,115 · +27.9%
- By 2100
- 211,781 · +28.3%
Race, ethnicity, and origin ACS 2023
- Neighborhood character
- Predominantly White (70%)
- Race & ethnicity
- White 70% Black 13% Hispanic / Latino 12% Two or more races 5% Native American 1%
- Hispanic origin (detail)
- Mexican 1% Puerto Rican 2% Cuban 1%
- Common ancestry
- Romanian 4% Lithuanian 4% Italian 3%
- Foreign-born
- 12% · Canada, Jamaica, Dominican Republic
- Languages at home
- 85% English-only · Spanish 9% Other Indo-European 2% French/Haitian/Cajun 1%
Political lean MEDSL · Indian River
- 2024 margin
- Strong R (+27.4) · D 36.0% · R 63.4%
- 2008→2024 swing
- -12.5pp toward R · 2008: -14.8pp · 2024: -27.4pp
- All cycles
- 2024: R+27.4 2020: R+21.6 2016: R+24.5 2012: R+22.3 2008: R+14.8
Not yet ingested
- Civics
- —
Market trends
- HPI YoY
- ▼ -182.13%
- Current HPI
- 333.3274
- Rent YoY
- ▲ 4.18%
- Metro
- Sebastian-Vero Beach, FL
- State GDP YoY
- ▲ 3.28%
- F500 in state
- 36
Industry mix (Fortune 500 HQ in FL)
| Industry | F500 HQs | Revenue |
|---|---|---|
| Industrial Technology | 2 | $29B |
|
||
| Insurance | 2 | $17B |
|
||
| Retail | 1 | $60B |
|
||
| Technology Distribution | 1 | $58B |
|
||
| Homebuilding | 1 | $35B |
|
||
| Technology Manufacturing | 1 | $35B |
|
||
Price history
+1880.8% since first listed25 events — show timeline
- 2026-05-20 Pending — SCMLS
- 2026-05-15 Price Changed $257,500 SCMLS
- 2026-03-13 Price Changed $265,000 SCMLS
- 2026-02-26 Listed $269,900 SCMLS
- 2024-02-15 Rental Removed $1,845 SCMLS
- 2024-02-14 Rental Removed $1,845 RENT.
- 2024-02-02 Price Changed $1,845 RENT.
- 2024-01-31 Price Changed $1,895 SCMLS
- 2024-01-20 Price Changed $1,945 RENT.
- 2024-01-08 Listed for Rent $1,995 SCMLS
- 2024-01-06 Price Changed $1,995 RENT.
- 2023-12-19 Listed for Rent $2,045 RENT.
- 2023-12-13 Rental Removed $1,845 SCMLS
- 2023-12-13 Rental Removed $1,845 RENT.
- 2023-11-24 Listed for Rent $1,845 SCMLS
- 2023-11-15 Listed for Rent $1,845 RENT.
- 2023-10-20 Rental Removed $1,845 RENT.
- 2023-10-13 Listed for Rent $1,845 RENT.
- 2022-04-06 Sold (MLS) $287,000 Beaches MLS
- 2022-02-22 Contingent — Beaches MLS
- 2022-02-15 Listed $268,000 Beaches MLS
- 2022-02-01 Coming Soon $268,000 Beaches MLS
- 2006-08-18 Sold (Public Records) $181,800 Public Records
- 2005-01-20 Sold (Public Records) $19,000 Public Records
- 2004-12-29 Sold (Public Records) $13,000 Public Records
Property tax history
+11.4%/yrLatest (2025): $3,830 · +15.9% YoY. Source: county tax records.
Cash-flow waterfall
monthlySold comps — $/sqft
last 12 mo · ≤1 miLoading sold comps…