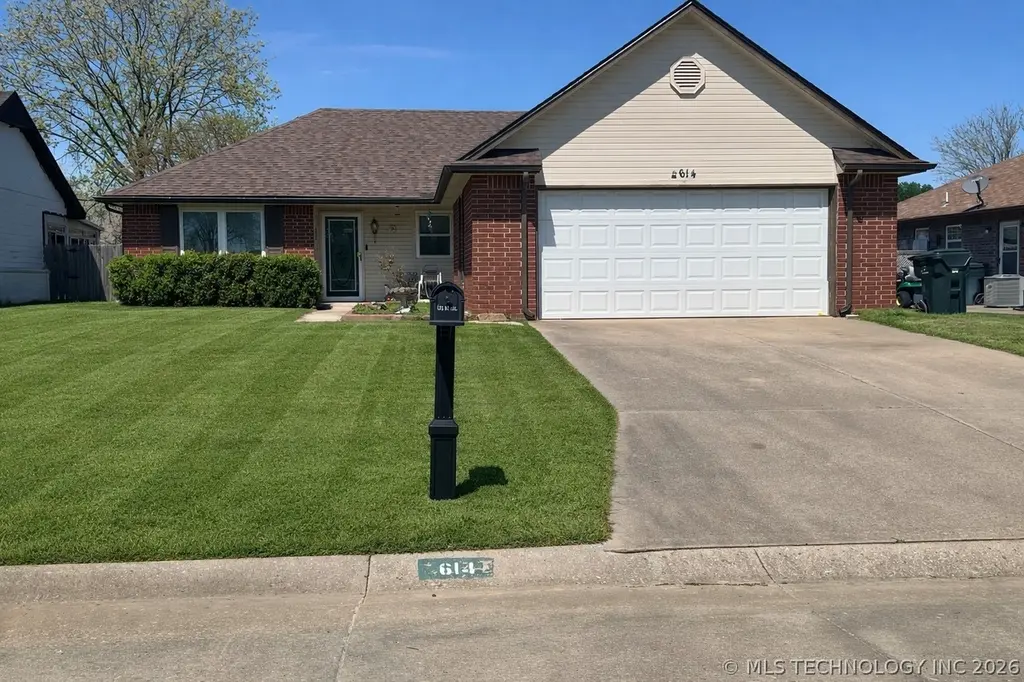
614 W 20th St S · Claremore, OK
Flood risk 1/10 · Minimal
- FEMA flood zone
- X (unshaded)
- Chance of flooding over 30 yrs
- 0.0%
- Est. flood insurance / yr
- $507 – $1,088
Fire risk 4/10 · Minor
- Est. fire insurance / yr
- $2,463 – $4,575
Heat risk 7/10 · Major
- Hot days now (above 110°F)
- 7 days/yr
- Hot days in 30 yrs
- 20 days/yr
Wind risk 2/10 · Minimal
- Chance of severe wind over 30 yrs
- 2.0%
Air-quality risk 2/10 · Minimal
- Unhealthy air days now
- 1 days/yr
- Unhealthy air days in 30 yrs
- 1 days/yr
Risk factors via First Street. Map © Google.
Why this score? — see what drove the D+ grade
The composite is a weighted blend of 9 inputs, each scored 0–100. Each bar is that input's sub-score; the figure is the points it added to the 100-point composite (weight × sub-score).
- ARV discount +15.0/15.0
- Cash flow +13.7/30.0
- DSCR +4.1/10.0
- 1% rule +3.8/10.0
- Livability +3.7/5.0
- Rent growth +2.5/5.0
- Condition / age +2.5/5.0
- Schools +2.1/10.0
- Appreciation +0.0/10.0
$185,000
🖨 Deal sheet 📄 Offer letter ✓ Due diligence
Listing remarks MLS
This is it! Beautifully maintained, move in ready. Landscaped with gorgeous plantings & roses. Newer neutral carpet, all appliances stay (includes refrigerator and washer & dryer). Florida room heated/cooled.
Key facts
- Full brick
- Newer roof
- Sun room
Tags
Property features AI
Finance
- HOA & community: Sidewalks; Gutters (community feature)
Exterior
- Parking: Attached garage; 2-car garage
- Security: Leased security system; Smoke detectors; No safety shelter
- Utilities: Electricity available; Natural gas available; Public water; Public sewer; Phone available
- Home design: Single-story home; Faces south; Slab foundation
- Construction: Brick, HardiPlank type and wood frame construction; Asphalt/fiberglass roof; Built per public records
- Exterior features: Covered, enclosed patio/porch; Concrete driveway; Rain gutters; Privacy fencing
Interior
- Kitchen: Kitchen with island; Gas range and gas oven connections; Oven; Range; Dishwasher; Disposal
- Bedrooms: Master bedroom with private bath and walk-in closet (First floor); Additional bedroom with walk-in closet (First floor); Additional bedroom with walk-in closet (First floor); Bonus room (First floor)
- Flooring: Carpet; Tile
- Bathrooms: Master bath with double sinks and full bath (First floor); Hall bath with bathtub, double sink and full bath (First floor); Total of 2 full bathrooms
- Heating & cooling: Central heating (gas); Central air; Programmable thermostat
- Interior features: High ceilings with vaulted areas; Ceiling fans; Ceramic and laminate counters; High-speed internet available; Storm door(s); Vinyl windows
- Laundry & utility: Inside utility room (First floor); Washer hookup; Gas dryer hookup; Gas water heater
Neighborhood map
What this means for you Summary
Snapshot
- This is a 3-bed/2.0-bath single-family listed at $185k.
Deal economics
- At list price, monthly cash flow is $14 ($162/yr) — positive.
- The deal already cash-flows at list — no discount required.
- To meet the 1% rule (rent ≥ 1% of price), the offer needs to be $164k (11.6% below list).
- Recommended offer: $164k (11.6% below list) — sets the bar for 1% rule.
- Cap rate 6.4% vs local median 4.1% in Claremore — top-decile yield for the area; either an underpriced asset or a hidden risk that comps aren't pricing in. Stress-test before assuming the spread holds.
Location & tenants
- Location reads 73/100 on livability (#20 in OK) — a middle-class / working-renter tenant base. Strengths: cost of living A+, housing A+, health & safety A; Watch: schools D, amenities F, commute F.
- Claremore (town): math 24% / reading 25% proficiency, ranked #111 of 270 in OK (top 41%) — low school quality limits family demand, transient renter base, plan for 1-2y turnover.
- Market conditions: 118 active listings in the ZIP; 7 comparable units currently listed for rent nearby; rentals leasing fast (median 11d on market — plan ~1-2 weeks tenant-placement turnaround); solid renter incomes; 608 units permitted in Rogers County in 2024 (7 in 5+ unit buildings).
Forward outlook
- Local home prices are declining (-3.0%/yr); year-one equity from $1k of loan paydown is wiped out by about $6k of value loss. Plan a longer hold.
- Rogers County population projected at +16% by 2050 — long-run rental-demand tailwind backs the buy-and-hold thesis.
Negotiation context
- It's been on market 37 days — a 3% lower offer ($179k) is reasonable based on typical stale-listing flexibility.
- 3 sale attempts since 13y ago with the ask held roughly flat each time — persistent listings suggest the price (not the market) is what's stuck; bring a comps-based counter.
- Current owner paid $115k; list at $185k implies a 61% gain — meaningful room to come down on a strong offer.
Risks & watch-outs
- Climate carrying-cost: extreme-heat days projected 7→20/yr by 2055 (HVAC capex compounding) — expect insurance premiums to compound above CPI over the hold.
Questions for the listing agent
- It's been on market 37 days. Have you received any prior offers? Is the seller open to a 12% concession, seller financing, or rate buy-down credit?
- Is there a deadline driving the sale (1031 exchange, divorce, estate, relocation)? That informs how much negotiation room exists.
- Schools are D-rated, which usually means shorter tenancies and higher turnover. Who's the typical renter profile here, and what's been the actual vacancy rate?
- The area grade is low — what's the realistic commute time and amenity access for the typical tenant pool here? Any planned neighborhood developments (good or bad) we should know about?
- What's the average days-on-market for RENTAL listings here right now (not sales)? A rising rental-DOM trend means longer vacancies and softer asking-rent achievability than the comps imply.
- What's the recent tenant-quality profile in this submarket — average credit score on applications, eviction rate, late-payment / NSF rate, and stable-employment percentage? A property-management company in the area should have these aggregated.
- How much new for-sale + rental construction is in the pipeline within 1–3 miles? Heavy new supply typically softens prices + rents 12–24 months out; constrained supply supports both.
Investment metrics
- 1% rule
- 0.88% ✗
- Cap rate
- 6.38%
- Cash-on-cash
- 0.31%
- DSCR
- 1.01
- GRM
- 9.4
CMA / ARV
- ARV (on-the-fly)
- $241,530
- Comps found
- 12
Show comp detail 12 sales within ~0.75 mi
| Address | Dist | Beds/Ba | Sqft | Sold | Price | $/sf | Match |
|---|---|---|---|---|---|---|---|
| 618 W 19th St S | 0.06mi | 3/2.0 | 1,333 (-8%) | 4mo | $162,500 | $122 | 80 |
| 604 W 20th St S | 0.06mi | 3/2.0 | 1,333 (-8%) | 4mo | $205,000 | $154 | 80 |
| 1100 Colhurst Ln | 0.29mi | 3/2.0 | 1,557 (+7%) | 1mo | $260,000 | $167 | 74 |
| 2102 S Missouri Pl | 0.16mi | 3/2.5 | 1,262 (-13%) | 3mo | $212,000 | $168 | 66 |
| 2107 S Lakin Ln | 0.43mi | 3/2.0 | 1,337 (-8%) | 7mo | $229,215 | $171 | 60 |
| 116 W 11th St | 0.52mi | 3/2.5 | 1,348 (-7%) | 2mo | $229,000 | $170 | 59 |
| 2001 S Lubbock Dr | 0.40mi | 4/2.0 (+1) | 1,620 (+11%) | 1mo | $238,000 | $147 | 57 |
| 1105 W Lawton Rd | 0.54mi | 3/2.0 | 1,337 (-8%) | 6mo | $221,550 | $166 | 56 |
| 1008 W Lawton Rd | 0.49mi | 3/2.0 | 1,301 (-11%) | 6mo | $219,700 | $169 | 54 |
| 117 W 9th Pl S | 0.59mi | 3/2.0 | 1,240 (-15%) | 1mo | $205,000 | $165 | 47 |
| 1007 S Choctaw Pl | 0.70mi | 4/1.5 (+1) | 1,350 (-7%) | 2mo | $189,000 | $140 | 47 |
| 1004 W Lawton Rd | 0.58mi | 4/2.0 (+1) | 1,613 (+11%) | 6mo | $237,615 | $147 | 45 |
Match score weights: distance 35% · size 25% · config 20% · recency 20%. Top-matched comps best support the ARV.
Projected returns pro-forma
-3.0% appreciation · 3.0% rent growth · sell at horizon
- IRR
- -15.8%
- Equity multiple
- 0.44×
- Total profit
- $-29,092
- Equity at exit
- $27,584
- IRR
- -7.3%
- Equity multiple
- 0.53×
- Total profit
- $-24,124
- Equity at exit
- $15,995
Cash invested: $51,800 (down + closing). Projections, not guarantees.
Landlord ↔ Tenant lean methodology
- Overall (STATE)
- 83 Strongly Landlord-Friendly
- State Oklahoma
- 83 Strongly Landlord-Friendly · R+20
- County
- — inherits STATE
- City
- — inherits STATE
ZIP-level market 74019
- Home prices YoY
- -13.2%
- Active inventory
- 118
- Price-to-rent
- 9.4×
Monthly cashflow live
- Estimated rent
- $1,635 high interval (Pro) →
- Mortgage (P&I)
- −$970
- Tax est. 1.5%
- −$231 /mo · $2,775/yr
- Insurance
- −$77
- HOA
- −$0
- Vacancy / Maint / Mgmt
- −$343
- Net cashflow
- $14
Break-even live
UW: 25.0% down · 7.5% · 30yr · 1.5% tax · 5.0% vac · 8.0% maint · 8.0% mgmt
Financing live
Cash to close
- Down payment
- $46,250
- Closing costs
- $5,550
- Reserves months
- —
- Total cash needed
- —
Loan-product check · same deal, 3 products live
Conventional
25% down · 7.5% · 30yr
- Down + closing
- —
- Monthly P&I
- —
- Monthly cashflow
- —
- DSCR
- —
- Eligible?
- —
Personal DTI + credit; lowest rate.
DSCR
20% down · 8.5% · 30yr
- Down + closing
- —
- Monthly P&I
- —
- Monthly cashflow
- —
- DSCR
- —
- Eligible?
- —
No personal income docs; deal must DSCR.
Hard money
10% down · 12.0% · 12mo
- Down + closing
- —
- Monthly P&I
- —
- Monthly cashflow
- —
- DSCR
- —
- Eligible?
- —
Short-term bridge; refi at stabilization.
Rent comps 7 comps
| Address | Beds | Baths | Sqft | Rent | $/sqft | DOM | Units | Dist |
|---|---|---|---|---|---|---|---|---|
| 2001 S Cherokee Ave Claremore, OK | 3.0 | 2.0 | 1240 | $1,500 | $1.21 | 10d | 1 | 0.01mi |
| 1307 W Missouri Ave Claremore, OK | 4.0 | 2.0 | 1853 | $1,975 | $1.07 | 23d | 1 | 0.47mi |
| 2000 Frederick Rd Claremore, OK | 1.0–2.0 | 1.0–2.0 | 762 | $1,055 | $1.38 | 1d | 1 | 0.70mi |
| 2500 Frederick Rd Claremore, OK | 2.0 | 2.0 | 908 | $1,113 | $1.23 | 1d | 3 | 1.03mi |
| 2000 Hilltop Ln Claremore, OK | 2.0 | 1.5 | 972 | $1,000 | $1.03 | 1d | 1 | 1.15mi |
| 317 E Will Rogers Blvd Claremore, OK | 2.0 | 2.0 | 996 | $1,475 | $1.48 | 10d | 1 | 1.40mi |
| 318 E Will Rogers Blvd Claremore, OK | 2.0 | 1.0 | 1028 | $1,300 | $1.26 | 10d | 1 | 1.43mi |
Listing history 25 events
-
2026-06-18days on market $185,000 Active 37 DOM
-
2026-06-17price $185,000 Active 36 DOM
-
2026-06-17days on market $189,999 Active 36 DOM
-
2026-06-16days on market $189,999 Active 35 DOM
-
2026-06-15days on market $189,999 Active 34 DOM
-
2026-06-13days on market $189,999 Active 32 DOM
-
2026-06-10days on market $189,999 Active 29 DOM
-
2026-06-09days on market $189,999 Active 28 DOM
-
2026-06-08days on market $189,999 Active 27 DOM
-
2026-06-07days on market $189,999 Active 26 DOM
-
2026-06-05days on market $189,999 Active 23 DOM
-
2026-06-03days on market $189,999 Active 22 DOM
-
2026-06-02days on market $189,999 Active 21 DOM
-
2026-06-01days on market $189,999 Active 20 DOM
-
2026-05-31days on market $189,999 Active 19 DOM
-
2026-05-14status Active
-
2026-04-16historical
-
2026-04-14$189,999 Active
-
2013-07-08soldstatus $115,000
-
2013-06-24soldstatus $115,000 220-char remark
Show marketing remark (220 chars)
This is it! Beautifully maintained, move in ready. Landscaped with gorgeous plantings & roses. Newer neutral carpet, all appliances stay (includes refrigerator and washer & dryer). Florida room heated/cooled.
-
2013-06-03historical 220-char remark
Show marketing remark (220 chars)
This is it! Beautifully maintained, move in ready. Landscaped with gorgeous plantings & roses. Newer neutral carpet, all appliances stay (includes refrigerator and washer & dryer). Florida room heated/cooled.
-
2013-05-17$115,000 220-char remark
Show marketing remark (220 chars)
This is it! Beautifully maintained, move in ready. Landscaped with gorgeous plantings & roses. Newer neutral carpet, all appliances stay (includes refrigerator and washer & dryer). Florida room heated/cooled.
-
2000-07-01soldstatus $88,000
-
1996-11-01soldstatus $72,500
-
1994-05-01soldstatus $68,500
ⓘ Source: listings_history table (triggers on properties + properties_extension) + one-shot
backfill from property_details.listing_events for pre-trigger history.
Climate risk First Street
- Flood 1/10 Low FEMA zone X (unshaded) · 0% chance over 30 yrs
- Wildfire 4/10 Moderate
- Heat 7/10 Severe 7 d/yr ≥110°F today · 20 d/yr by 30 yrs out
- Wind 2/10 Low 2% chance of damaging wind over 30 yrs
- Air quality 2/10 Low 1 unhealthy d/yr today · 1 by 30 yrs out
Nearby sold comps map
Loading sold comps map…
Walkable amenities ~0.75 mi
Loading nearby amenities…
Taxation est. · year 1
- Rental income
- $19,626
- − Mortgage interest
- −$10,363
- − Property taxes
- −$2,775
- − Insurance
- −$925
- − Repairs & maintenance
- −$1,570
- − Management
- −$1,570
- − Depreciation
- −$5,382
- Taxable loss
- −$2,959
- Est. tax savings @ 24.0%
- +$710
- After-tax cash flow
- $872/yr
For passive investors: Depreciation is non-cash, so a rental often shows a tax loss while cash-flowing — sheltering income. Rental losses are passive: they offset passive income freely, and up to $25,000/yr can offset ordinary (W-2) income if you actively participate and your MAGI is under $100k (phasing out to $0 by $150k); unused losses carry forward. On sale, claimed depreciation is recaptured at up to 25%, and gains may owe capital-gains tax (a 1031 exchange can defer both). Figures are a year-1 estimate at your 24.0% rate — not tax advice; consult a CPA.
Schools (NCES district)
- District
- Claremore
- NCES district ID
- 4007740
- Math proficiency
- 24% ▼ -12.00%
- Reading proficiency
- 25% ▼ -11.00%
- Median HH income
- $44,946
- Composite
- 21.16/100
- National rank
- #8426
- State rank
- #111 of 270 in OK
Livability — Claremore
- Score
- 73/100
- State rank
- #20
- US rank
- #5616
Category grades
Schools grade is shown separately in the Schools card above.
Census & demographics
- Census place
- Claremore, OK
- County
- Rogers County · 50,229 people
- City population
- 50,229
- Metro
- Tulsa, OK
- Population (ZIP)
- 21,023
- Household income
- $84,342
- Rent vs Own
- Severe rent burden
- 150.0
Population outlook (Rogers County) Hauer SSP2
- Today (2025)
- 100,211 people
- By 2030
- 104,381 · +4.2%
- By 2040
- 111,567 · +11.3%
- By 2050
- 116,791 · +16.5%
- By 2075
- 129,134 · +28.9%
- By 2100
- 132,326 · +32.0%
Race, ethnicity, and origin ACS 2023
- Neighborhood character
- Predominantly White (70%)
- Race & ethnicity
- White 70% Native American 13% Two or more races 11% Hispanic / Latino 6% Asian 1%
- Hispanic origin (detail)
- Mexican 5%
- Common ancestry
- Lithuanian 2% Romanian 2% Slovak 2%
- Foreign-born
- 3% · Canada, Vietnam
- Languages at home
- 95% English-only · Spanish 3% Other Asian/Pacific 1%
Political lean MEDSL · Rogers
- 2024 margin
- Solid R (+55.0) · D 21.6% · R 76.6% · Other 1.7%
- 2008→2024 swing
- -10.9pp toward R · 2008: -44.1pp · 2024: -55.0pp
- All cycles
- 2024: R+55.0 2020: R+54.9 2016: R+56.3 2012: R+50.1 2008: R+44.1
Not yet ingested
- Civics
- —
Market trends
- HPI YoY
- ▼ -32.22%
- Current HPI
- 210.9691
- Rent YoY
- —
- Metro
- Tulsa, OK
- State GDP YoY
- ▲ 1.55%
- F500 in state
- 6
Industry mix (Fortune 500 HQ in OK)
| Industry | F500 HQs | Revenue |
|---|---|---|
| Energy | 3 | $48B |
|
||
Price history
+177.4% since first listed10 events — show timeline
- 2026-05-14 Relisted — MLS Technology, Inc.
- 2026-04-16 Listing Removed — MLS Technology, Inc.
- 2026-04-14 Listed $189,999 MLS Technology, Inc.
- 2013-07-08 Sold (Public Records) $115,000 Public Records
- 2013-06-24 Sold (MLS) $115,000 MLS Technology, Inc.
- 2013-06-03 Listing Removed — MLS Technology, Inc.
- 2013-05-17 Listed $115,000 MLS Technology, Inc.
- 2000-07-01 Sold (Public Records) $88,000 Public Records
- 1996-11-01 Sold (Public Records) $72,500 Public Records
- 1994-05-01 Sold (Public Records) $68,500 Public Records
Property tax history
-32.3%/yrLatest (2018): $230 · -78.9% YoY. Source: county tax records.
Cash-flow waterfall
monthlySold comps — $/sqft
last 12 mo · ≤1 miLoading sold comps…