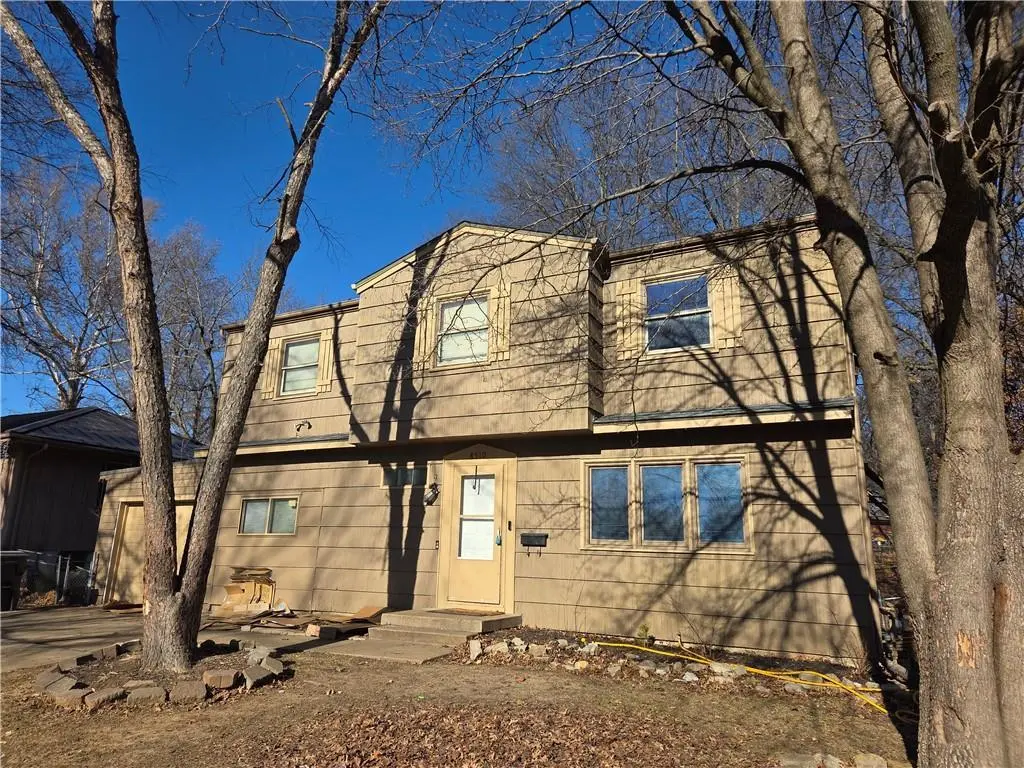
8510 E 110th Ter · Kansas City, MO
Flood risk 1/10 · Minimal
- FEMA flood zone
- X (unshaded)
- Chance of flooding over 30 yrs
- 0.0%
- Est. flood insurance / yr
- $473 – $860
Fire risk 1/10 · Minimal
- Est. fire insurance / yr
- $1,054 – $1,958
Heat risk 4/10 · Minor
- Hot days now (above 107°F)
- 7 days/yr
- Hot days in 30 yrs
- 17 days/yr
Wind risk 2/10 · Minimal
- Chance of severe wind over 30 yrs
- —
Air-quality risk 3/10 · Minor
- Unhealthy air days now
- 3 days/yr
- Unhealthy air days in 30 yrs
- 3 days/yr
Risk factors via First Street. Map © Google.
Why this score? — see what drove the B- grade
The composite is a weighted blend of 9 inputs, each scored 0–100. Each bar is that input's sub-score; the figure is the points it added to the 100-point composite (weight × sub-score).
- Cash flow +25.2/30.0
- ARV discount +15.0/15.0
- DSCR +8.3/10.0
- 1% rule +6.5/10.0
- Rent growth +4.2/5.0
- Livability +3.9/5.0
- Condition / age +2.5/5.0
- Schools +1.1/10.0
- Appreciation +0.0/10.0
$150,000
🖨 Deal sheet 📄 Offer letter ✓ Due diligence
Listing remarks MLS
2 story home. This home features hardwood floors throughout main living area and bedrooms. There is a Wood stove in the bonus family room. Large bedrooms with the primary having a separate sitting area. Huge fenced in shaded backyard for those summer cookouts! Abundance of storage space in the basement! This is a good opportunity for an investor
Key facts
- Wood stove
- Abundance of storage
- Fenced backyard
Tags
Neighborhood map
What this means for you Summary
Snapshot
- This is a 3-bed/1.5-bath single-family listed at $150k.
Deal economics
- At list price, monthly cash flow is $336 ($4k/yr) — positive.
- The deal already cash-flows at list — no discount required.
- Meets the 1% rule at list price ($2k rent vs $150k).
- Cap rate 9.0% vs local median 3.9% in Kansas City — top-decile yield for the area; either an underpriced asset or a hidden risk that comps aren't pricing in. Stress-test before assuming the spread holds.
Location & tenants
- Location reads 78/100 on livability (#28 in MO, #2,671 nationally) — a middle-class / working-renter tenant base. Strengths: amenities A+, commute A+, cost of living A+; Watch: schools C-, crime F.
- Hickman Mills C-1 (urban): math 8% / reading 18% proficiency, ranked #314 of 324 in MO (top 97%) — low school quality limits family demand, transient renter base, plan for 1-2y turnover; 78% free/reduced lunch — lower-income household profile, screen leases tightly.
- Market conditions: Rents rising fast (+6.7%/yr); 143 active listings in the ZIP; 6 comparable units currently listed for rent nearby; rentals lingering (median 44d on market — plan ~5-8 weeks vacancy on turnover, expect pricing pressure); 50% of comp listings sitting > 30 days — soft ceiling on asking rent; 4,002 units permitted in Jackson County in 2024 (2,271 in 5+ unit buildings).
- This rent runs 36% of the median local income ($58k/yr) — at the standard rent-burdened threshold; future hikes will face affordability resistance.
Forward outlook
- Local home prices are declining (-3.0%/yr); year-one equity from $1k of loan paydown is wiped out by about $4k of value loss. Plan a longer hold.
- Jackson County population projected at +4% by 2050 — modest demand growth; plan on rents tracking national, not racing it.
- At projected returns (-3.0% appreciation + 6.7% rent growth), your $42k cash investment doubles in ~8 years — after that, you're playing with house money.
Negotiation context
- Only 10 days on market — expect competitive offers; lowballing is unlikely to land.
- 4 sale attempts since 26y ago; this cycle's ask has dropped $25k (14%) from the opening price — seller is motivated, your offer sets the floor, not the list.
Questions for the listing agent
- Built in 1965 — when were the roof, HVAC, electrical panel, plumbing, and water heater last replaced?
- Is there a deadline driving the sale (1031 exchange, divorce, estate, relocation)? That informs how much negotiation room exists.
- Crime grade is F in this area — have there been break-ins, vandalism, or insurance claims at this property in the last 3 years? What carrier currently insures it and at what premium?
- What's the average days-on-market for RENTAL listings here right now (not sales)? A rising rental-DOM trend means longer vacancies and softer asking-rent achievability than the comps imply.
- What's the recent tenant-quality profile in this submarket — average credit score on applications, eviction rate, late-payment / NSF rate, and stable-employment percentage? A property-management company in the area should have these aggregated.
- How much new for-sale + rental construction is in the pipeline within 1–3 miles? Heavy new supply typically softens prices + rents 12–24 months out; constrained supply supports both.
Investment metrics
- 1% rule
- 1.15% ✓
- Cap rate
- 8.98%
- Cash-on-cash
- 9.59%
- DSCR
- 1.43
- GRM
- 7.2
CMA / ARV
- ARV (median comp)
- $207,102
- List price
- $150,000
- Delta
- -15.50%
- Verdict
- UNDERPRICED
- Comps
- 20 within 1.0 mi
Show comp detail 12 sales within ~0.75 mi
| Address | Dist | Beds/Ba | Sqft | Sold | Price | $/sf | Match |
|---|---|---|---|---|---|---|---|
| 11405 Greenwood Rd | 0.47mi | 3/2.0 | 2,016 (-2%) | 6mo | $195,500 | $97 | 67 |
| 8701 E 109th Ter | 0.22mi | 3/3.0 | 1,881 (-9%) | 5mo | $208,000 | $111 | 65 |
| 8800 E 111th St | 0.16mi | 3/2.0 | 1,824 (-12%) | 9mo | $105,000 | $58 | 63 |
| 8659 E 109th St | 0.25mi | 4/2.0 (+1) | 1,957 (-5%) | 14mo | $224,950 | $115 | 61 |
| 7716 E 112th Ter | 0.39mi | 4/2.0 (+1) | 1,896 (-8%) | 3mo | $209,000 | $110 | 58 |
| 11300 Greenwood Rd | 0.30mi | 3/2.0 | 1,796 (-13%) | 12mo | $199,900 | $111 | 52 |
| 7304 E 109th Ter | 0.70mi | 3/2.0 | 1,922 (-7%) | 3mo | $230,000 | $120 | 51 |
| 11149 Spring Valley Rd | 0.33mi | 3/1.0 | 2,346 (+13%) | 12mo | $205,000 | $87 | 50 |
| 8816 E 110th St | 0.29mi | 4/3.5 (+1) | 2,356 (+14%) | 0mo | $280,000 | $119 | 50 |
| 7600 E 107th St | 0.74mi | 4/2.0 (+1) | 2,044 (-1%) | 9mo | $107,000 | $52 | 49 |
| 11608 Greenwood Rd | 0.75mi | 3/2.0 | 1,850 (-10%) | 2mo | $229,000 | $124 | 44 |
| 8609 E 116th St | 0.70mi | 2/2.0 (-1) | 2,248 (+9%) | 3mo | $245,000 | $109 | 44 |
Match score weights: distance 35% · size 25% · config 20% · recency 20%. Top-matched comps best support the ARV.
Projected returns pro-forma
-3.0% appreciation · 6.73% rent growth · sell at horizon
- IRR
- 2.3%
- Equity multiple
- 1.09×
- Total profit
- $3,807
- Equity at exit
- $22,365
- IRR
- 15.2%
- Equity multiple
- 2.45×
- Total profit
- $60,702
- Equity at exit
- $12,969
Cash invested: $42,000 (down + closing). Projections, not guarantees.
Landlord ↔ Tenant lean methodology
- Overall (STATE)
- 81 Strongly Landlord-Friendly
- State Missouri
- 81 Strongly Landlord-Friendly · R+10
- County
- — inherits STATE
- City
- — inherits STATE
ZIP-level market 64134
- Rents YoY
- 6.7%
- Active inventory
- 143
- Price-to-rent
- 7.2×
Monthly cashflow live
- Estimated rent
- $1,726 high interval (Pro) →
- Mortgage (P&I)
- −$787
- Tax from tax record
- −$179 /mo · $2,148/yr
- Insurance
- −$62
- HOA
- −$0
- Vacancy / Maint / Mgmt
- −$362
- Net cashflow
- $336
Break-even live
UW: 25.0% down · 7.5% · 30yr · 1.5% tax · 5.0% vac · 8.0% maint · 8.0% mgmt
Financing live
Cash to close
- Down payment
- $37,500
- Closing costs
- $4,500
- Reserves months
- —
- Total cash needed
- —
Loan-product check · same deal, 3 products live
Conventional
25% down · 7.5% · 30yr
- Down + closing
- —
- Monthly P&I
- —
- Monthly cashflow
- —
- DSCR
- —
- Eligible?
- —
Personal DTI + credit; lowest rate.
DSCR
20% down · 8.5% · 30yr
- Down + closing
- —
- Monthly P&I
- —
- Monthly cashflow
- —
- DSCR
- —
- Eligible?
- —
No personal income docs; deal must DSCR.
Hard money
10% down · 12.0% · 12mo
- Down + closing
- —
- Monthly P&I
- —
- Monthly cashflow
- —
- DSCR
- —
- Eligible?
- —
Short-term bridge; refi at stabilization.
Rent comps 6 comps
| Address | Beds | Baths | Sqft | Rent | $/sqft | DOM | Units | Dist |
|---|---|---|---|---|---|---|---|---|
| 10408 Smalley Ct Kansas City, MO | 3.0 | 1.5 | 1500 | $1,599 | $1.07 | 23d | 1 | 0.95mi |
| 11009 Ewing Ave Kansas City, MO | 4.0 | 1.0 | 1416 | $1,595 | $1.13 | 43d | 1 | 1.06mi |
| 11923 Manchester Ave Grandview, MO | 3.0 | 2.0 | 1407 | $1,815 | $1.29 | 43d | 1 | 1.25mi |
| 11934 Sycamore Ave Grandview, MO | 3.0 | 2.0 | 1414 | $1,806 | $1.28 | 43d | 1 | 1.29mi |
| 6201 E Red Bridge Rd Kansas City, MO | 3.0 | 2.0 | 1592 | $1,645 | $1.03 | 16d | 1 | 1.40mi |
| 11720 Newton Ave Kansas City, MO | 2.0–3.0 | 1.5–3.0 | 1293 | $1,699 | $1.31 | 1d | 9 | 1.47mi |
Listing history 24 events
-
2026-06-18days on market $150,000 Active 10 DOM
-
2026-06-17days on market $150,000 Active 9 DOM
-
2026-06-16days on market $150,000 Active 8 DOM
-
2026-06-15days on market $150,000 Active 7 DOM
-
2026-06-13days on market $150,000 Active 5 DOM
-
2026-06-13days on market $150,000 Active 4 DOM
-
2026-06-09pricedays on market $150,000 Active 1 DOM
-
2026-05-31days on market $175,000 Active 136 DOM
-
2026-01-16$175,000 Active 350-char remark
Show marketing remark (350 chars)
2 story home. This home features hardwood floors throughout main living area and bedrooms. There is a Wood stove in the bonus family room. Large bedrooms with the primary having a separate sitting area. Huge fenced in shaded backyard for those summer cookouts! Abundance of storage space in the basement! This is a good opportunity for an investor
-
2026-01-15historical $175,000 350-char remark
Show marketing remark (350 chars)
2 story home. This home features hardwood floors throughout main living area and bedrooms. There is a Wood stove in the bonus family room. Large bedrooms with the primary having a separate sitting area. Huge fenced in shaded backyard for those summer cookouts! Abundance of storage space in the basement! This is a good opportunity for an investor
-
2022-09-01soldstatus Closed 425-char remark
Show marketing remark (425 chars)
Rare 2 story home at this price!!! This home features hardwood floors throughout main living area and bedrooms. You will not want to miss this kitchen with stainless appliances, tile back-splash and dining area. There is a Wood stove in the bonus family room. Large bedrooms with the primary having a separate sitting area. Huge fenced in shaded backyard for those summer cookouts! Abundance of storage space in the basement!
-
2022-09-01soldstatus
Show marketing remark (425 chars)
Rare 2 story home at this price!!! This home features hardwood floors throughout main living area and bedrooms. You will not want to miss this kitchen with stainless appliances, tile back-splash and dining area. There is a Wood stove in the bonus family room. Large bedrooms with the primary having a separate sitting area. Huge fenced in shaded backyard for those summer cookouts! Abundance of storage space in the basement!
-
2022-08-07historical Active Under Contract 425-char remark
Show marketing remark (425 chars)
Rare 2 story home at this price!!! This home features hardwood floors throughout main living area and bedrooms. You will not want to miss this kitchen with stainless appliances, tile back-splash and dining area. There is a Wood stove in the bonus family room. Large bedrooms with the primary having a separate sitting area. Huge fenced in shaded backyard for those summer cookouts! Abundance of storage space in the basement!
-
2022-08-05$150,000 Active 425-char remark
Show marketing remark (425 chars)
Rare 2 story home at this price!!! This home features hardwood floors throughout main living area and bedrooms. You will not want to miss this kitchen with stainless appliances, tile back-splash and dining area. There is a Wood stove in the bonus family room. Large bedrooms with the primary having a separate sitting area. Huge fenced in shaded backyard for those summer cookouts! Abundance of storage space in the basement!
-
2018-04-18soldstatus
-
2018-04-06soldstatus Sold
-
2018-03-14status Pending
-
2018-02-15price $89,900
-
2018-01-26price $94,900
-
2018-01-11$99,900 Active
-
2014-11-13soldstatus
-
2000-07-21soldstatus
-
2000-06-15$53,000
-
1996-09-13soldstatus
ⓘ Source: listings_history table (triggers on properties + properties_extension) + one-shot
backfill from property_details.listing_events for pre-trigger history.
Tax reassessment forecast MO · Resets to sale price
- Current annual tax
- $2,148 · $179/mo
- Projected year-2 tax
- $2,148 · $179/mo
- Expected delta
- $0/yr ($0/mo · 0.0%)
ⓘ Screening estimate from a state-policy table — verify with the county assessor before closing.
Climate risk First Street
- Flood 1/10 Low FEMA zone X (unshaded) · 0% chance over 30 yrs
- Wildfire 1/10 Low
- Heat 4/10 Moderate 7 d/yr ≥107°F today · 17 d/yr by 30 yrs out
- Wind 2/10 Low
- Air quality 3/10 Moderate 3 unhealthy d/yr today · 3 by 30 yrs out
Nearby sold comps map
Loading sold comps map…
Walkable amenities ~0.75 mi
Loading nearby amenities…
Taxation est. · year 1
- Rental income
- $20,714
- − Mortgage interest
- −$8,402
- − Property taxes
- −$2,148
- − Insurance
- −$750
- − Repairs & maintenance
- −$1,657
- − Management
- −$1,657
- − Depreciation
- −$4,364
- Taxable income
- $1,736
- Est. tax owed @ 24.0%
- −$417
- After-tax cash flow
- $3,610/yr
For passive investors: Depreciation is non-cash, so a rental often shows a tax loss while cash-flowing — sheltering income. Rental losses are passive: they offset passive income freely, and up to $25,000/yr can offset ordinary (W-2) income if you actively participate and your MAGI is under $100k (phasing out to $0 by $150k); unused losses carry forward. On sale, claimed depreciation is recaptured at up to 25%, and gains may owe capital-gains tax (a 1031 exchange can defer both). Figures are a year-1 estimate at your 24.0% rate — not tax advice; consult a CPA.
Schools (NCES district)
- District
- Hickman Mills C-1
- NCES district ID
- 2914340
- Math proficiency
- 8% ▼ -8.00%
- Reading proficiency
- 18% ▼ -4.00%
- Median HH income
- $40,908
- Composite
- 11.2/100
- National rank
- #9725
- State rank
- #314 of 324 in MO
Livability — Kansas City
- Score
- 78/100
- State rank
- #28
- US rank
- #2671
Category grades
Schools grade is shown separately in the Schools card above.
Census & demographics
- Census place
- Kansas City, MO
- County
- Jackson County · 687,798 people
- City population
- 439,467
- Metro
- Kansas City, MO-KS
- Population (ZIP)
- 22,964
- Household income
- $58,170
- Rent vs Own
- Severe rent burden
- 718.0
Population outlook (Jackson County) Hauer SSP2
- Today (2025)
- 719,589 people
- By 2030
- 731,456 · +1.6%
- By 2040
- 746,689 · +3.8%
- By 2050
- 749,289 · +4.1%
- By 2075
- 736,227 · +2.3%
- By 2100
- 668,210 · -7.1%
Race, ethnicity, and origin ACS 2023
- Neighborhood character
- Diverse neighborhood (Simpson 0.58)
- Race & ethnicity
- Black 58% White 28% Hispanic / Latino 10% Two or more races 6%
- Hispanic origin (detail)
- Mexican 6%
- Common ancestry
- Italian 2% Lithuanian 1% Romanian 1%
- Foreign-born
- 4% · Canada
- Languages at home
- 93% English-only · Spanish 5% Arabic 1%
Political lean MEDSL · Jackson
- 2024 margin
- D (+19.3) · D 58.9% · R 39.5% · Other 1.6%
- 2008→2024 swing
- -6.1pp toward R · 2008: 25.4pp · 2024: 19.3pp
- All cycles
- 2024: D+19.3 2020: D+22.0 2016: D+16.6 2012: D+19.0 2008: D+25.4
Not yet ingested
- Civics
- —
Market trends
- HPI YoY
- ▼ -157.94%
- Current HPI
- 277.895
- Rent YoY
- ▲ 6.73%
- Metro
- Kansas City, MO-KS
- State GDP YoY
- ▲ 1.84%
- F500 in state
- 20
Industry mix (Fortune 500 HQ in MO)
| Industry | F500 HQs | Revenue |
|---|---|---|
| Healthcare | 1 | $163B |
|
||
| Insurance | 1 | $21B |
|
||
| Industrial Technology | 1 | $17B |
|
||
| Retail | 1 | $16B |
|
||
| Industrial Distribution | 1 | $10B |
|
||
| Utilities | 1 | $9B |
|
||
Price history
+230.2% since first listed16 events — show timeline
- 2026-01-16 Listed $175,000 Heartland MLS as Distributed by MLS Grid
- 2026-01-15 Coming Soon $175,000 Heartland MLS as Distributed by MLS Grid
- 2022-09-01 Sold (Public Records) — Public Records
- 2022-09-01 Sold (MLS) — Heartland MLS as Distributed by MLS Grid
- 2022-08-07 Contingent — Heartland MLS as Distributed by MLS Grid
- 2022-08-05 Listed $150,000 Heartland MLS as Distributed by MLS Grid
- 2018-04-18 Sold (Public Records) — Public Records
- 2018-04-06 Sold (MLS) — Heartland MLS as Distributed by MLS Grid
- 2018-03-14 Pending — Heartland MLS as Distributed by MLS Grid
- 2018-02-15 Price Changed $89,900 Heartland MLS as Distributed by MLS Grid
- 2018-01-26 Price Changed $94,900 Heartland MLS as Distributed by MLS Grid
- 2018-01-11 Listed $99,900 Heartland MLS as Distributed by MLS Grid
- 2014-11-13 Sold (Public Records) — Public Records
- 2000-07-21 Sold (MLS) — Heartland MLS as Distributed by MLS Grid
- 2000-06-15 Listed $53,000 Heartland MLS as Distributed by MLS Grid
- 1996-09-13 Sold (Public Records) — Public Records
Property tax history
+9.8%/yrLatest (2025): $2,148 · -7.8% YoY. Source: county tax records.
Cash-flow waterfall
monthlySold comps — $/sqft
last 12 mo · ≤1 miLoading sold comps…