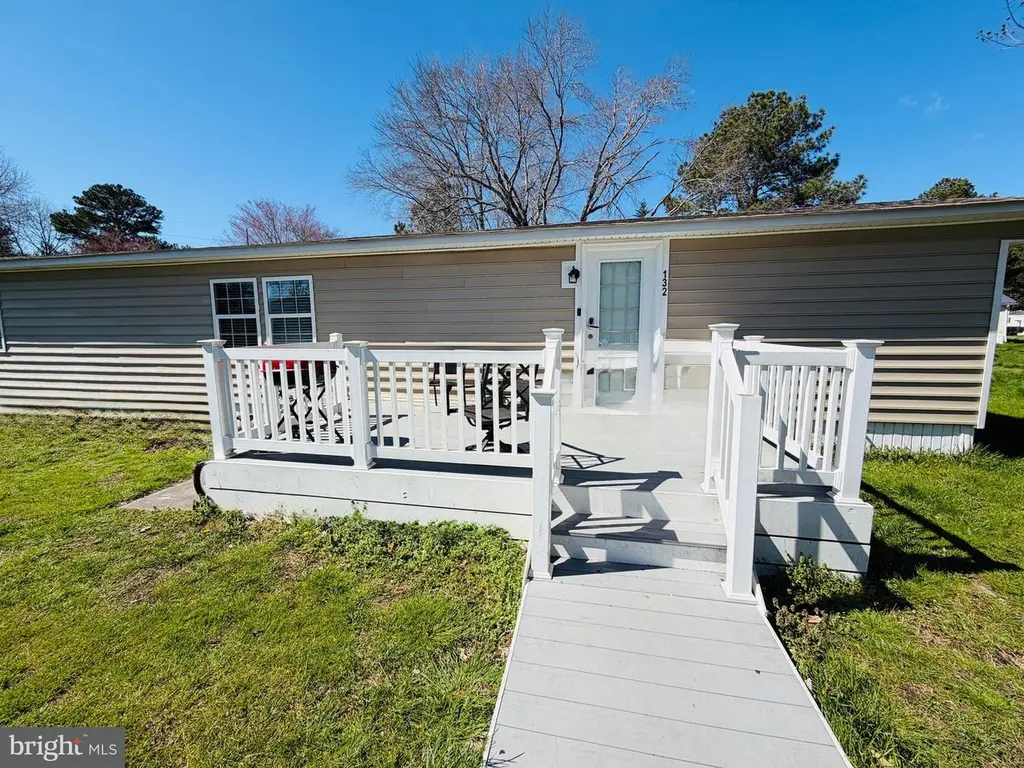
132 Liberty Way · Fruitland, MD
Flood risk 3/10 · Minor
- FEMA flood zone
- X (unshaded)
- Chance of flooding over 30 yrs
- 0.2%
- Est. flood insurance / yr
- $507 – $1,088
Fire risk 3/10 · Minor
- Est. fire insurance / yr
- $755 – $1,403
Heat risk 8/10 · Major
- Hot days now (above 105°F)
- 7 days/yr
- Hot days in 30 yrs
- 16 days/yr
Wind risk 7/10 · Major
- Chance of severe wind over 30 yrs
- 78.0%
Air-quality risk 2/10 · Minimal
- Unhealthy air days now
- 2 days/yr
- Unhealthy air days in 30 yrs
- 2 days/yr
Risk factors via First Street. Map © Google.
Why this score? — see what drove the B+ grade
The composite is a weighted blend of 9 inputs, each scored 0–100. Each bar is that input's sub-score; the figure is the points it added to the 100-point composite (weight × sub-score).
- Cash flow +30.0/30.0
- ARV discount +15.0/15.0
- 1% rule +10.0/10.0
- DSCR +10.0/10.0
- Condition / age +3.8/5.0
- Livability +3.5/5.0
- Rent growth +2.5/5.0
- Schools +1.9/10.0
- Appreciation +0.0/10.0
$75,000
🖨 Deal sheet (PDF) 📄 Offer letter ✓ Due diligence
Listing remarks
This super cute 2 bedroom, 2 bath single wide trailer has been Stylishly Updated from top to bottom ! New stainless steel appliances, New Cupboards, New backsplash, New LVP flooring, New lighting, New ductless mini-splits, New Bathrooms and Roof ! Now it is just waiting it's New Owners. Enjoy the spacious yard and convenience to nearby shopping, schools and so much more. This unit is in a park and has lot rent.
Key facts
- 3,049 sq ft lot
- 2 parking spots
- Built 1985
Property features AI
Finance
- Other: Ownership is subject to ground rent; Pets allowed on a case-by-case basis; Directions: From Rt 13 turn on to Division, turn right onto Liberty Way; In city limits
- Financial info: Ground rent applies: $410 per month (ground rent exists)
- HOA & community: Property manager present; Park name: Southgate
Exterior
- Parking: Driveway parking (2 spaces); Total of 2 garage/parking spaces
- Utilities: Public water; Public sewer; Electric service for heating, cooling and hot water
- Home design: Manufactured home; Single-wide mobile home; Estimated year of major renovation: 2024
- Construction: Above-grade structure; Year built source: Estimated
- Exterior features: Front yard; Rear yard; Not in a federal flood zone
Interior
- Kitchen: Dishwasher; Microwave; Electric range/oven; Refrigerator; Stainless steel appliances
- Bedrooms: 2 bedrooms on the main level
- Flooring: Luxury vinyl plank
- Bathrooms: 2 full bathrooms (both on the main level)
- Heating & cooling: Forced air heat (electric); Ductless / mini-split cooling (electric); Electric hot water
- Interior features: Open floor plan; Combination kitchen/dining area; Eat-in kitchen; Breakfast area; Ceiling fans; Stall shower; Other interior features
- Laundry & utility: Washer; Electric dryer; Main-floor laundry
Neighborhood map
What this means for you Summary
Snapshot
- This is a 2-bed/2.0-bath single-family listed at $75k. Condition is rated good.
Deal economics
- At list price, monthly cash flow is $760 ($9k/yr) — positive.
- The deal already cash-flows at list — no discount required.
- Meets the 1% rule at list price ($2k rent vs $75k).
- Recommended offer: $73k (3.0% below list) — sets the bar for market timing.
- Cap rate 18.4% vs local median 3.8% in Fruitland — top-decile yield for the area; either an underpriced asset or a hidden risk that comps aren't pricing in. Stress-test before assuming the spread holds.
Location & tenants
- Location reads 70/100 on livability (#179 in MD) — a middle-class / working-renter tenant base. Strengths: cost of living A, housing A, health & safety A; Watch: amenities F, commute F, employment D-.
- Wicomico County Public Schools (urban): math 16% / reading 26% proficiency, ranked #19 of 24 in MD (top 79%) — low school quality limits family demand, transient renter base, plan for 1-2y turnover.
- Zoned schools: Fruitland Primary (475 students, 51% FRL); Bennett Middle (math 13% / reading 29%, grade F, #134 of 225 statewide, top 62%, 906 students, 48% FRL); James M. Bennett High (math 55% / reading 66%, grade C+, #71 of 222 statewide, top 32%, 1,343 students, 44% FRL).
- Zoned-school proficiency averages 41% at this address vs 21% district-wide (+20 pts) — the actual schools serving this property are materially stronger than the Wicomico County Public Schools average implies; a family-tenant draw the district grade alone would hide.
- Market conditions: 43 active listings in the ZIP; 2 comparable units currently listed for rent nearby; 278 units permitted in Wicomico County in 2024 (44 in 5+ unit buildings).
Forward outlook
- Local home prices are declining (-3.0%/yr); year-one equity from $519 of loan paydown is wiped out by about $2k of value loss. Plan a longer hold.
- Wicomico County population projected at +14% by 2050 — modest demand growth; plan on rents tracking national, not racing it.
- At projected returns (-3.0% appreciation + 3.0% rent growth), your $21k cash investment doubles in ~3 years — after that, you're playing with house money.
Negotiation context
- It's been on market 59 days — a 3% lower offer ($73k) is reasonable based on typical stale-listing flexibility.
Risks & watch-outs
- Climate carrying-cost: major wind risk, 78% chance of damaging wind over 30y; extreme-heat days projected 7→16/yr by 2055 (HVAC capex compounding) — expect insurance premiums to compound above CPI over the hold.
Questions for the listing agent
- It's been on market 59 days. Have you received any prior offers? Is the seller open to a 3% concession, seller financing, or rate buy-down credit?
- Is there a deadline driving the sale (1031 exchange, divorce, estate, relocation)? That informs how much negotiation room exists.
- Schools are D-rated, which usually means shorter tenancies and higher turnover. Who's the typical renter profile here, and what's been the actual vacancy rate?
- What's the average days-on-market for RENTAL listings here right now (not sales)? A rising rental-DOM trend means longer vacancies and softer asking-rent achievability than the comps imply.
- What's the recent tenant-quality profile in this submarket — average credit score on applications, eviction rate, late-payment / NSF rate, and stable-employment percentage? A property-management company in the area should have these aggregated.
- How much new for-sale + rental construction is in the pipeline within 1–3 miles? Heavy new supply typically softens prices + rents 12–24 months out; constrained supply supports both.
Investment metrics
- 1% rule
- 2.16% ✓
- Cap rate
- 18.45%
- Cash-on-cash
- 43.41%
- DSCR
- 2.93
- GRM
- 3.9
CMA / ARV
- ARV (median comp)
- $135,843
- List price
- $75,000
- Delta
- -44.79%
- Verdict
- UNDERPRICED
- Comps
- 20 within 1.0 mi
Show comp detail 12 sales within ~0.75 mi
| Address | Dist | Beds/Ba | Sqft | Sold | Price | $/sf | Match |
|---|---|---|---|---|---|---|---|
| 220 Sand Castle Blvd | 0.08mi | 2/2.0 | 929 (-3%) | 3mo | $40,000 | $43 | 89 |
| 229 Sand Castle Blvd | 0.08mi | 3/2.0 (+1) | 938 (-2%) | 5mo | $44,900 | $48 | 84 |
| 410 Tiffany Dr | 0.06mi | 3/2.0 (+1) | 938 (-2%) | 9mo | $55,000 | $59 | 81 |
| 409 Tiffany Dr | 0.06mi | 3/2.0 (+1) | 984 (+2%) | 9mo | $70,000 | $71 | 81 |
| 243 Sand Castle Blvd | 0.11mi | 2/2.0 | 1,008 (+5%) | 9mo | $80,000 | $79 | 79 |
| 613 S Camden Ave | 0.37mi | 3/2.0 (+1) | 1,056 (+10%) | 4mo | $239,900 | $227 | 58 |
| 214 N Dulany Ave | 0.69mi | 2/1.0 | 978 (+2%) | 7mo | $115,000 | $118 | 55 |
| 110 Staton St | 0.43mi | 2/1.0 | 1,017 (+6%) | 14mo | $93,500 | $92 | 54 |
| 115 Walden Dr | 0.66mi | 3/1.0 (+1) | 1,008 (+5%) | 8mo | $160,000 | $159 | 45 |
| 212 Hayward Ave | 0.72mi | 3/1.0 (+1) | 1,056 (+10%) | 0mo | $112,500 | $107 | 41 |
| 209 W Main St | 0.63mi | 3/1.5 (+1) | 1,092 (+14%) | 6mo | $220,000 | $201 | 36 |
| 207 Walden Dr | 0.59mi | 3/2.0 (+1) | 1,100 (+15%) | 16mo | $210,000 | $191 | 30 |
Match score weights: distance 35% · size 25% · config 20% · recency 20%. Top-matched comps best support the ARV.
Projected returns pro-forma
-3.0% appreciation · 3.0% rent growth · sell at horizon
- IRR
- 40.3%
- Equity multiple
- 2.73×
- Total profit
- $36,260
- Equity at exit
- $11,183
- IRR
- 46.6%
- Equity multiple
- 5.48×
- Total profit
- $93,983
- Equity at exit
- $6,485
Cash invested: $21,000 (down + closing). Projections, not guarantees.
Landlord ↔ Tenant lean methodology
- Overall (STATE)
- 27 Tenant-Leaning
- State Maryland
- 27 Tenant-Leaning · D+14
- County
- — inherits STATE
- City
- — inherits STATE
ZIP-level market 21826
- Home prices YoY
- -7.6%
- Active inventory
- 43
- Price-to-rent
- 3.9×
Monthly cashflow live
- Estimated rent
- $1,618 medium interval (Pro) →
- Mortgage (P&I)
- −$393
- Tax est. 1.5%
- −$94 /mo · $1,125/yr
- Insurance
- −$31
- HOA
- −$0
- Vacancy / Maint / Mgmt
- −$340
- Net cashflow
- $760
Break-even live
Sensitivity live
| Price | -10% $812 | -5% $786 | +0% $760 | +5% $734 | +10% $708 |
|---|---|---|---|---|---|
| Rent | -10% $632 | -5% $696 | +0% $760 | +5% $824 | +10% $888 |
| Rate | -1.0pp $798 | -0.5pp $779 | base $760 | +0.5pp $740 | +1.0pp $721 |
UW: 25.0% down · 7.5% · 30yr · 1.5% tax · 5.0% vac · 8.0% maint · 8.0% mgmt
Financing live
Cash to close
- Down payment
- $18,750
- Closing costs
- $2,250
- Reserves months
- —
- Total cash needed
- —
Loan-product check · same deal, 3 products live
Conventional
25% down · 7.5% · 30yr
- Down + closing
- —
- Monthly P&I
- —
- Monthly cashflow
- —
- DSCR
- —
- Eligible?
- —
Personal DTI + credit; lowest rate.
DSCR
20% down · 8.5% · 30yr
- Down + closing
- —
- Monthly P&I
- —
- Monthly cashflow
- —
- DSCR
- —
- Eligible?
- —
No personal income docs; deal must DSCR.
Hard money
10% down · 12.0% · 12mo
- Down + closing
- —
- Monthly P&I
- —
- Monthly cashflow
- —
- DSCR
- —
- Eligible?
- —
Short-term bridge; refi at stabilization.
Rent comps 2 comps
| Address | Beds | Baths | Sqft | Rent | $/sqft | DOM | Units | Dist |
|---|---|---|---|---|---|---|---|---|
| 413A Ogle Ave Fruitland, MD | 3.0 | 1.0 | 864 | $1,700 | $1.97 | 23d | 1 | 0.50mi |
| 508 Hayward Ave Fruitland, MD | 2.0 | 1.0 | 992 | $1,450 | $1.46 | 45d | 1 | 0.94mi |
Listing history 18 events
-
2026-06-21days on market $75,000 Active 59 DOM
-
2026-06-18days on market $75,000 Active 56 DOM
-
2026-06-17days on market $75,000 Active 55 DOM
-
2026-06-16days on market $75,000 Active 54 DOM
-
2026-06-15days on market $75,000 Active 53 DOM
-
2026-06-14days on market $75,000 Active 51 DOM
-
2026-06-13days on market $75,000 Active 50 DOM
-
2026-06-10days on market $75,000 Active 48 DOM
-
2026-06-09days on market $75,000 Active 47 DOM
-
2026-06-08days on market $75,000 Active 46 DOM
-
2026-06-07days on market $75,000 Active 45 DOM
-
2026-06-03days on market $75,000 Active 41 DOM
-
2026-06-02days on market $75,000 Active 40 DOM
-
2026-06-01days on market $75,000 Active 39 DOM
-
2026-05-31days on market $75,000 Active 38 DOM
-
2026-05-30days on market $75,000 Active 37 DOM
-
2026-04-24$80,000 Active 416-char remark
-
2026-04-21historical $80,000 416-char remark
ⓘ Source: listings_history table (triggers on properties + properties_extension) + one-shot
backfill from property_details.listing_events for pre-trigger history.
Climate risk First Street
- Flood 3/10 Moderate FEMA zone X (unshaded) · 20% chance over 30 yrs
- Wildfire 3/10 Moderate
- Heat 8/10 Severe 7 d/yr ≥105°F today · 16 d/yr by 30 yrs out
- Wind 7/10 Severe 78% chance of damaging wind over 30 yrs
- Air quality 2/10 Low 2 unhealthy d/yr today · 2 by 30 yrs out
Nearby sold comps map
Loading sold comps map…
Walkable amenities ~0.75 mi
Loading nearby amenities…
Taxation est. · year 1
- Rental income
- $19,414
- − Mortgage interest
- −$4,201
- − Property taxes
- −$1,125
- − Insurance
- −$375
- − Repairs & maintenance
- −$1,553
- − Management
- −$1,553
- − Depreciation
- −$2,182
- Taxable income
- $8,424
- Est. tax owed @ 24.0%
- −$2,022
- After-tax cash flow
- $7,095/yr
For passive investors: Depreciation is non-cash, so a rental often shows a tax loss while cash-flowing — sheltering income. Rental losses are passive: they offset passive income freely, and up to $25,000/yr can offset ordinary (W-2) income if you actively participate and your MAGI is under $100k (phasing out to $0 by $150k); unused losses carry forward. On sale, claimed depreciation is recaptured at up to 25%, and gains may owe capital-gains tax (a 1031 exchange can defer both). Figures are a year-1 estimate at your 24.0% rate — not tax advice; consult a CPA.
Condition & rehab AI · 0 photos
This single-family home has been stylishly updated with new appliances, bathrooms, flooring, and HVAC, making it move-in ready and highly marketable.
Value-add opportunities
- Both Landscaping and curb appeal improvements — Enhances the home's aesthetic and appeal
- Both Upgrading the exterior lighting — Improves curb appeal and safety
- Both Adding smart home features — Enhances convenience and marketability
Renovation cost estimate screening
Value-add ROI direction
- Both Landscaping and curb appeal improvements — Enhances the home's aesthetic and appeal ↑
- Both Upgrading the exterior lighting — Improves curb appeal and safety ↑
- Both Adding smart home features — Enhances convenience and marketability ↑
ⓘ Cost ranges are severity-bucket heuristics (US national rule-of-thumb). Get contractor quotes + a written scope before underwriting a rehab budget.
Schools (NCES district)
- District
- Wicomico County Public Schools
- NCES district ID
- 2400690
- Math proficiency
- 16% ▼ -18.00%
- Reading proficiency
- 26% ▼ -13.00%
- Median HH income
- $51,745
- Composite
- 18.87/100
- National rank
- #8860
- State rank
- #19 of 24 in MD
Livability — Fruitland
- Score
- 70/100
- State rank
- #179
- US rank
- #7980
Category grades
Schools grade is shown separately in the Schools card above.
Census & demographics
- Census place
- Fruitland, MD
- County
- Wicomico County · 75,969 people
- City population
- 5,451
- Metro
- Salisbury, MD-DE
- Population (ZIP)
- 5,451
- Household income
- $64,946
- Rent vs Own
- Severe rent burden
- 294.0
Population outlook (Wicomico County) Hauer SSP2
- Today (2025)
- 108,548 people
- By 2030
- 111,783 · +3.0%
- By 2040
- 118,139 · +8.8%
- By 2050
- 123,641 · +13.9%
- By 2075
- 139,784 · +28.8%
- By 2100
- 145,334 · +33.9%
Race, ethnicity, and origin ACS 2023
- Neighborhood character
- Diverse neighborhood (Simpson 0.65)
- Race & ethnicity
- White 51% Black 27% Hispanic / Latino 14% Two or more races 11% Asian 3%
- Hispanic origin (detail)
- Puerto Rican 2% Dominican 3%
- Common ancestry
- Hispanic 2% Romanian 2% Lithuanian 2%
- Foreign-born
- 10% · Canada, China, South Korea
- Languages at home
- 77% English-only · Spanish 14% Other Asian/Pacific 4% Korean 1%
Political lean MEDSL · Wicomico
- 2024 margin
- Lean R (+5.5) · D 46.1% · R 51.5% · Other 2.4%
- 2008→2024 swing
- +0.3pp no change · 2008: -5.8pp · 2024: -5.5pp
- All cycles
- 2024: R+5.5 2020: R+1.9 2016: R+11.6 2012: R+6.9 2008: R+5.8
Not yet ingested
- Civics
- —
Market trends
- HPI YoY
- ▼ -19.52%
- Current HPI
- 236.5727
- Rent YoY
- —
- Metro
- Salisbury, MD-DE
- State GDP YoY
- ▲ 2.97%
- F500 in state
- 12
Industry mix (Fortune 500 HQ in MD)
| Industry | F500 HQs | Revenue |
|---|---|---|
| Aerospace / Defense | 1 | $71B |
|
||
| Utilities | 1 | $25B |
|
||
| Hotels | 1 | $24B |
|
||
| Consumer Goods | 1 | $7B |
|
||
| Real Estate | 1 | $6B |
|
||
| Chemicals | 1 | $2B |
|
||
Price history
-6.2% since first listed4 events — show timeline
- 2026-05-29 Price Changed $75,000 BRIGHT MLS
- 2026-05-24 Price Changed $79,000 BRIGHT MLS
- 2026-04-24 Listed $80,000 BRIGHT MLS
- 2026-04-21 Coming Soon $80,000 BRIGHT MLS
Cash-flow waterfall
monthlySold comps — $/sqft
last 12 mo · ≤1 miLoading sold comps…