 🌊 Lakefront
1213 Camelot Dr · South Fulton, GA
Flood risk 1/10 · Minimal
- FEMA flood zone
- X (unshaded)
- Chance of flooding over 30 yrs
- 0.0%
- Est. flood insurance / yr
- $507 – $1,088
Fire risk 3/10 · Minor
- Est. fire insurance / yr
- $963 – $1,789
Heat risk 6/10 · Moderate
- Hot days now (above 104°F)
- 7 days/yr
- Hot days in 30 yrs
- 18 days/yr
Wind risk 6/10 · Moderate
- Chance of severe wind over 30 yrs
- 27.0%
Air-quality risk 4/10 · Minor
- Unhealthy air days now
- 4 days/yr
- Unhealthy air days in 30 yrs
- 6 days/yr
Risk factors via First Street. Map © Google.
Why this score? — see what drove the B+ grade
The composite is a weighted blend of 9 inputs, each scored 0–100. Each bar is that input's sub-score; the figure is the points it added to the 100-point composite (weight × sub-score).
- Cash flow +30.0/30.0
- 1% rule +10.0/10.0
- DSCR +10.0/10.0
- Appreciation +10.0/10.0
- ARV discount +7.5/15.0
- Schools +4.5/10.0
- Rent growth +2.7/5.0
- Livability +2.5/5.0
- Condition / age +2.5/5.0
$64,900
🖨 Deal sheet 📄 Offer letter ✓ Due diligence
Listing remarks
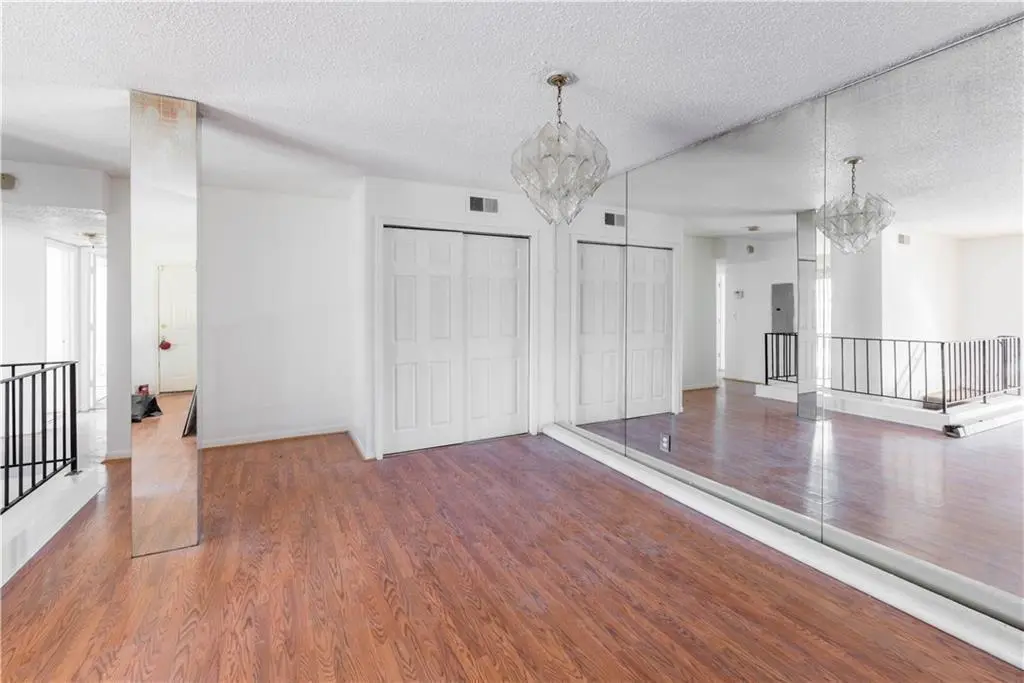
Rare opportunity to own one of the largest floorplans in the community. This spacious townhouse-style condo features 4 bedrooms, 3 full bathrooms, and a highly desirable dual-primary layout with TWO oversized primary suites, each offering a private en-suite bathroom and private balcony. Designed for flexibility, this unique floorplan is ideal for roommates, multi-generational living, owner-occupants seeking additional privacy, or investors looking for strong rental potential. Generous living and dining areas, ample storage, and multiple living spaces provide room to spread out and make the space your own. Recent updates include a newer HVAC system (2022) and water heater. HOA dues include w
Key facts
- Private balcony
- Dual-primary layout
- Newer hvac system
Tags
Property features AI
Finance
- HOA & community: Monthly association fee; Association covers grounds and structure maintenance, trash and water
Exterior
- Parking: Parking lot
- Utilities: Public water; Public sewer; 110V and 220V electric; Cable available; Natural gas available; Phone available; Water and sewer available
- Home design: Two levels; Condominium ownership; Resale property
- Construction: Stucco and wood siding exterior; Composition shingle roof; Slab foundation; Built as part of a multi-unit community (approximately 100 units)
- Exterior features: Balcony; Side porch; Asphalt road frontage on a city street; Community includes clubhouse, lake, park, trails/greenway and nearby public transport, schools and shopping; Airport/runway nearby
Interior
- Kitchen: Cabinets; Pantry; Open view to family room; Dishwasher; Electric range; Refrigerator
- Bedrooms: Three main-level bedrooms; One lower-level bedroom; Double master bedroom and oversized master
- Flooring: Carpet; Ceramic tile; Wood
- Bathrooms: Three full bathrooms; Two main-level bathrooms; One lower-level full bathroom; Master bath with tub/shower combo
- Heating & cooling: Central heating; Ceiling fans
- Interior features: Insulated windows; One common wall with no one above; Other interior features; Bonus room, den and family room
- Laundry & utility: Laundry closet
Neighborhood map
What this means for you Summary
Snapshot
- This is a 4-bed/2.0-bath condo listed at $65k.
Deal economics
- At list price, monthly cash flow is $839 ($10k/yr) — positive.
- The deal already cash-flows at list — no discount required.
- Meets the 1% rule at list price ($2k rent vs $65k).
- Recommended offer: $64k (1.5% below list) — sets the bar for market timing.
- Cap rate 21.8% vs local median 4.6% in South Fulton — top-decile yield for the area; either an underpriced asset or a hidden risk that comps aren't pricing in. Stress-test before assuming the spread holds.
Location & tenants
- Location reads: area grade B — affects rentability + tenant quality, not the cash-flow math above.
- Fulton County (suburban): math 49% / reading 53% proficiency, ranked #12 of 174 in GA (top 7%) — acceptable for families but not a draw, mixed tenant base, ~2y average lease.
- Zoned schools: Bethune Elementary School (math 17% / reading 22%, grade F, #878 of 1,228 statewide, top 75%, 524 students, 100% FRL); Banneker High School (math 24% / reading 75%, grade D+, #28 of 424 statewide, top 7%, 1,610 students, 100% FRL) — zoned schools average 100% FRL vs 41% district-wide (59 pts higher); higher-poverty schools than district average — tighter screening recommended.
- Zoned-school proficiency averages 35% at this address vs 51% district-wide (-16 pts) — the specific schools serving this property underperform the Fulton County average; the district grade overstates school quality for this exact location.
- Market conditions: Rents flat; 651 active listings in the ZIP; 40 comparable units currently listed for rent nearby; rentals at typical pace (median 25d on market — plan ~3-4 weeks tenant-placement turnaround); 11,565 units permitted in Fulton County in 2024 (8,159 in 5+ unit buildings).
Forward outlook
- In year one you build about $7k of equity ($449 loan paydown + $6k appreciation (10.0% local appreciation)).
- Fulton County population projected at +38% by 2050 — long-run rental-demand tailwind backs the buy-and-hold thesis.
- At projected returns (10.0% appreciation + 0.9% rent growth), your $18k cash investment doubles in ~2 years — after that, you're playing with house money.
- By year 5, paydown + projected appreciation supports a ~$32k cash-out refi (75% LTV) — recoverable capital for the next deal without selling this one.
Negotiation context
- It's been on market 16 days — a 2% lower offer ($64k) is reasonable based on typical stale-listing flexibility.
- 32 sale attempts since 9y ago with the ask held roughly flat each time — persistent listings suggest the price (not the market) is what's stuck; bring a comps-based counter.
Risks & watch-outs
- Climate carrying-cost: major wind risk, 27% chance of damaging wind over 30y; extreme-heat days projected 7→18/yr by 2055 (HVAC capex compounding) — expect insurance premiums to compound above CPI over the hold.
Questions for the listing agent
- Built in 1970 — when were the roof, HVAC, electrical panel, plumbing, and water heater last replaced?
- What does the HOA fee cover, when was the last increase, and are there any pending special assessments or reserve-fund shortfalls?
- Any open or pending special assessments — roof, HVAC, plumbing, elevator, façade? What's the per-unit balance and payoff schedule, and is the seller paying it off at close or rolling it to the buyer?
- Is there a deadline driving the sale (1031 exchange, divorce, estate, relocation)? That informs how much negotiation room exists.
- This sits on a lake — are riparian / water-frontage rights deeded with the parcel? Any dock permits, shoreline easements, or HOA water-use restrictions?
- What's the documented flood / surge / shoreline-erosion history here (FEMA AND non-FEMA — e.g., storm surge, creek backup, septic-field saturation)?
- Any water-quality or seasonal algae-bloom issues that affect tenant satisfaction or short-term-rental demand?
- What's the average days-on-market for RENTAL listings here right now (not sales)? A rising rental-DOM trend means longer vacancies and softer asking-rent achievability than the comps imply.
- What's the recent tenant-quality profile in this submarket — average credit score on applications, eviction rate, late-payment / NSF rate, and stable-employment percentage? A property-management company in the area should have these aggregated.
- How much new apartment / multifamily construction is in the pipeline within 1–3 miles? Heavy new supply (>2% of stock underway) typically softens rents 12–24 months out; light construction supports rent growth.
Investment metrics
- 1% rule
- 3.07% ✓
- Cap rate
- 21.81%
- Cash-on-cash
- 55.43%
- DSCR
- 3.47
- GRM
- 2.7
CMA / ARV
No comps found within radius.
Projected returns pro-forma
10.0% appreciation · 0.95% rent growth · sell at horizon
- IRR
- 66.4%
- Equity multiple
- 5.68×
- Total profit
- $84,987
- Equity at exit
- $58,467
- IRR
- 59.0%
- Equity multiple
- 12.07×
- Total profit
- $201,138
- Equity at exit
- $126,086
Cash invested: $18,172 (down + closing). Projections, not guarantees.
Landlord ↔ Tenant lean methodology
- Overall (STATE)
- 90 Strongly Landlord-Friendly
- State Georgia
- 90 Strongly Landlord-Friendly · R+3
- County
- — inherits STATE
- City
- — inherits STATE
ZIP-level market 30349
- Home prices YoY
- 4.6%
- Rents YoY
- 0.9%
- Active inventory
- 651
- Price-to-rent
- 2.7×
Monthly cashflow live
- Estimated rent
- $1,991 high interval (Pro) →
- Mortgage (P&I)
- −$340
- Tax from tax record
- −$66 /mo · $795/yr
- Insurance
- −$27
- HOA
- −$300
- Vacancy / Maint / Mgmt
- −$418
- Net cashflow
- $839
Break-even live
UW: 25.0% down · 7.5% · 30yr · 1.5% tax · 5.0% vac · 8.0% maint · 8.0% mgmt
Financing live
Cash to close
- Down payment
- $16,225
- Closing costs
- $1,947
- Reserves months
- —
- Total cash needed
- —
Loan-product check · same deal, 3 products live
Conventional
25% down · 7.5% · 30yr
- Down + closing
- —
- Monthly P&I
- —
- Monthly cashflow
- —
- DSCR
- —
- Eligible?
- —
Personal DTI + credit; lowest rate.
DSCR
20% down · 8.5% · 30yr
- Down + closing
- —
- Monthly P&I
- —
- Monthly cashflow
- —
- DSCR
- —
- Eligible?
- —
No personal income docs; deal must DSCR.
Hard money
10% down · 12.0% · 12mo
- Down + closing
- —
- Monthly P&I
- —
- Monthly cashflow
- —
- DSCR
- —
- Eligible?
- —
Short-term bridge; refi at stabilization.
Rent comps 40 comps
| Address | Beds | Baths | Sqft | Rent | $/sqft | DOM | Units | Dist |
|---|---|---|---|---|---|---|---|---|
| 2500 Pleasant Hill Rd Atlanta, GA | 2.0–3.0 | 1.5–2.5 | 1405 | $1,449 | $1.03 | 24d | 2 | 0.37mi |
| 5335 Willow Park Blvd Atlanta, GA | 4.0 | 2.5 | 1716 | $2,000 | $1.17 | 44d | 1 | 0.40mi |
| 5645 Deerfield Trl Atlanta, GA | 3.0 | 1.5 | 1496 | $1,495 | $1.00 | 22d | 1 | 0.43mi |
| 5712 Westhill Cir Atlanta, GA | 4.0 | 2.0 | 1441 | $1,710 | $1.19 | 3d | 1 | 0.46mi |
| 2555 Flat Shoals Rd #3005 Atlanta, GA | 3.0 | 2.5 | 1724 | $1,850 | $1.07 | 5d | 1 | 0.71mi |
| 2555 Flat Shoals Rd #404 College Park, GA | 3.0 | 2.5 | 1408 | $1,700 | $1.21 | 24d | 1 | 0.72mi |
| 6056 Carriage Ct Atlanta, GA | 3.0 | 2.0 | 1400 | $1,599 | $1.14 | 5d | 1 | 0.72mi |
| 2555 Flat Shoals Rd #401 Atlanta, GA | 3.0 | 2.5 | 1550 | $2,050 | $1.32 | 44d | 1 | 0.77mi |
| 395 Fox Trail Dr Atlanta, GA | 3.0 | 2.0 | 1400 | $1,980 | $1.41 | 11d | 1 | 0.88mi |
| 6120 Hemperly Rd Atlanta, GA | 4.0 | 2.5 | 1770 | $2,100 | $1.19 | 24d | 1 | 0.90mi |
| 6120 Hemperly Rd Atlanta, GA | 4.0 | 2.5 | 1770 | $2,100 | $1.19 | 4d | 1 | 0.90mi |
| 5194 Seaside Ct Atlanta, GA | 4.0 | 2.5 | 1765 | $2,135 | $1.21 | 24d | 1 | 0.97mi |
| 2736 Live Oak Trl Atlanta, GA | 4.0 | 3.0 | 2050 | $1,650 | $0.80 | 11d | 1 | 0.97mi |
| 2250 Sandgate Cir Atlanta, GA | 4.0 | 3.0 | 1916 | $2,100 | $1.10 | 15d | 1 | 0.98mi |
| 5247 Scofield Rd Atlanta, GA | 3.0 | 2.0 | 1958 | $2,000 | $1.02 | 44d | 1 | 1.03mi |
| 320 Emerald Green Ct Atlanta, GA | 3.0 | 2.0 | 1575 | $2,050 | $1.30 | 44d | 1 | 1.04mi |
| 5843 Summerglen Ln Atlanta, GA | 3.0 | 2.5 | 2453 | $1,795 | $0.73 | 24d | 1 | 1.05mi |
| 5477 Denny Dr Atlanta, GA | 4.0 | 3.0 | 1500 | $1,650 | $1.10 | 44d | 1 | 1.05mi |
| 6027 Oak Bend Ct Riverdale, GA | 3.0 | 2.5 | 1530 | $2,070 | $1.35 | 5d | 1 | 1.07mi |
| 5866 Summerglen Ln Atlanta, GA | 3.0 | 2.0 | 1400 | $1,450 | $1.04 | 44d | 1 | 1.09mi |
| 6048 Oak Bend Ct Riverdale, GA | 3.0 | 2.5 | 1500 | $1,750 | $1.17 | 22d | 1 | 1.13mi |
| 6078 Oak Bend Ct Riverdale, GA | 3.0 | 2.5 | 1622 | $1,800 | $1.11 | 24d | 1 | 1.20mi |
| 2817 Windsor Forrest Ct Atlanta, GA | 3.0 | 2.5 | 1408 | $1,697 | $1.21 | 44d | 1 | 1.21mi |
| 5750 Buffington Rd Atlanta, GA | 1.0–3.0 | 1.0–2.0 | 1142 | $1,702 | $1.49 | 2d | 19 | 1.21mi |
| 2835 Windsor Forrest Ct Atlanta, GA | 3.0 | 2.5 | 1680 | $1,881 | $1.12 | 5d | 1 | 1.21mi |
| 5287 Chantilly Ter Atlanta, GA | 4.0 | 2.5 | 1897 | $2,006 | $1.06 | 22d | 1 | 1.23mi |
| 6278 Rockaway Rd Atlanta, GA | 3.0 | 2.5 | 1524 | $2,000 | $1.31 | 44d | 1 | 1.24mi |
| 3280 Sable Trl Atlanta, GA | 3.0 | 3.0 | 2342 | $1,650 | $0.70 | 11d | 1 | 1.24mi |
| 3282 Sable Trl Unit 1 Atlanta, GA | 3.0 | 3.0 | 2342 | $1,795 | $0.77 | 44d | 1 | 1.24mi |
| 5601 Sable Way Atlanta, GA | 4.0 | 2.5 | 2495 | $2,381 | $0.95 | 24d | 1 | 1.34mi |
| 5234 Norman Blvd Atlanta, GA | 3.0 | 2.0 | 1404 | $1,785 | $1.27 | 44d | 1 | 1.37mi |
| 3364 Estes Dr Atlanta, GA | 3.0 | 2.5 | 1736 | $1,889 | $1.09 | 17d | 1 | 1.37mi |
| 5275 Hanover St Atlanta, GA | 3.0 | 2.5 | 1613 | $2,013 | $1.25 | 5d | 1 | 1.38mi |
| 2667 Rocky Ct Atlanta, GA | 3.0 | 2.5 | 1432 | $2,200 | $1.54 | 44d | 1 | 1.38mi |
| 5298 Hanover St Atlanta, GA | 3.0 | 2.5 | 1610 | $2,188 | $1.36 | 5d | 1 | 1.40mi |
| 5219 Hanover St Atlanta, GA | 3.0 | 2.5 | 1864 | $1,850 | $0.99 | 44d | 1 | 1.42mi |
| 3105 Garnet Way Atlanta, GA | 3.0 | 2.0 | 1470 | $1,660 | $1.13 | 13d | 1 | 1.44mi |
| 5185 Hanover St Atlanta, GA | 3.0 | 2.0 | 1750 | $1,950 | $1.11 | 44d | 1 | 1.46mi |
| 5185 Hanover St Unit 1 Atlanta, GA | 3.0 | 2.5 | 1750 | $1,950 | $1.11 | 44d | 1 | 1.46mi |
| 5848 El Segundo Way Atlanta, GA | 5.0 | 3.0 | 2560 | $2,560 | $1.00 | 5d | 1 | 1.46mi |
HOA detail condo
- Monthly dues
- $300 · $3,600/yr
- Likely covers
- water
- Assessments
- None detected in remarks — confirm with the listing agent.
Listing history 11 events
-
2026-06-18days on market $64,900 Active 16 DOM
-
2026-06-17days on market $64,900 Active 15 DOM
-
2026-06-16days on market $64,900 Active 14 DOM
-
2026-06-15days on market $64,900 Active 13 DOM
-
2026-06-13days on market $64,900 Active 11 DOM
-
2026-06-09days on market $64,900 Active 7 DOM
-
2026-06-08days on market $64,900 Active 6 DOM
-
2026-06-07days on market $64,900 Active 5 DOM
-
2026-06-04days on market $64,900 Active 2 DOM
-
2026-06-03remarks 699-char remark
-
2026-06-03$64,900 Active 1 DOM
ⓘ Source: listings_history table (triggers on properties + properties_extension) + one-shot
backfill from property_details.listing_events for pre-trigger history.
Tax reassessment forecast GA · Resets to sale price
- Current annual tax
- $795 · $66/mo
- Projected year-2 tax
- $795 · $66/mo
- Expected delta
- $0/yr ($0/mo · 0.0%)
ⓘ Screening estimate from a state-policy table — verify with the county assessor before closing.
Climate risk First Street
- Flood 1/10 Low FEMA zone X (unshaded) · 0% chance over 30 yrs
- Wildfire 3/10 Moderate
- Heat 6/10 Major 7 d/yr ≥104°F today · 18 d/yr by 30 yrs out
- Wind 6/10 Major 27% chance of damaging wind over 30 yrs
- Air quality 4/10 Moderate 4 unhealthy d/yr today · 6 by 30 yrs out
Nearby sold comps map
Loading sold comps map…
Walkable amenities ~0.75 mi
Loading nearby amenities…
Taxation est. · year 1
- Rental income
- $23,894
- − Mortgage interest
- −$3,635
- − Property taxes
- −$795
- − Insurance
- −$324
- − Repairs & maintenance
- −$1,912
- − Management
- −$1,912
- − HOA
- −$3,600
- − Depreciation
- −$1,888
- Taxable income
- $9,828
- Est. tax owed @ 24.0%
- −$2,359
- After-tax cash flow
- $7,714/yr
For passive investors: Depreciation is non-cash, so a rental often shows a tax loss while cash-flowing — sheltering income. Rental losses are passive: they offset passive income freely, and up to $25,000/yr can offset ordinary (W-2) income if you actively participate and your MAGI is under $100k (phasing out to $0 by $150k); unused losses carry forward. On sale, claimed depreciation is recaptured at up to 25%, and gains may owe capital-gains tax (a 1031 exchange can defer both). Figures are a year-1 estimate at your 24.0% rate — not tax advice; consult a CPA.
Schools (NCES district)
- District
- Fulton County
- NCES district ID
- 1302280
- Math proficiency
- 49% ▼ -2.00%
- Reading proficiency
- 53% ▬ 0.00%
- Median HH income
- $68,035
- Composite
- 45.33/100
- National rank
- #2640
- State rank
- #12 of 174 in GA
Livability — South Fulton
No livability data for this city. (Only ~50 U.S. cities are tracked.)
Census & demographics
- Census place
- South Fulton, GA
- County
- Fulton County · 1,094,430 people
- City population
- 10,694
- Metro
- Atlanta-Sandy Springs-Alpharetta, GA
- Population (ZIP)
- 79,872
- Household income
- $67,023
- Rent vs Own
- Severe rent burden
- 4258.0
Population outlook (Fulton County) Hauer SSP2
- Today (2025)
- 1,203,707 people
- By 2030
- 1,299,706 · +8.0%
- By 2040
- 1,488,256 · +23.6%
- By 2050
- 1,664,580 · +38.3%
- By 2075
- 2,036,072 · +69.2%
- By 2100
- 2,222,402 · +84.6%
Race, ethnicity, and origin ACS 2023
- Neighborhood character
- Predominantly Black (89%)
- Race & ethnicity
- Black 89% Hispanic / Latino 5% Two or more races 4% White 3%
- Foreign-born
- 9% · Canada
- Languages at home
- 88% English-only · Spanish 6% French/Haitian/Cajun 1%
Political lean MEDSL · Fulton
- 2024 margin
- Solid D (+44.9) · D 71.9% · R 27.0% · Other 1.1%
- 2008→2024 swing
- +9.8pp toward D · 2008: 35.0pp · 2024: 44.9pp
- All cycles
- 2024: D+44.9 2020: D+46.4 2016: D+42.1 2012: D+29.6 2008: D+35.0
Not yet ingested
- Civics
- —
Market trends
- HPI YoY
- ▲ 18.01%
- Current HPI
- 407.99
- Rent YoY
- ▲ 0.95%
- Metro
- Atlanta-Sandy Springs-Alpharetta, GA
- State GDP YoY
- ▲ 2.66%
- F500 in state
- 28
Industry mix (Fortune 500 HQ in GA)
| Industry | F500 HQs | Revenue |
|---|---|---|
| Paper / Packaging | 2 | $29B |
|
||
| Retail | 1 | $160B |
|
||
| Transportation / Logistics | 1 | $91B |
|
||
| Airlines | 1 | $62B |
|
||
| Consumer Goods | 1 | $47B |
|
||
| Utilities | 1 | $25B |
|
||
Price history
+6.4% since first listed76 events — show timeline
- 2026-06-02 Listed $64,900 FMLS
- 2026-04-30 Listing Removed — GAMLS
- 2026-04-07 Relisted — GAMLS
- 2026-03-31 Listing Removed — GAMLS
- 2026-03-11 Price Changed $59,900 GAMLS
- 2026-02-25 Listed $69,900 GAMLS
- 2025-10-31 Listing Removed — GAMLS
- 2025-09-15 Listed $75,000 GAMLS
- 2025-08-31 Listing Removed — GAMLS
- 2025-08-27 Price Changed $75,000 GAMLS
- 2025-07-25 Listed $80,000 GAMLS
- 2025-07-20 Listing Removed — GAMLS
- 2025-07-20 Listing Removed — FMLS
- 2025-06-10 Listed $80,000 FMLS
- 2025-06-09 Price Changed $80,000 FMLS
- 2025-06-09 Coming Soon — FMLS
- 2025-06-09 Listed $85,000 GAMLS
- 2025-04-06 Listing Removed — GAMLS
- 2025-04-06 Listing Removed — FMLS
- 2025-03-06 Listed $80,000 GAMLS
- 2025-03-06 Listed $80,000 FMLS
- 2025-02-28 Listing Removed — GAMLS
- 2025-02-28 Listing Removed — FMLS
- 2025-01-07 Listed $80,000 GAMLS
- 2025-01-07 Listed $80,000 FMLS
- 2024-12-31 Listing Removed — FMLS
- 2024-12-02 Relisted — FMLS
- 2024-11-30 Listing Removed — GAMLS
- 2024-11-30 Listing Removed — FMLS
- 2024-11-01 Relisted — GAMLS
- 2024-11-01 Relisted — FMLS
- 2024-10-25 Pending — GAMLS
- 2024-10-11 Contingent — GAMLS
- 2024-10-07 Pending — FMLS
- 2024-09-20 Listed $85,000 GAMLS
- 2024-09-20 Listed $85,000 FMLS
- 2024-05-31 Listing Removed — FMLS
- 2024-05-31 Listing Removed — GAMLS
- 2024-05-06 Relisted — FMLS
- 2024-04-25 Pending — FMLS
- 2024-04-11 Listed $85,000 FMLS
- 2024-04-08 Listed $85,000 GAMLS
- 2024-02-29 Listing Removed — GAMLS
- 2024-02-29 Listing Removed — FMLS
- 2024-02-16 Relisted — GAMLS
- 2024-02-15 Relisted — FMLS
- 2024-01-30 Pending — FMLS
- 2024-01-30 Pending — GAMLS
- 2024-01-23 Relisted — FMLS
- 2023-12-31 Listing Removed — GAMLS
- 2023-12-21 Pending — FMLS
- 2023-12-20 Contingent — FMLS
- 2023-12-08 Listed $90,000 GAMLS
- 2023-11-21 Listed $90,000 GAMLS
- 2023-11-21 Listed $90,000 FMLS
- 2021-06-29 Sold (MLS) $65,000 GAMLS
- 2021-06-29 Sold (MLS) $65,000 FMLS
- 2021-06-16 Pending — FMLS
- 2021-06-16 Contingent — FMLS
- 2021-06-06 Pending — GAMLS
- 2021-06-03 Listed $59,900 FMLS
- 2021-05-31 Listed $59,900 GAMLS
- 2018-06-26 Pending — GAMLS
- 2018-06-26 Listing Removed — GAMLS
- 2018-06-22 Price Changed $45,000 GAMLS
- 2018-06-16 Relisted — GAMLS
- 2018-04-19 Pending — GAMLS
- 2018-04-16 Relisted — GAMLS
- 2018-02-09 Pending — GAMLS
- 2018-01-16 Relisted — GAMLS
- 2018-01-11 Pending — GAMLS
- 2018-01-04 Relisted — GAMLS
- 2017-12-11 Pending — GAMLS
- 2017-11-16 Listed $55,000 GAMLS
- 1984-12-03 Sold (Public Records) $50,250 Public Records
- 1980-06-04 Sold (Public Records) $61,000 Public Records
Property tax history
+4.6%/yrLatest (2025): $795 · -14.9% YoY. Source: county tax records.
Cash-flow waterfall
monthlySold comps — $/sqft
last 12 mo · ≤1 miLoading sold comps…