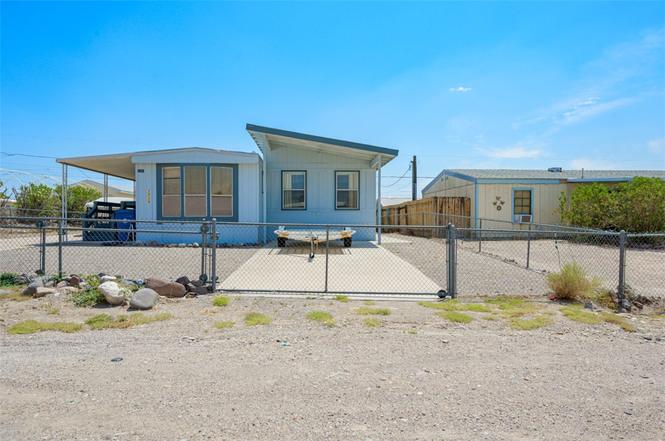
1850 Ramar Rd · Bullhead City, AZ
Flood risk 1/10 · Minimal
- FEMA flood zone
- X (unshaded)
- Chance of flooding over 30 yrs
- 0.0%
- Est. flood insurance / yr
- $507 – $1,088
Fire risk 4/10 · Minor
- Est. fire insurance / yr
- $610 – $1,132
Heat risk 9/10 · Severe
- Hot days now (above 114°F)
- 7 days/yr
- Hot days in 30 yrs
- 14 days/yr
Wind risk 1/10 · Minimal
- Chance of severe wind over 30 yrs
- —
Air-quality risk 1/10 · Minimal
- Unhealthy air days now
- 0 days/yr
- Unhealthy air days in 30 yrs
- 0 days/yr
Risk factors via First Street. Map © Google.
Why this score? — see what drove the D+ grade
The composite is a weighted blend of 9 inputs, each scored 0–100. Each bar is that input's sub-score; the figure is the points it added to the 100-point composite (weight × sub-score).
- Cash flow +21.4/30.0
- ARV discount +7.5/15.0
- DSCR +6.8/10.0
- 1% rule +4.4/10.0
- Livability +3.2/5.0
- Condition / age +2.5/5.0
- Rent growth +2.3/5.0
- Schools +1.6/10.0
- Appreciation +0.0/10.0
$159,900
🖨 Deal sheet 📄 Offer letter ✓ Due diligence
Listing remarks
Welcome to this 3 bedroom home offering comfort, space, and unbeatable location! Featuring a large master bedroom and a spacious living room, this home provides plenty of room to relax and entertain. Step outside to enjoy the expansive front patio perfect for morning coffee or evening sunsets. The property also includes double gates for RV parking or all your desert toys, giving you the freedom and flexibility you ve been looking for. Located in a great neighborhood with NO HOA, you ll enjoy added privacy and fewer restrictions. Take in the beautiful views while being just minutes from the fun and adventure of the Colorado River, Lake Mohave, and the entertainment, dining, and nightlife o
Key facts
- Beautiful views
- 6,534 sq ft lot
- Built 1982
Tags
Property features AI
Exterior
- Utilities: Public water; Public sewer; Electricity available (220 volts); Natural gas available
- Home design: Manufactured home (single wide); Residential property type
- Construction: Shingle roof
- Exterior features: Front and back yard fencing (chain link); Has a view
Interior
- Kitchen: Breakfast bar; Laminate counters
- Bathrooms: One three-quarter bathroom
- Heating & cooling: Central air; Electric cooling; Ceiling fan(s)
- Interior features: Open floorplan; Breakfast bar; Ceiling fans; Laminate countertops; Accessible full bathroom
- Laundry & utility: Washer; Dryer; Water heater
Neighborhood map
What this means for you Summary
Snapshot
- This is a 3-bed/1.0-bath land listed at $160k.
Deal economics
- At list price, monthly cash flow is $237 ($3k/yr) — positive.
- The deal already cash-flows at list — no discount required.
- To meet the 1% rule (rent ≥ 1% of price), the offer needs to be $150k (6.1% below list).
- Recommended offer: $146k (9.0% below list) — sets the bar for market timing.
- Cap rate 8.1% vs local median 3.7% in Bullhead City — top-decile yield for the area; either an underpriced asset or a hidden risk that comps aren't pricing in. Stress-test before assuming the spread holds.
Location & tenants
- Location reads 64/100 on livability (#103 in AZ) — a middle-class / working-renter tenant base. Strengths: cost of living A+, housing A+; Watch: health & safety C-, employment D, schools F.
- Bullhead City School District (4378) (town): math 16% / reading 22% proficiency, ranked #189 of 249 in AZ (top 76%) — low school quality limits family demand, transient renter base, plan for 1-2y turnover; 68% free/reduced lunch — lower-income household profile, screen leases tightly.
- Market conditions: Rents soft (-0.9%/yr); 710 active listings in the ZIP; 10 comparable units currently listed for rent nearby; rentals leasing fast (median 14d on market — plan ~1-2 weeks tenant-placement turnaround); 2,543 units permitted in Mohave County in 2024 (33 in 5+ unit buildings).
- This rent runs 37% of the median local income ($48k/yr) — at the standard rent-burdened threshold; future hikes will face affordability resistance.
Forward outlook
- Local home prices are declining (-3.0%/yr); year-one equity from $1k of loan paydown is wiped out by about $5k of value loss. Plan a longer hold.
- Mohave County population projected to shrink 6% by 2050 — rents likely to lag national; underwrite the cash flow, not the appreciation.
Negotiation context
- It's been on market 104 days — a 9% lower offer ($146k) is reasonable based on typical stale-listing flexibility.
- 2 sale attempts with the ask held roughly flat each time — persistent listings suggest the price (not the market) is what's stuck; bring a comps-based counter.
- Current owner paid $29k; list at $160k implies a 451% gain — meaningful room to come down on a strong offer.
Risks & watch-outs
- Climate carrying-cost: extreme-heat days projected 7→14/yr by 2055 (HVAC capex compounding) — expect insurance premiums to compound above CPI over the hold.
Questions for the listing agent
- It's been on market 104 days. Have you received any prior offers? Is the seller open to a 9% concession, seller financing, or rate buy-down credit?
- Why hasn't it sold? Are there any deal-killer items the seller is aware of (foundation, flood, title, zoning, code violations)?
- Is there a deadline driving the sale (1031 exchange, divorce, estate, relocation)? That informs how much negotiation room exists.
- Schools are F-rated, which usually means shorter tenancies and higher turnover. Who's the typical renter profile here, and what's been the actual vacancy rate?
- Crime grade is D in this area — have there been break-ins, vandalism, or insurance claims at this property in the last 3 years? What carrier currently insures it and at what premium?
- The area grade is low — what's the realistic commute time and amenity access for the typical tenant pool here? Any planned neighborhood developments (good or bad) we should know about?
- What's the average days-on-market for RENTAL listings here right now (not sales)? A rising rental-DOM trend means longer vacancies and softer asking-rent achievability than the comps imply.
- What's the recent tenant-quality profile in this submarket — average credit score on applications, eviction rate, late-payment / NSF rate, and stable-employment percentage? A property-management company in the area should have these aggregated.
- How much new for-sale + rental construction is in the pipeline within 1–3 miles? Heavy new supply typically softens prices + rents 12–24 months out; constrained supply supports both.
Investment metrics
- 1% rule
- 0.94% ✗
- Cap rate
- 8.07%
- Cash-on-cash
- 6.34%
- DSCR
- 1.28
- GRM
- 8.9
CMA / ARV
No comps found within radius.
Projected returns pro-forma
-3.0% appreciation · 0.0% rent growth · sell at horizon
- IRR
- -9.6%
- Equity multiple
- 0.66×
- Total profit
- $-15,314
- Equity at exit
- $23,842
- IRR
- -4.3%
- Equity multiple
- 0.75×
- Total profit
- $-11,229
- Equity at exit
- $13,825
Cash invested: $44,772 (down + closing). Projections, not guarantees.
Landlord ↔ Tenant lean methodology
- Overall (STATE)
- 87 Strongly Landlord-Friendly
- State Arizona
- 87 Strongly Landlord-Friendly · R+3
- County
- — inherits STATE
- City
- — inherits STATE
ZIP-level market 86442
- Home prices YoY
- -27.0%
- Rents YoY
- -0.9%
- Active inventory
- 710
- Price-to-rent
- 8.9×
Monthly cashflow live
- Estimated rent
- $1,501 high interval (Pro) →
- Mortgage (P&I)
- −$839
- Tax from tax record
- −$44 /mo · $528/yr
- Insurance
- −$67
- HOA
- −$0
- Vacancy / Maint / Mgmt
- −$315
- Net cashflow
- $237
Break-even live
UW: 25.0% down · 7.5% · 30yr · 1.5% tax · 5.0% vac · 8.0% maint · 8.0% mgmt
Financing live
Cash to close
- Down payment
- $39,975
- Closing costs
- $4,797
- Reserves months
- —
- Total cash needed
- —
Loan-product check · same deal, 3 products live
Conventional
25% down · 7.5% · 30yr
- Down + closing
- —
- Monthly P&I
- —
- Monthly cashflow
- —
- DSCR
- —
- Eligible?
- —
Personal DTI + credit; lowest rate.
DSCR
20% down · 8.5% · 30yr
- Down + closing
- —
- Monthly P&I
- —
- Monthly cashflow
- —
- DSCR
- —
- Eligible?
- —
No personal income docs; deal must DSCR.
Hard money
10% down · 12.0% · 12mo
- Down + closing
- —
- Monthly P&I
- —
- Monthly cashflow
- —
- DSCR
- —
- Eligible?
- —
Short-term bridge; refi at stabilization.
Rent comps 10 comps
| Address | Beds | Baths | Sqft | Rent | $/sqft | DOM | Units | Dist |
|---|---|---|---|---|---|---|---|---|
| 1770 Arriba Dr Bullhead City, AZ | 1.0–3.0 | 1.0 | 826 | $1,250 | $1.51 | 13d | 3 | 0.40mi |
| 1453 Luna Ln Bullhead City, AZ | 2.0 | 1.0 | 1050 | $1,500 | $1.43 | 13d | 1 | 0.50mi |
| 1618 Goldrush Rd Bullhead City, AZ | 2.0 | 1.0–2.0 | 731 | $1,298 | $1.77 | 13d | 6 | 0.60mi |
| 2030 Prospector Ct Bullhead City, AZ | 2.0–3.0 | 2.0 | 1118 | $1,574 | $1.41 | 13d | 13 | 0.66mi |
| 1663 Highway 95 Unit C11 Bullhead City, AZ | 2.0 | 2.0 | 1014 | $1,800 | $1.78 | 13d | 1 | 0.92mi |
| 1611 AZ-95 Unit C210 Bullhead City, AZ | 2.0 | 2.0 | 1108 | $1,900 | $1.71 | 13d | 1 | 1.10mi |
| 1611 AZ-95 Unit A 103 Bullhead City, AZ | 2.0 | 2.0 | 1100 | $1,425 | $1.30 | 13d | 1 | 1.10mi |
| 1645 Palma Cir W Bullhead City, AZ | 2.0 | 1.0 | 682 | $950 | $1.39 | 13d | 1 | 1.19mi |
| 2022 Merrill Ln Bullhead City, AZ | 2.0–3.0 | 2.0–3.0 | 1193 | $1,500 | $1.26 | 21d | 2 | 1.26mi |
| 1570 Paseo Grande Bullhead City, AZ | 1.0–2.0 | 1.0–2.0 | 775 | $1,585 | $2.05 | 13d | 10 | 1.38mi |
Listing history 19 events
-
2026-06-18days on market $159,900 Active 104 DOM
-
2026-06-17days on market $159,900 Active 103 DOM
-
2026-06-16days on market $159,900 Active 102 DOM
-
2026-06-15days on market $159,900 Active 101 DOM
-
2026-06-14days on market $159,900 Active 99 DOM
-
2026-06-13days on market $159,900 Active 98 DOM
-
2026-06-10days on market $159,900 Active 96 DOM
-
2026-06-09days on market $159,900 Active 95 DOM
-
2026-06-08days on market $159,900 Active 94 DOM
-
2026-06-07days on market $159,900 Active 93 DOM
-
2026-06-05days on market $159,900 Active 90 DOM
-
2026-06-02days on market $159,900 Active 88 DOM
-
2026-06-01days on market $159,900 Active 87 DOM
-
2026-05-31days on market $159,900 Active 86 DOM
-
2026-05-30days on market $159,900 Active 85 DOM
-
2026-04-06status Active
-
2026-03-30status Pending
-
2026-02-26$159,900 Active
-
1988-04-01soldstatus $29,000
ⓘ Source: listings_history table (triggers on properties + properties_extension) + one-shot
backfill from property_details.listing_events for pre-trigger history.
Tax reassessment forecast AZ · Resets to sale price
- Current annual tax
- $528 · $44/mo
- Projected year-2 tax
- $1,055 · $88/mo
- Expected delta
- +$527/yr (+$44/mo · 99.7%)
ⓘ Screening estimate from a state-policy table — verify with the county assessor before closing.
Climate risk First Street
- Flood 1/10 Low FEMA zone X (unshaded) · 0% chance over 30 yrs
- Wildfire 4/10 Moderate
- Heat 9/10 Extreme 7 d/yr ≥114°F today · 14 d/yr by 30 yrs out
- Wind 1/10 Low
- Air quality 1/10 Low 0 unhealthy d/yr today · 0 by 30 yrs out
Nearby sold comps map
Loading sold comps map…
Walkable amenities ~0.75 mi
Loading nearby amenities…
Taxation est. · year 1
- Rental income
- $18,012
- − Mortgage interest
- −$8,957
- − Property taxes
- −$528
- − Insurance
- −$800
- − Repairs & maintenance
- −$1,441
- − Management
- −$1,441
- − Depreciation
- −$4,652
- Taxable income
- $193
- Est. tax owed @ 24.0%
- −$46
- After-tax cash flow
- $2,793/yr
For passive investors: Depreciation is non-cash, so a rental often shows a tax loss while cash-flowing — sheltering income. Rental losses are passive: they offset passive income freely, and up to $25,000/yr can offset ordinary (W-2) income if you actively participate and your MAGI is under $100k (phasing out to $0 by $150k); unused losses carry forward. On sale, claimed depreciation is recaptured at up to 25%, and gains may owe capital-gains tax (a 1031 exchange can defer both). Figures are a year-1 estimate at your 24.0% rate — not tax advice; consult a CPA.
Schools (NCES district)
- District
- Bullhead City School District (4378)
- NCES district ID
- 0401500
- Math proficiency
- 16% ▼ -11.00%
- Reading proficiency
- 22% ▼ -6.00%
- Median HH income
- $37,109
- Composite
- 15.83/100
- National rank
- #9263
- State rank
- #189 of 249 in AZ
Livability — Bullhead City
- Score
- 64/100
- State rank
- #103
- US rank
- #14458
Category grades
Schools grade is shown separately in the Schools card above.
Census & demographics
- Census place
- Bullhead City, AZ
- County
- Mohave County · 181,906 people
- City population
- 43,354
- Metro
- Lake Havasu City-Kingman, AZ
- Population (ZIP)
- 34,735
- Household income
- $48,081
- Rent vs Own
- Severe rent burden
- 1040.0
Population outlook (Mohave County) Hauer SSP2
- Today (2025)
- 209,184 people
- By 2030
- 209,674 · +0.2%
- By 2040
- 205,897 · -1.6%
- By 2050
- 196,810 · -5.9%
- By 2075
- 169,454 · -19.0%
- By 2100
- 136,630 · -34.7%
Race, ethnicity, and origin ACS 2023
- Neighborhood character
- Predominantly White (68%)
- Race & ethnicity
- White 68% Hispanic / Latino 22% Two or more races 12% Black 2% Asian 2%
- Hispanic origin (detail)
- Mexican 19%
- Common ancestry
- Portuguese 3% Romanian 2% Lithuanian 2%
- Foreign-born
- 9% · Canada, South Korea
- Languages at home
- 87% English-only · Spanish 11%
Political lean MEDSL · Mohave
- 2024 margin
- Solid R (+55.8) · D 21.8% · R 77.6%
- 2008→2024 swing
- -22.9pp toward R · 2008: -32.9pp · 2024: -55.8pp
- All cycles
- 2024: R+55.8 2020: R+51.3 2016: R+51.5 2012: R+42.6 2008: R+32.9
Not yet ingested
- Civics
- —
Market trends
- HPI YoY
- ▼ -100.11%
- Current HPI
- 270.3297
- Rent YoY
- ▼ -0.90%
- Metro
- Lake Havasu City-Kingman, AZ
- State GDP YoY
- ▲ 4.54%
- F500 in state
- 20
Industry mix (Fortune 500 HQ in AZ)
| Industry | F500 HQs | Revenue |
|---|---|---|
| Technology | 2 | $13B |
|
||
| Mining / Metals | 1 | $23B |
|
||
| Environmental Services | 1 | $16B |
|
||
| Metals / Steel | 1 | $14B |
|
||
| Technology Distribution | 1 | $9B |
|
||
| Homebuilding | 1 | $8B |
|
||
Price history
+451.4% since first listed4 events — show timeline
- 2026-04-06 Relisted — WARDEX
- 2026-03-30 Pending — WARDEX
- 2026-02-26 Listed $159,900 WARDEX
- 1988-04-01 Sold (Public Records) $29,000 Public Records
Property tax history
+1.7%/yrLatest (2025): $528 · +3.3% YoY. Source: county tax records.
Cash-flow waterfall
monthlySold comps — $/sqft
last 12 mo · ≤1 miLoading sold comps…