37068 Sugar Hill Way · Ocean City, MD
Flood risk No data
- FEMA flood zone
- —
- Chance of flooding over 30 yrs
- —
- Est. flood insurance / yr
- —
Fire risk No data
- Est. fire insurance / yr
- —
Heat risk No data
- Hot days now (above threshold)
- —
- Hot days in 30 yrs
- —
Wind risk No data
- Chance of severe wind over 30 yrs
- —
Air-quality risk No data
- Unhealthy air days now
- —
- Unhealthy air days in 30 yrs
- —
Risk factors via First Street. Map © Google.
Why this score? — see what drove the D+ grade
The composite is a weighted blend of 9 inputs, each scored 0–100. Each bar is that input's sub-score; the figure is the points it added to the 100-point composite (weight × sub-score).
- Cash flow +23.5/30.0
- DSCR +7.5/10.0
- 1% rule +6.1/10.0
- Condition / age +3.8/5.0
- Livability +3.7/5.0
- Schools +2.9/10.0
- Rent growth +2.5/5.0
- ARV discount +0.0/15.0
- Appreciation +0.0/10.0
$180,000
🖨 Deal sheet 📄 Offer letter ✓ Due diligence
Listing remarks
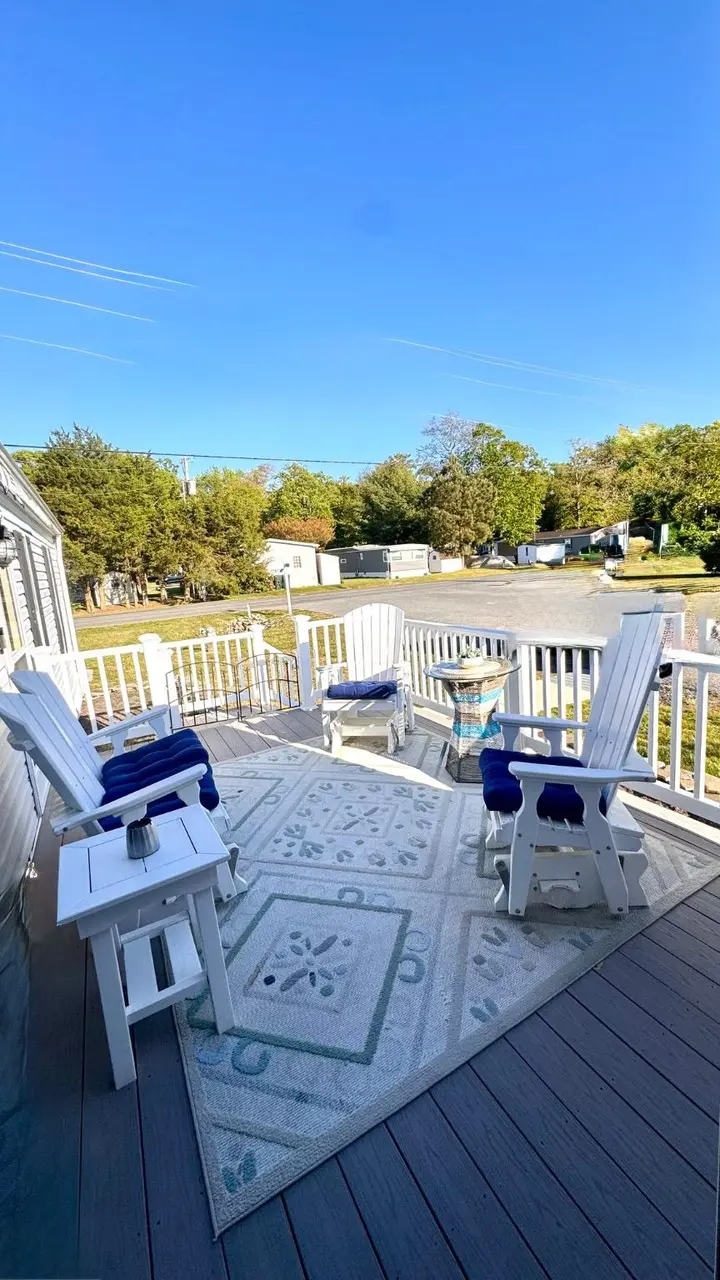
Welcome to Shady Park, a friendly all ages community in Selbyville, DE, known for its welcoming atmosphere and active community events with a voluntary HOA. This charming 2 bedroom, 2 full bath home is located on a corner lot and features coastal décor and a bright, airy layout with1,120 sq. ft. of interior living space, which includes the 140 sq. ft. sunroom, perfect for enjoying morning coffee or relaxing year round in natural light. Step outside to the 120 sq. ft. deck, complete with an automatic awning, ideal for outdoor dining and entertaining. Additional features include a two door storage shed for tools, bikes, or beach gear. Shady Park offers water access to Dirickson Creek,
Key facts
- Sunroom
- Automatic awning
- Corner lot
Tags
Property features AI
Finance
- Other: Property manager present; Located in Shady Park; outside city limits; state-maintained blacktop road
- Financial info: Land lease amount paid monthly
- HOA & community: Annual HOA fee ($10) covering common area maintenance and recreation facility; Community amenities include boat ramp, common grounds, playgrounds, recreational center and picnic area; Ground rent exists ($650.37 monthly) and land lease with many years remaining
Exterior
- Parking: Paved parking (unassigned); On-street parking
- Utilities: Public water; Public sewer; 100 amp electric service; Propane available; Cable internet/TV; Municipal trash not provided
- Home design: Manufactured single-wide home (Pine Grove model); Estimated year built; Level entry to main; North-facing main entrance; Above grade living area approximately 1,120 finished
- Construction: Aluminum siding; Shingle roof; Slab foundation; Building not winterized
- Exterior features: Awning(s); Deck(s), enclosed porch(es); Shed; Corner lot; Water access to Dirickson Creek (canoe/kayak, powered boat, private access); Navigable creek access
Interior
- Kitchen: Dishwasher; Microwave; Gas range; Refrigerator
- Bedrooms: 2 bedrooms on the main level
- Flooring: Carpet; Luxury vinyl plank
- Bathrooms: 2 full bathrooms (including master bath)
- Heating & cooling: 90% forced air heating (natural gas); Central air conditioning; Ceiling fans; Electric hot water
- Interior features: Walk-in shower and tub/shower combination; Breakfast area and eat-in / table space kitchen; Built-ins; Ceiling fans; Flat interior; Family room off kitchen; Partially furnished; Cathedral ceilings
- Laundry & utility: Washer/dryer hookup
Neighborhood map
What this means for you Summary
Snapshot
- This is a 2-bed/2.0-bath manufactured listed at $180k. Condition is rated good.
Deal economics
- At list price, monthly cash flow is $335 ($4k/yr) — positive.
- The deal already cash-flows at list — no discount required.
- Meets the 1% rule at list price ($2k rent vs $180k).
- Recommended offer: $175k (3.0% below list) — sets the bar for market timing.
- Cap rate 8.5% vs local median 1.4% in Ocean City — top-decile yield for the area; either an underpriced asset or a hidden risk that comps aren't pricing in. Stress-test before assuming the spread holds.
Location & tenants
- Location reads 73/100 on livability (#125 in MD) — a middle-class / working-renter tenant base. Strengths: commute A+, health & safety A+, amenities B; Watch: cost of living C-, crime F.
- Indian River School District (rural): math 25% / reading 41% proficiency, ranked #14 of 26 in DE (top 54%) — families likely to look elsewhere, expect single-tenant / working-renter base with shorter leases.
- Zoned schools: Showell (Phillip C.) Elementary School (math 27% / reading 37%, grade F, #44 of 105 statewide, top 46%, 279 students, 0% FRL); Selbyville Middle School (math 20% / reading 49%, grade F, #12 of 36 statewide, top 34%, 719 students, 0% FRL); Indian River High School (math 32% / reading 52%, grade F, #10 of 40 statewide, top 26%, 1,088 students, 0% FRL) — zoned schools average 0% FRL vs 49% district-wide (49 pts lower); this property's tenant base skews higher-income than the district average.
- Market conditions: 1 comparable units currently listed for rent nearby; 4,354 units permitted in Sussex County in 2024 (344 in 5+ unit buildings).
Forward outlook
- Local home prices are declining (-3.0%/yr); year-one equity from $1k of loan paydown is wiped out by about $5k of value loss. Plan a longer hold.
- Sussex County population projected at +25% by 2050 — long-run rental-demand tailwind backs the buy-and-hold thesis.
Negotiation context
- It's been on market 40 days — a 3% lower offer ($175k) is reasonable based on typical stale-listing flexibility.
Questions for the listing agent
- It's been on market 40 days. Have you received any prior offers? Is the seller open to a 3% concession, seller financing, or rate buy-down credit?
- What does the HOA fee cover, when was the last increase, and are there any pending special assessments or reserve-fund shortfalls?
- Is there a deadline driving the sale (1031 exchange, divorce, estate, relocation)? That informs how much negotiation room exists.
- Schools are B-rated — typically a magnet for longer-tenancy family renters. What's the average tenant stay here, and is there a school-zone premium baked into asking?
- Crime grade is F in this area — have there been break-ins, vandalism, or insurance claims at this property in the last 3 years? What carrier currently insures it and at what premium?
- The area grade is low — what's the realistic commute time and amenity access for the typical tenant pool here? Any planned neighborhood developments (good or bad) we should know about?
- What's the average days-on-market for RENTAL listings here right now (not sales)? A rising rental-DOM trend means longer vacancies and softer asking-rent achievability than the comps imply.
- What's the recent tenant-quality profile in this submarket — average credit score on applications, eviction rate, late-payment / NSF rate, and stable-employment percentage? A property-management company in the area should have these aggregated.
- How much new for-sale + rental construction is in the pipeline within 1–3 miles? Heavy new supply typically softens prices + rents 12–24 months out; constrained supply supports both.
Investment metrics
- 1% rule
- 1.11% ✓
- Cap rate
- 8.53%
- Cash-on-cash
- 7.98%
- DSCR
- 1.35
- GRM
- 7.5
CMA / ARV
- ARV (median comp)
- $134,202
- List price
- $180,000
- Delta
- 34.13%
- Verdict
- OVERPRICED
- Comps
- 20 within 1.0 mi
Show comp detail 1 sale within ~0.75 mi
| Address | Dist | Beds/Ba | Sqft | Sold | Price | $/sf | Match |
|---|---|---|---|---|---|---|---|
| 37597 Shady Cir | 0.20mi | 2/1.0 | 1,000 (+2%) | 10mo | $70,000 | $70 | 75 |
Match score weights: distance 35% · size 25% · config 20% · recency 20%. Top-matched comps best support the ARV.
Projected returns pro-forma
-3.0% appreciation · 3.0% rent growth · sell at horizon
- IRR
- -4.1%
- Equity multiple
- 0.85×
- Total profit
- $-7,797
- Equity at exit
- $26,839
- IRR
- 5.6%
- Equity multiple
- 1.41×
- Total profit
- $20,815
- Equity at exit
- $15,563
Cash invested: $50,400 (down + closing). Projections, not guarantees.
Landlord ↔ Tenant lean methodology
- Overall (STATE)
- 27 Tenant-Leaning
- State Maryland
- 27 Tenant-Leaning · D+14
- County
- — inherits STATE
- City
- — inherits STATE
ZIP-level market 19975
- Home prices YoY
- -11.2%
- Price-to-rent
- 7.5×
Monthly cashflow live
- Estimated rent
- $2,000 medium interval (Pro) →
- Mortgage (P&I)
- −$944
- Tax est. 1.5%
- −$225 /mo · $2,700/yr
- Insurance
- −$75
- HOA
- −$1
- Vacancy / Maint / Mgmt
- −$420
- Net cashflow
- $335
Break-even live
UW: 25.0% down · 7.5% · 30yr · 1.5% tax · 5.0% vac · 8.0% maint · 8.0% mgmt
Financing live
Cash to close
- Down payment
- $45,000
- Closing costs
- $5,400
- Reserves months
- —
- Total cash needed
- —
Loan-product check · same deal, 3 products live
Conventional
25% down · 7.5% · 30yr
- Down + closing
- —
- Monthly P&I
- —
- Monthly cashflow
- —
- DSCR
- —
- Eligible?
- —
Personal DTI + credit; lowest rate.
DSCR
20% down · 8.5% · 30yr
- Down + closing
- —
- Monthly P&I
- —
- Monthly cashflow
- —
- DSCR
- —
- Eligible?
- —
No personal income docs; deal must DSCR.
Hard money
10% down · 12.0% · 12mo
- Down + closing
- —
- Monthly P&I
- —
- Monthly cashflow
- —
- DSCR
- —
- Eligible?
- —
Short-term bridge; refi at stabilization.
Rent comps 1 comps
| Address | Beds | Baths | Sqft | Rent | $/sqft | DOM | Units | Dist |
|---|---|---|---|---|---|---|---|---|
| 38256 Hummingbird Ln #214 Selbyville, DE | 2.0 | 1.5 | 900 | $2,000 | $2.22 | 20d | 1 | 0.92mi |
HOA detail
- Monthly dues
- $1 · $12/yr
- Likely covers
- water
Listing history 15 events
-
2026-06-18days on market $180,000 Active 40 DOM
-
2026-06-17days on market $180,000 Active 39 DOM
-
2026-06-16days on market $180,000 Active 38 DOM
-
2026-06-15days on market $180,000 Active 37 DOM
-
2026-06-14days on market $180,000 Active 35 DOM
-
2026-06-13days on market $180,000 Active 34 DOM
-
2026-06-10days on market $180,000 Active 32 DOM
-
2026-06-09days on market $180,000 Active 31 DOM
-
2026-06-08days on market $180,000 Active 30 DOM
-
2026-06-07days on market $180,000 Active 29 DOM
-
2026-06-02days on market $180,000 Active 24 DOM
-
2026-06-01days on market $180,000 Active 23 DOM
-
2026-05-31days on market $180,000 Active 22 DOM
-
2026-05-30days on market $180,000 Active 21 DOM
-
2026-05-09$180,000 Active 1841-char remark
ⓘ Source: listings_history table (triggers on properties + properties_extension) + one-shot
backfill from property_details.listing_events for pre-trigger history.
Nearby sold comps map
Loading sold comps map…
Walkable amenities ~0.75 mi
Loading nearby amenities…
Taxation est. · year 1
- Rental income
- $24,000
- − Mortgage interest
- −$10,083
- − Property taxes
- −$2,700
- − Insurance
- −$900
- − Repairs & maintenance
- −$1,920
- − Management
- −$1,920
- − HOA
- −$12
- − Depreciation
- −$5,236
- Taxable income
- $1,229
- Est. tax owed @ 24.0%
- −$295
- After-tax cash flow
- $3,726/yr
For passive investors: Depreciation is non-cash, so a rental often shows a tax loss while cash-flowing — sheltering income. Rental losses are passive: they offset passive income freely, and up to $25,000/yr can offset ordinary (W-2) income if you actively participate and your MAGI is under $100k (phasing out to $0 by $150k); unused losses carry forward. On sale, claimed depreciation is recaptured at up to 25%, and gains may owe capital-gains tax (a 1031 exchange can defer both). Figures are a year-1 estimate at your 24.0% rate — not tax advice; consult a CPA.
Condition & rehab AI · 12 photos
This manufactured home is in good condition with a good condition score of 75. It has a cosmetic rehab level and requires minor maintenance such as painting the exterior siding and cleaning the gutters. The home has a good resale and rental value with updates such as painting the exterior siding and cleaning the gutters that can increase its value.
Value-add opportunities
- Both Paint the exterior siding — Painting the exterior siding can enhance the curb appeal and increase the home's value.
- Both Clean the gutters — Cleaning the gutters can improve the home's appearance and prevent water damage to the siding and foundation.
Renovation cost estimate screening
Value-add ROI direction
- Both Paint the exterior siding — Painting the exterior siding can enhance the curb appeal and increase the home's value. ↑
- Both Clean the gutters — Cleaning the gutters can improve the home's appearance and prevent water damage to the siding and foundation. ↑
ⓘ Cost ranges are severity-bucket heuristics (US national rule-of-thumb). Get contractor quotes + a written scope before underwriting a rehab budget.
Schools (NCES district)
- District
- Indian River School District
- NCES district ID
- 1000680
- Math proficiency
- 25% ▼ -27.00%
- Reading proficiency
- 41% ▼ -17.00%
- Median HH income
- $53,838
- Composite
- 28.99/100
- National rank
- #6620
- State rank
- #14 of 26 in DE
Livability — Ocean City
- Score
- 73/100
- State rank
- #125
- US rank
- #5407
Category grades
Schools grade is shown separately in the Schools card above.
Census & demographics
- Population (ZIP)
- 10,356
Population outlook (Sussex County) Hauer SSP2
- Today (2025)
- 248,853 people
- By 2030
- 264,464 · +6.3%
- By 2040
- 290,980 · +16.9%
- By 2050
- 311,259 · +25.1%
- By 2075
- 352,488 · +41.6%
- By 2100
- 367,406 · +47.6%
Race, ethnicity, and origin ACS 2023
- Neighborhood character
- Predominantly White (86%)
- Race & ethnicity
- White 86% Hispanic / Latino 8% Two or more races 7% Black 3%
- Hispanic origin (detail)
- Mexican 4%
- Common ancestry
- Romanian 4% Slovak 4% Russian 2%
- Foreign-born
- 8% · Canada
- Languages at home
- 89% English-only · Spanish 8% Other Indo-European 2% Russian/Polish/Slavic 1%
Political lean MEDSL · Sussex
- 2024 margin
- R (+11.0) · D 43.9% · R 54.9% · Other 1.2%
- 2008→2024 swing
- -2.4pp toward R · 2008: -8.6pp · 2024: -11.0pp
- All cycles
- 2024: R+11.0 2020: R+11.2 2016: R+22.0 2012: R+13.0 2008: R+8.6
Not yet ingested
- Civics
- —
Market trends
- HPI YoY
- ▼ -43.61%
- Current HPI
- 345.1746
- Rent YoY
- —
- Metro
- —
- State GDP YoY
- ▲ 2.97%
- F500 in state
- 12
Industry mix (Fortune 500 HQ in MD)
| Industry | F500 HQs | Revenue |
|---|---|---|
| Aerospace / Defense | 1 | $71B |
|
||
| Utilities | 1 | $25B |
|
||
| Hotels | 1 | $24B |
|
||
| Consumer Goods | 1 | $7B |
|
||
| Real Estate | 1 | $6B |
|
||
| Chemicals | 1 | $2B |
|
||
Price history
1 event — show timeline
- 2026-05-09 Listed $180,000 BRIGHT MLS
Property tax history
-40.4%/yrLatest (2025): $164 · -40.4% YoY. Source: county tax records.
Cash-flow waterfall
monthlySold comps — $/sqft
last 12 mo · ≤1 miLoading sold comps…