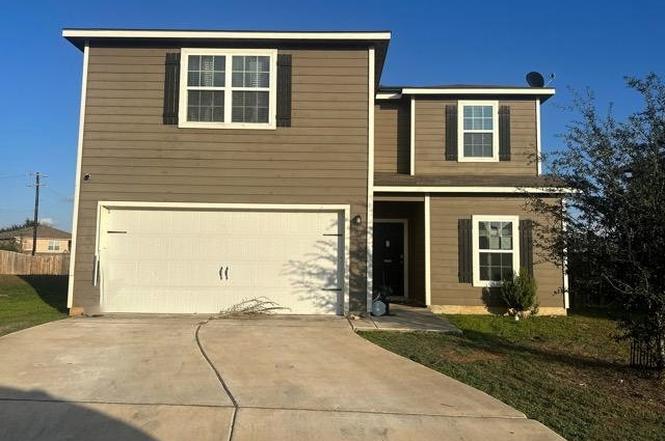
6722 Sabinal · San Antonio, TX
Flood risk 1/10 · Minimal
- FEMA flood zone
- X (unshaded)
- Chance of flooding over 30 yrs
- 0.0%
- Est. flood insurance / yr
- $507 – $1,088
Fire risk 2/10 · Minimal
- Est. fire insurance / yr
- $1,222 – $2,270
Heat risk 8/10 · Major
- Hot days now (above 109°F)
- 7 days/yr
- Hot days in 30 yrs
- 23 days/yr
Wind risk 8/10 · Major
- Chance of severe wind over 30 yrs
- 80.0%
Air-quality risk 2/10 · Minimal
- Unhealthy air days now
- 1 days/yr
- Unhealthy air days in 30 yrs
- 1 days/yr
Risk factors via First Street. Map © Google.
Why this score? — see what drove the B- grade
The composite is a weighted blend of 9 inputs, each scored 0–100. Each bar is that input's sub-score; the figure is the points it added to the 100-point composite (weight × sub-score).
- Cash flow +22.3/30.0
- ARV discount +15.0/15.0
- DSCR +7.1/10.0
- 1% rule +5.9/10.0
- Appreciation +5.0/10.0
- Schools +4.4/10.0
- Livability +4.0/5.0
- Condition / age +2.5/5.0
- Rent growth +2.1/5.0
$195,000
🖨 Deal sheet 📄 Offer letter ✓ Due diligence
Listing remarks MLS
New from LGI Homes: This beautiful new 2 story home features 5 bedrooms and 2.5 bathrooms. The kitchen features beautiful wood cabinets and energy efficient appliances. New refrigerator included! Additional features include raised six panel doors, brushed nickel hardware and energy efficient windows.
Key facts
- Large backyard
- Original features
- Access to us-90
Tags
Neighborhood map
What this means for you Summary
Snapshot
- This is a 5-bed/2.5-bath single-family listed at $195k.
Deal economics
- At list price, monthly cash flow is $321 ($4k/yr) — positive.
- The deal already cash-flows at list — no discount required.
- Meets the 1% rule at list price ($2k rent vs $195k).
- Recommended offer: $183k (6.0% below list) — sets the bar for market timing.
- Cap rate 8.3% vs local median 3.8% in San Antonio — top-decile yield for the area; either an underpriced asset or a hidden risk that comps aren't pricing in. Stress-test before assuming the spread holds.
Location & tenants
- Location reads 80/100 on livability (#31 in TX, #1,616 nationally) — a professional / high-income tenant draw. Strengths: amenities A+, commute A+, cost of living A+; Watch: crime F.
- Medina Valley ISD (rural): math 48% / reading 53% proficiency, ranked #148 of 826 in TX (top 18%) — acceptable for families but not a draw, mixed tenant base, ~2y average lease.
- Zoned schools: Luckey Ranch El (math 47% / reading 50%, grade D, #950 of 4,322 statewide, top 22%, 866 students, 67% FRL); Medina Valley Middle (math 47% / reading 49%, grade C-, #400 of 1,662 statewide, top 24%, 1,029 students, 62% FRL); Medina Valley H S (math 34% / reading 55%, grade F, #652 of 1,632 statewide, top 43%, 2,147 students, 51% FRL).
- Market conditions: Rents soft (-1.7%/yr); 537 active listings in the ZIP; 22 comparable units currently listed for rent nearby; rentals at typical pace (median 22d on market — plan ~3-4 weeks tenant-placement turnaround); solid renter incomes; 8,308 units permitted in Bexar County in 2024 (2,506 in 5+ unit buildings).
Forward outlook
- In year one you build about $1k of equity ($1k loan paydown + $-4 appreciation (-0.0% local appreciation)).
- Bexar County population projected at +50% by 2050 — long-run rental-demand tailwind backs the buy-and-hold thesis.
Negotiation context
- It's been on market 62 days — a 6% lower offer ($183k) is reasonable based on typical stale-listing flexibility.
- 6 sale attempts since 8y ago with the ask held roughly flat each time — persistent listings suggest the price (not the market) is what's stuck; bring a comps-based counter.
Risks & watch-outs
- Climate carrying-cost: severe wind risk, 80% chance of damaging wind over 30y; extreme-heat days projected 7→23/yr by 2055 (HVAC capex compounding) — expect insurance premiums to compound above CPI over the hold.
Questions for the listing agent
- It's been on market 62 days. Have you received any prior offers? Is the seller open to a 6% concession, seller financing, or rate buy-down credit?
- What does the HOA fee cover, when was the last increase, and are there any pending special assessments or reserve-fund shortfalls?
- Why hasn't it sold? Are there any deal-killer items the seller is aware of (foundation, flood, title, zoning, code violations)?
- Is there a deadline driving the sale (1031 exchange, divorce, estate, relocation)? That informs how much negotiation room exists.
- Crime grade is F in this area — have there been break-ins, vandalism, or insurance claims at this property in the last 3 years? What carrier currently insures it and at what premium?
- What's the average days-on-market for RENTAL listings here right now (not sales)? A rising rental-DOM trend means longer vacancies and softer asking-rent achievability than the comps imply.
- What's the recent tenant-quality profile in this submarket — average credit score on applications, eviction rate, late-payment / NSF rate, and stable-employment percentage? A property-management company in the area should have these aggregated.
- How much new for-sale + rental construction is in the pipeline within 1–3 miles? Heavy new supply typically softens prices + rents 12–24 months out; constrained supply supports both.
Investment metrics
- 1% rule
- 1.09% ✓
- Cap rate
- 8.27%
- Cash-on-cash
- 7.05%
- DSCR
- 1.31
- GRM
- 7.6
CMA / ARV
- ARV (on-the-fly)
- $374,245
- Comps found
- 12
Show comp detail 12 sales within ~0.75 mi
| Address | Dist | Beds/Ba | Sqft | Sold | Price | $/sf | Match |
|---|---|---|---|---|---|---|---|
| 12346 Kirshner Way | 0.15mi | 5/2.5 | 2,581 (0%) | 13mo | $255,000 | $99 | 82 |
| 7315 Turnbow | 0.52mi | 5/2.5 | 2,541 (-2%) | 4mo | $279,000 | $110 | 70 |
| 6630 Luckey Tree | 0.50mi | 5/2.5 | 2,581 (0%) | 14mo | $300,000 | $116 | 66 |
| 11822 Claudette St | 0.60mi | 5/2.5 | 2,581 (0%) | 10mo | $234,600 | $91 | 64 |
| 6714 Luckey Tree | 0.53mi | 5/2.5 | 2,581 (0%) | 15mo | $285,000 | $110 | 63 |
| 12018 Parish Dv | 0.67mi | 5/3.5 | 2,470 (-4%) | 11mo | $371,900 | $151 | 49 |
| 11855 Davalos | 0.30mi | 4/2.5 (-1) | 2,202 (-15%) | 11mo | $284,900 | $129 | 48 |
| 11958 Luckey Villa | 0.73mi | 5/3.5 | 2,470 (-4%) | 15mo | $357,900 | $145 | 42 |
| 11991 Luckey Villa | 0.65mi | 4/2.5 (-1) | 2,205 (-15%) | 9mo | $360,900 | $164 | 33 |
| 11957 Luckey Villa | 0.72mi | 4/2.5 (-1) | 2,205 (-15%) | 10mo | $354,900 | $161 | 29 |
| 11928 Stroud Dr | 0.74mi | 4/2.5 (-1) | 2,205 (-15%) | 10mo | $356,900 | $162 | 28 |
| 11962 Luckey Villa | 0.73mi | 4/2.5 (-1) | 2,205 (-15%) | 16mo | $346,900 | $157 | 24 |
Match score weights: distance 35% · size 25% · config 20% · recency 20%. Top-matched comps best support the ARV.
Projected returns pro-forma
-0.0% appreciation · 0.0% rent growth · sell at horizon
- IRR
- 3.4%
- Equity multiple
- 1.16×
- Total profit
- $8,504
- Equity at exit
- $56,604
- IRR
- 6.5%
- Equity multiple
- 1.65×
- Total profit
- $35,317
- Equity at exit
- $68,027
Cash invested: $54,600 (down + closing). Projections, not guarantees.
Landlord ↔ Tenant lean methodology
- Overall (STATE)
- 87 Strongly Landlord-Friendly
- State Texas
- 87 Strongly Landlord-Friendly · R+5
- County
- — inherits STATE
- City
- — inherits STATE
ZIP-level market 78252
- Home prices YoY
- -0.0%
- Rents YoY
- -1.7%
- Active inventory
- 537
- Price-to-rent
- 7.6×
Monthly cashflow live
- Estimated rent
- $2,129 high interval (Pro) →
- Mortgage (P&I)
- −$1,023
- Tax from tax record
- −$225 /mo · $2,697/yr
- Insurance
- −$81
- HOA
- −$33
- Vacancy / Maint / Mgmt
- −$447
- Net cashflow
- $321
Break-even live
UW: 25.0% down · 7.5% · 30yr · 1.5% tax · 5.0% vac · 8.0% maint · 8.0% mgmt
Financing live
Cash to close
- Down payment
- $48,750
- Closing costs
- $5,850
- Reserves months
- —
- Total cash needed
- —
Loan-product check · same deal, 3 products live
Conventional
25% down · 7.5% · 30yr
- Down + closing
- —
- Monthly P&I
- —
- Monthly cashflow
- —
- DSCR
- —
- Eligible?
- —
Personal DTI + credit; lowest rate.
DSCR
20% down · 8.5% · 30yr
- Down + closing
- —
- Monthly P&I
- —
- Monthly cashflow
- —
- DSCR
- —
- Eligible?
- —
No personal income docs; deal must DSCR.
Hard money
10% down · 12.0% · 12mo
- Down + closing
- —
- Monthly P&I
- —
- Monthly cashflow
- —
- DSCR
- —
- Eligible?
- —
Short-term bridge; refi at stabilization.
Rent comps 22 comps
| Address | Beds | Baths | Sqft | Rent | $/sqft | DOM | Units | Dist |
|---|---|---|---|---|---|---|---|---|
| 6528 Dodger Vly San Antonio, TX | 4.0 | 2.0 | 1822 | $1,800 | $0.99 | 43d | 1 | 0.17mi |
| 11824 Luckey Fls San Antonio, TX | 4.0 | 2.5 | 2239 | $1,796 | $0.80 | 12d | 1 | 0.27mi |
| 11769 Alcoser Ct San Antonio, TX | 5.0 | 2.5 | 2548 | $1,869 | $0.73 | 4d | 1 | 0.38mi |
| 7204 Jebson Pass San Antonio, TX | 4.0 | 2.0 | 2202 | $1,900 | $0.86 | 14d | 1 | 0.38mi |
| 11753 Alcoser Ct San Antonio, TX | 4.0 | 2.0 | 1792 | $1,589 | $0.89 | 21d | 1 | 0.40mi |
| 7216 Jebson Pass San Antonio, TX | 4.0 | 3.5 | 2205 | $5,200 | $2.36 | 1d | 1 | 0.41mi |
| 12251 Siragusa San Antonio, TX | 4.0 | 2.0 | 1822 | $2,050 | $1.13 | 2d | 1 | 0.44mi |
| 6406 Underwood Way San Antonio, TX | 5.0 | 2.5 | 2538 | $2,195 | $0.86 | 43d | 1 | 0.49mi |
| 11811 Wolf Cyn San Antonio, TX | 4.0 | 2.0 | 1893 | $1,725 | $0.91 | 43d | 1 | 0.60mi |
| 11543 Luckey Ledge San Antonio, TX | 4.0 | 2.0 | 1793 | $1,615 | $0.90 | 43d | 1 | 0.62mi |
| 10843 Emerick St San Antonio, TX | 4.0 | 2.5 | 2400 | $2,300 | $0.96 | 4d | 1 | 0.66mi |
| 10858 Quinn Ct San Antonio, TX | 2.0–5.0 | 2.0–3.5 | 1733 | $2,520 | $1.45 | 1d | 1 | 0.69mi |
| 6441 Staccato Staff San Antonio, TX | 4.0 | 2.0 | 1906 | $1,950 | $1.02 | 4d | 1 | 1.18mi |
| 6621 Kingsley Edge San Antonio, TX | 4.0 | 2.0 | 1906 | $1,850 | $0.97 | 43d | 1 | 1.27mi |
| 11655 Bakersfield Pass San Antonio, TX | 4.0 | 2.5 | 2268 | $2,185 | $0.96 | 2d | 1 | 1.30mi |
| 11643 Troubadour Trl San Antonio, TX | 4.0 | 3.5 | 2412 | $2,147 | $0.89 | 23d | 1 | 1.36mi |
| 11627 Troubadour Trl San Antonio, TX | 4.0 | 3.0 | 2497 | $2,350 | $0.94 | 23d | 1 | 1.38mi |
| 6727 Hoffman Pln San Antonio, TX | 4.0 | 2.5 | 2327 | $2,100 | $0.90 | 43d | 1 | 1.41mi |
| 13310 Whisper Bnd San Antonio, TX | 4.0 | 2.0 | 1900 | $1,795 | $0.94 | 21d | 1 | 1.41mi |
| 11806 Black Rose San Antonio, TX | 4.0 | 2.5 | 2100 | $2,150 | $1.02 | 43d | 1 | 1.44mi |
| 5565 Mansions Blfs San Antonio, TX | 1.0–4.0 | 1.0–3.0 | 1326 | $2,321 | $1.75 | 1d | 33 | 1.44mi |
| 12667 Corona Borealis San Antonio, TX | 5.0 | 3.0 | 2610 | $2,250 | $0.86 | 12d | 1 | 1.49mi |
HOA detail
- Monthly dues
- $33 · $396/yr
Listing history 16 events
-
2026-05-26status Pending
-
2026-04-17historical
-
2026-04-03status Active
-
2026-03-30status Pending
-
2026-02-10$195,000 Active
-
2019-04-30soldstatus Sold 302-char remark
Show marketing remark (302 chars)
New from LGI Homes: This beautiful new 2 story home features 5 bedrooms and 2.5 bathrooms. The kitchen features beautiful wood cabinets and energy efficient appliances. New refrigerator included! Additional features include raised six panel doors, brushed nickel hardware and energy efficient windows.
-
2019-03-26status Pending 302-char remark
Show marketing remark (302 chars)
New from LGI Homes: This beautiful new 2 story home features 5 bedrooms and 2.5 bathrooms. The kitchen features beautiful wood cabinets and energy efficient appliances. New refrigerator included! Additional features include raised six panel doors, brushed nickel hardware and energy efficient windows.
-
2019-03-07$232,900 New 302-char remark
Show marketing remark (302 chars)
New from LGI Homes: This beautiful new 2 story home features 5 bedrooms and 2.5 bathrooms. The kitchen features beautiful wood cabinets and energy efficient appliances. New refrigerator included! Additional features include raised six panel doors, brushed nickel hardware and energy efficient windows.
-
2019-02-20historical
-
2019-02-09price $234,900
-
2019-01-18status Back on Market
-
2018-12-19historical
-
2018-11-21price $232,900
-
2018-11-20status Back on Market
-
2018-10-16status Pending
-
2018-10-11$230,900 New
ⓘ Source: listings_history table (triggers on properties + properties_extension) + one-shot
backfill from property_details.listing_events for pre-trigger history.
Tax reassessment forecast TX · Resets to sale price
- Current annual tax
- $2,697 · $225/mo
- Projected year-2 tax
- $3,568 · $297/mo
- Expected delta
- +$872/yr (+$73/mo · 32.3%)
ⓘ Screening estimate from a state-policy table — verify with the county assessor before closing.
Climate risk First Street
- Flood 1/10 Low FEMA zone X (unshaded) · 0% chance over 30 yrs
- Wildfire 2/10 Low
- Heat 8/10 Severe 7 d/yr ≥109°F today · 23 d/yr by 30 yrs out
- Wind 8/10 Severe 80% chance of damaging wind over 30 yrs
- Air quality 2/10 Low 1 unhealthy d/yr today · 1 by 30 yrs out
Nearby sold comps map
Loading sold comps map…
Walkable amenities ~0.75 mi
Loading nearby amenities…
Taxation est. · year 1
- Rental income
- $25,553
- − Mortgage interest
- −$10,923
- − Property taxes
- −$2,697
- − Insurance
- −$975
- − Repairs & maintenance
- −$2,044
- − Management
- −$2,044
- − HOA
- −$396
- − Depreciation
- −$5,673
- Taxable income
- $801
- Est. tax owed @ 24.0%
- −$192
- After-tax cash flow
- $3,656/yr
For passive investors: Depreciation is non-cash, so a rental often shows a tax loss while cash-flowing — sheltering income. Rental losses are passive: they offset passive income freely, and up to $25,000/yr can offset ordinary (W-2) income if you actively participate and your MAGI is under $100k (phasing out to $0 by $150k); unused losses carry forward. On sale, claimed depreciation is recaptured at up to 25%, and gains may owe capital-gains tax (a 1031 exchange can defer both). Figures are a year-1 estimate at your 24.0% rate — not tax advice; consult a CPA.
Schools (NCES district)
- District
- Medina Valley ISD
- NCES district ID
- 4830060
- Math proficiency
- 48% ▼ -9.00%
- Reading proficiency
- 53% ▼ -2.00%
- Median HH income
- $60,596
- Composite
- 44.2/100
- National rank
- #2851
- State rank
- #148 of 826 in TX
Livability — San Antonio
- Score
- 80/100
- State rank
- #31
- US rank
- #1616
Category grades
Schools grade is shown separately in the Schools card above.
Census & demographics
- County
- Bexar County · 1,990,555 people
- City population
- 1,806,925
- Metro
- San Antonio-New Braunfels, TX
- Population (ZIP)
- 21,790
- Household income
- $85,518
- Rent vs Own
- Severe rent burden
- 152.0
Population outlook (Bexar County) Hauer SSP2
- Today (2025)
- 2,336,851 people
- By 2030
- 2,560,728 · +9.6%
- By 2040
- 3,020,569 · +29.3%
- By 2050
- 3,493,522 · +49.5%
- By 2075
- 4,668,459 · +99.8%
- By 2100
- 5,533,242 · +136.8%
Race, ethnicity, and origin ACS 2023
- Neighborhood character
- Predominantly Hispanic (68%)
- Race & ethnicity
- Hispanic / Latino 68% Two or more races 29% White 17% Black 8% Asian 3% Native American 1%
- Hispanic origin (detail)
- Mexican 61% Puerto Rican 1%
- Common ancestry
- Hispanic 2% Lithuanian 1% German 1%
- Foreign-born
- 12% · Canada, South Korea
- Languages at home
- 58% English-only · Spanish 38% Tagalog/Filipino 2% Other Indo-European 1%
Political lean MEDSL · Bexar
- 2024 margin
- Lean D (+9.8) · D 54.3% · R 44.6% · Other 1.1%
- 2008→2024 swing
- +4.2pp toward D · 2008: 5.6pp · 2024: 9.8pp
- All cycles
- 2024: D+9.8 2020: D+18.2 2016: D+13.5 2012: D+4.6 2008: D+5.6
Not yet ingested
- Civics
- —
Market trends
- HPI YoY
- ▬ -0.00%
- Current HPI
- 183.6413
- Rent YoY
- ▼ -1.67%
- Metro
- San Antonio-New Braunfels, TX
- State GDP YoY
- ▲ 3.95%
- F500 in state
- 110
Industry mix (Fortune 500 HQ in TX)
| Industry | F500 HQs | Revenue |
|---|---|---|
| Energy | 16 | $1,198B |
|
||
| Technology | 5 | $198B |
|
||
| Engineering / Construction | 4 | $72B |
|
||
| Energy Services | 3 | $60B |
|
||
| Utilities | 3 | $41B |
|
||
| Healthcare | 2 | $330B |
|
||
Price history
-15.5% since first listed16 events — show timeline
- 2026-05-26 Pending — HARMLS
- 2026-04-17 Listing Removed — HARMLS
- 2026-04-03 Relisted — HARMLS
- 2026-03-30 Pending — HARMLS
- 2026-02-10 Listed $195,000 HARMLS
- 2019-04-30 Sold (MLS) — LERA
- 2019-03-26 Pending — LERA
- 2019-03-07 Listed $232,900 LERA
- 2019-02-20 Listing Removed — LERA
- 2019-02-09 Price Changed $234,900 LERA
- 2019-01-18 Relisted — LERA
- 2018-12-19 Listing Removed — LERA
- 2018-11-21 Price Changed $232,900 LERA
- 2018-11-20 Relisted — LERA
- 2018-10-16 Pending — LERA
- 2018-10-11 Listed $230,900 LERA
Property tax history
+22.9%/yrLatest (2025): $2,697 · -56.5% YoY. Source: county tax records.
Cash-flow waterfall
monthlySold comps — $/sqft
last 12 mo · ≤1 miLoading sold comps…