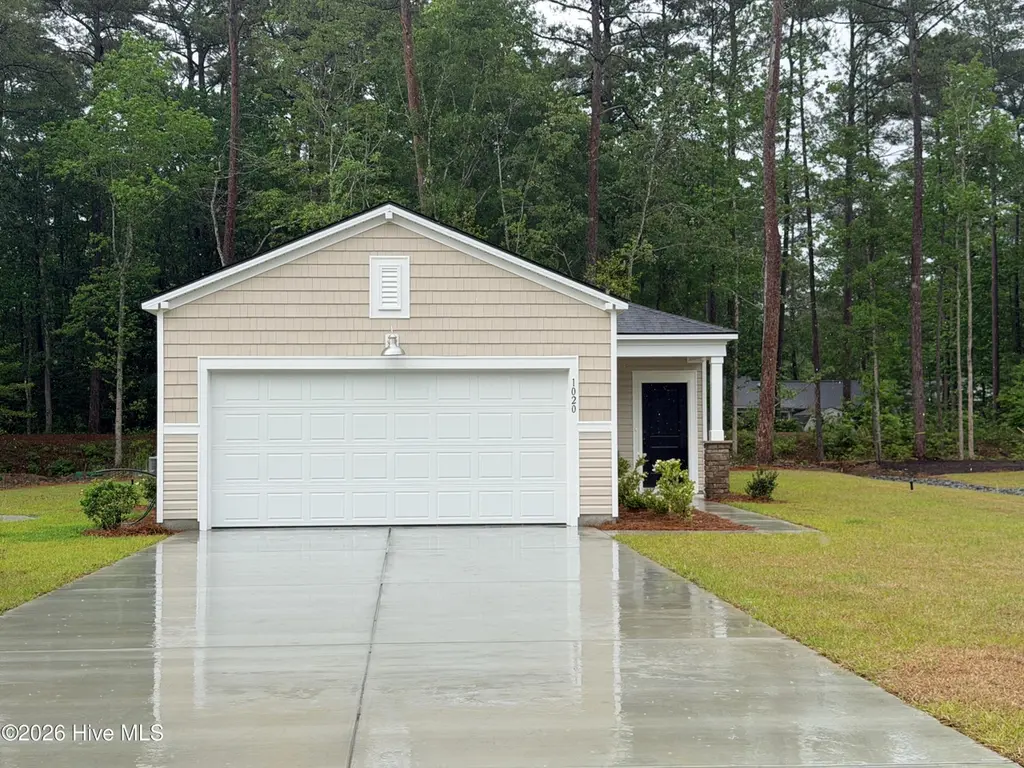
1020 Harbor Dr Lot 55 · Calabash, NC
Flood risk 6/10 · Moderate
- FEMA flood zone
- X (unshaded)
- Chance of flooding over 30 yrs
- 0.68%
- Est. flood insurance / yr
- $507 – $1,088
Fire risk 4/10 · Minor
- Est. fire insurance / yr
- $906 – $1,684
Heat risk 9/10 · Severe
- Hot days now (above 106°F)
- 7 days/yr
- Hot days in 30 yrs
- 16 days/yr
Wind risk 8/10 · Major
- Chance of severe wind over 30 yrs
- 99.0%
Air-quality risk 2/10 · Minimal
- Unhealthy air days now
- 1 days/yr
- Unhealthy air days in 30 yrs
- 1 days/yr
Risk factors via First Street. Map © Google.
Why this score? — see what drove the D- grade
The composite is a weighted blend of 9 inputs, each scored 0–100. Each bar is that input's sub-score; the figure is the points it added to the 100-point composite (weight × sub-score).
- Cash flow +11.3/30.0
- ARV discount +6.9/15.0
- Schools +3.9/10.0
- 1% rule +3.5/10.0
- DSCR +3.3/10.0
- Livability +3.1/5.0
- Rent growth +2.5/5.0
- Condition / age +2.5/5.0
- Appreciation +0.0/10.0
$259,465
🖨 Deal sheet 📄 Offer letter ✓ Due diligence
Listing remarks
MAY CLOSE DATE! Over 1/3 ACRE LOT!!! BOAT / RV PARKING ALLOWED!!! Hunter's Trace is Lennar's newest community in Brunswick County within walking distance to downtown Calabash. The Albany home boasts 3 bedrooms/2 baths and offers an open kitchen, family room and dining room. Features include 9' ceilings, 36'' white cabinets, granite kitchen countertops, stainless appliances, and breakfast bar. The owner's suite offers walk-in closet and 5' shower. This home also has a covered rear porch to enjoy the Fall breeze. Hunter's Trace is close to the beach, golfing, shopping, schools, hospital, and restaurants and within walking distance of downtown Calabash. Images shown are artist's rendering and
Key facts
- Close to the beach
- Boat parking allowed
- 1/3 acre lot
Tags
Property features AI
Finance
- Other: Zoning: CA-R-15
- HOA & community: Homeowners association with annual fee of $480 (equivalent to $40/month); No association amenities listed
Exterior
- Parking: 2 total parking spaces; 2-car attached garage; Garage faces front; Covered and paved driveway
- Utilities: Public water connected; Public sewer connected
- Home design: Single-family residence; One story; Entry level: 1st floor
- Construction: Vinyl siding and frame construction; Slab foundation; New construction
- Exterior features: Patio; No fencing; Shingle roof; Paved road access; Has a view
Interior
- Kitchen: Kitchen island; Pantry; Eat-in kitchen
- Bedrooms: Master downstairs
- Bathrooms: 2 full bathrooms
- Heating & cooling: Heat pump; Electric heating; Cooling via heat pump
- Interior features: Master bedroom on the main floor; High ceilings; Kitchen island; Pantry; Eat-in kitchen; Accessible full bathroom
Neighborhood map
What this means for you Summary
Snapshot
- This is a 3-bed/2.0-bath single-family listed at $259k.
Deal economics
- At list price, monthly cash flow is $-93 ($-1k/yr) — negative.
- To cash-flow at today's rent, offer at most $246k (5.2% below list).
- To meet the 1% rule (rent ≥ 1% of price), the offer needs to be $220k (15.1% below list).
- Recommended offer: $220k (15.1% below list) — sets the bar for 1% rule.
- Cap rate 5.9% vs local median 4.1% in Calabash — top-decile yield for the area; either an underpriced asset or a hidden risk that comps aren't pricing in. Stress-test before assuming the spread holds.
Location & tenants
- Location reads 61/100 on livability (#487 in NC) — a middle-class / working-renter tenant base. Strengths: cost of living A+, housing A+, crime A; Watch: health & safety D, amenities F, commute F.
- Brunswick County Schools (rural): math 45% / reading 47% proficiency, ranked #82 of 178 in NC (top 46%) — families likely to look elsewhere, expect single-tenant / working-renter base with shorter leases.
- Zoned schools: Jessie Mae Monroe Elementary (math 43% / reading 41%, grade F, #633 of 1,410 statewide, top 48%, 394 students, 99% FRL); Shallotte Middle (math 40% / reading 50%, grade D, #160 of 475 statewide, top 35%, 674 students, 100% FRL); West Brunswick High (math 50% / reading 56%, grade C-, #281 of 535 statewide, top 53%, 1,526 students, 100% FRL) — zoned schools average 100% FRL vs 53% district-wide (46 pts higher); higher-poverty schools than district average — tighter screening recommended.
- Market conditions: 691 active listings in the ZIP; 10 comparable units currently listed for rent nearby; rentals at typical pace (median 21d on market — plan ~3-4 weeks tenant-placement turnaround); solid renter incomes; 6,112 units permitted in Brunswick County in 2024 (990 in 5+ unit buildings).
- This rent runs 35% of the median local income ($75k/yr) — at the standard rent-burdened threshold; future hikes will face affordability resistance.
Forward outlook
- Local home prices are declining (-3.0%/yr); year-one equity from $2k of loan paydown is wiped out by about $8k of value loss. Plan a longer hold.
- Brunswick County population projected at +36% by 2050 — long-run rental-demand tailwind backs the buy-and-hold thesis.
Negotiation context
- It's been on market 44 days — a 3% lower offer ($252k) is reasonable based on typical stale-listing flexibility.
- 2 sale attempts; this cycle's ask has dropped $60k (19%) from the opening price — seller is motivated, your offer sets the floor, not the list.
Risks & watch-outs
- Climate carrying-cost: major flood risk; severe wind risk, 99% chance of damaging wind over 30y; extreme-heat days projected 7→16/yr by 2055 (HVAC capex compounding) — expect insurance premiums to compound above CPI over the hold.
Questions for the listing agent
- What do current leases actually rent for vs. the listed asking? Can we see a recent rent roll and the last 12 months of T-12 income?
- It's been on market 44 days. Have you received any prior offers? Is the seller open to a 15% concession, seller financing, or rate buy-down credit?
- What does the HOA fee cover, when was the last increase, and are there any pending special assessments or reserve-fund shortfalls?
- Is there a deadline driving the sale (1031 exchange, divorce, estate, relocation)? That informs how much negotiation room exists.
- Schools are F-rated, which usually means shorter tenancies and higher turnover. Who's the typical renter profile here, and what's been the actual vacancy rate?
- The area grade is low — what's the realistic commute time and amenity access for the typical tenant pool here? Any planned neighborhood developments (good or bad) we should know about?
- What's the average days-on-market for RENTAL listings here right now (not sales)? A rising rental-DOM trend means longer vacancies and softer asking-rent achievability than the comps imply.
- What's the recent tenant-quality profile in this submarket — average credit score on applications, eviction rate, late-payment / NSF rate, and stable-employment percentage? A property-management company in the area should have these aggregated.
- How much new for-sale + rental construction is in the pipeline within 1–3 miles? Heavy new supply typically softens prices + rents 12–24 months out; constrained supply supports both.
Investment metrics
- 1% rule
- 0.85% ✗
- Cap rate
- 5.86%
- Cash-on-cash
- -1.54%
- DSCR
- 0.93
- GRM
- 9.8
CMA / ARV
- ARV (on-the-fly)
- $256,045
- Comps found
- 12
Show comp detail 12 sales within ~0.75 mi
| Address | Dist | Beds/Ba | Sqft | Sold | Price | $/sf | Match |
|---|---|---|---|---|---|---|---|
| 1017 Harbor Dr Lot 41 | 0.05mi | 3/2.0 | 1,421 (+14%) | 1mo | $255,000 | $179 | 74 |
| 1025 Harbor Dr Lot 37 | 0.07mi | 3/2.0 | 1,419 (+14%) | 0mo | $278,865 | $197 | 74 |
| 513 Crooked Pine Pl SW | 0.35mi | 2/2.0 (-1) | 1,316 (+5%) | 1mo | $226,000 | $172 | 69 |
| 528 Leeward Way | 0.35mi | 3/2.0 | 1,221 (-2%) | 14mo | $249,900 | $205 | 68 |
| 1 Deer Run Rd | 0.40mi | 3/2.0 | 1,217 (-3%) | 13mo | $240,000 | $197 | 66 |
| 1094 Clubview Ln | 0.48mi | 2/2.0 (-1) | 1,232 (-1%) | 7mo | $215,000 | $175 | 64 |
| 749 Landmark Cv | 0.59mi | 3/2.0 | 1,258 (+1%) | 12mo | $281,000 | $223 | 61 |
| 4 Sage Ct | 0.61mi | 3/2.0 | 1,292 (+3%) | 9mo | $151,276 | $117 | 58 |
| 2 Wave Ln | 0.51mi | 2/2.0 (-1) | 1,332 (+7%) | 3mo | $275,000 | $206 | 58 |
| 493 Pepper Breeze Ave SW | 0.35mi | 2/2.0 (-1) | 1,176 (-6%) | 16mo | $250,000 | $213 | 56 |
| 1089 Albany C6 - Lot 5 Harbor Dr | 0.68mi | 3/2.0 | 1,249 (0%) | 16mo | $268,365 | $215 | 55 |
| 1089 Harbor Dr SW Lot 5 Albany | 0.68mi | 3/2.0 | 1,249 (0%) | 16mo | $268,365 | $215 | 55 |
Match score weights: distance 35% · size 25% · config 20% · recency 20%. Top-matched comps best support the ARV.
Projected returns pro-forma
-3.0% appreciation · 3.0% rent growth · sell at horizon
- IRR
- -18.8%
- Equity multiple
- 0.34×
- Total profit
- $-47,928
- Equity at exit
- $38,687
- IRR
- -11.3%
- Equity multiple
- 0.32×
- Total profit
- $-49,150
- Equity at exit
- $22,434
Cash invested: $72,650 (down + closing). Projections, not guarantees.
Landlord ↔ Tenant lean methodology
- Overall (STATE)
- 85 Strongly Landlord-Friendly
- State North Carolina
- 85 Strongly Landlord-Friendly · R+3
- County
- — inherits STATE
- City
- — inherits STATE
ZIP-level market 28467
- Home prices YoY
- -33.7%
- Active inventory
- 691
- Price-to-rent
- 9.8×
Monthly cashflow live
- Estimated rent
- $2,202 high interval (Pro) →
- Mortgage (P&I)
- −$1,361
- Tax est. 1.5%
- −$324 /mo · $3,892/yr
- Insurance
- −$108
- HOA
- −$40
- Vacancy / Maint / Mgmt
- −$462
- Net cashflow
- $-93
Break-even live
UW: 25.0% down · 7.5% · 30yr · 1.5% tax · 5.0% vac · 8.0% maint · 8.0% mgmt
Financing live
Cash to close
- Down payment
- $64,866
- Closing costs
- $7,784
- Reserves months
- —
- Total cash needed
- —
Loan-product check · same deal, 3 products live
Conventional
25% down · 7.5% · 30yr
- Down + closing
- —
- Monthly P&I
- —
- Monthly cashflow
- —
- DSCR
- —
- Eligible?
- —
Personal DTI + credit; lowest rate.
DSCR
20% down · 8.5% · 30yr
- Down + closing
- —
- Monthly P&I
- —
- Monthly cashflow
- —
- DSCR
- —
- Eligible?
- —
No personal income docs; deal must DSCR.
Hard money
10% down · 12.0% · 12mo
- Down + closing
- —
- Monthly P&I
- —
- Monthly cashflow
- —
- DSCR
- —
- Eligible?
- —
Short-term bridge; refi at stabilization.
Rent comps 10 comps
| Address | Beds | Baths | Sqft | Rent | $/sqft | DOM | Units | Dist |
|---|---|---|---|---|---|---|---|---|
| 1035 Brightwater Way Calabash, NC | 1.0–3.0 | 1.0–2.5 | 1327 | $2,145 | $1.62 | 23d | 1 | 0.16mi |
| 1063 Harbor Dr Calabash, NC | 3.0 | 2.0 | 1421 | $2,200 | $1.55 | 21d | 1 | 0.42mi |
| 834 Greenwood Ct Calabash, NC | 3.0 | 2.0 | 1475 | $2,100 | $1.42 | 14d | 1 | 0.71mi |
| 1420 Sherman Dr Calabash, NC | 2.0–3.0 | 1.0–2.0 | 1011 | $770 | $0.76 | 14d | 3 | 0.79mi |
| 660 Aubrey Ln Calabash, NC | 1.0–2.0 | 1.0–2.0 | 1081 | $2,870 | $2.65 | 14d | 69 | 0.92mi |
| 891 Mh Marina Rd #3 Carolina Shores, NC | 2.0 | 2.0 | 1250 | $1,300 | $1.04 | 14d | 1 | 1.13mi |
| 7112 Town Center Rd Sunset Beach, NC | 1.0–2.0 | 1.0–2.0 | 955 | $1,400 | $1.47 | 14d | 13 | 1.23mi |
| 31 Quaker Ridge Dr Calabash, NC | 2.0–3.0 | 2.0 | 1411 | $2,292 | $1.62 | 21d | 51 | 1.27mi |
| 1086 Mille Ave Calabash, NC | 3.0 | 2.0 | 1232 | $2,000 | $1.62 | 23d | 1 | 1.28mi |
| 2033 Wild Indigo CIR NW Calabash, NC | 3.0 | 3.0 | 1457 | $1,775 | $1.22 | 23d | 1 | 1.29mi |
HOA detail
- Monthly dues
- $40 · $480/yr
Listing history 7 events
-
2026-05-07price $259,465
-
2026-05-07price $266,365
-
2026-04-23status Active
-
2026-04-23price $295,000
-
2026-02-26status Pending
-
2026-02-16price $284,565
-
2026-02-15$319,465 Active
ⓘ Source: listings_history table (triggers on properties + properties_extension) + one-shot
backfill from property_details.listing_events for pre-trigger history.
Climate risk First Street
- Flood 6/10 Major FEMA zone X (unshaded) · 68% chance over 30 yrs
- Wildfire 4/10 Moderate
- Heat 9/10 Extreme 7 d/yr ≥106°F today · 16 d/yr by 30 yrs out
- Wind 8/10 Severe 99% chance of damaging wind over 30 yrs
- Air quality 2/10 Low 1 unhealthy d/yr today · 1 by 30 yrs out
Nearby sold comps map
Loading sold comps map…
Walkable amenities ~0.75 mi
Loading nearby amenities…
Taxation est. · year 1
- Rental income
- $26,428
- − Mortgage interest
- −$14,534
- − Property taxes
- −$3,892
- − Insurance
- −$1,297
- − Repairs & maintenance
- −$2,114
- − Management
- −$2,114
- − HOA
- −$480
- − Depreciation
- −$7,548
- Taxable loss
- −$5,552
- Est. tax savings @ 24.0%
- +$1,333
- After-tax cash flow
- $213/yr
For passive investors: Depreciation is non-cash, so a rental often shows a tax loss while cash-flowing — sheltering income. Rental losses are passive: they offset passive income freely, and up to $25,000/yr can offset ordinary (W-2) income if you actively participate and your MAGI is under $100k (phasing out to $0 by $150k); unused losses carry forward. On sale, claimed depreciation is recaptured at up to 25%, and gains may owe capital-gains tax (a 1031 exchange can defer both). Figures are a year-1 estimate at your 24.0% rate — not tax advice; consult a CPA.
Schools (NCES district)
- District
- Brunswick County Schools
- NCES district ID
- 3700420
- Math proficiency
- 45% ▲ 4.00%
- Reading proficiency
- 47% ▲ 4.00%
- Median HH income
- $47,494
- Composite
- 39.23/100
- National rank
- #4011
- State rank
- #82 of 178 in NC
Livability — Calabash
- Score
- 61/100
- State rank
- #487
- US rank
- #17866
Category grades
Schools grade is shown separately in the Schools card above.
Census & demographics
- Census place
- Calabash, NC
- County
- Brunswick County · 131,536 people
- Metro
- Myrtle Beach-Conway-North Myrtle Beach, SC-NC
- Population (ZIP)
- 13,313
- Household income
- $75,341
- Rent vs Own
- Severe rent burden
- 81.0
Population outlook (Brunswick County) Hauer SSP2
- Today (2025)
- 152,111 people
- By 2030
- 165,705 · +8.9%
- By 2040
- 188,494 · +23.9%
- By 2050
- 206,228 · +35.6%
- By 2075
- 237,876 · +56.4%
- By 2100
- 251,451 · +65.3%
Race, ethnicity, and origin ACS 2023
- Neighborhood character
- Predominantly White (90%)
- Race & ethnicity
- White 90% Two or more races 4% Black 3% Hispanic / Latino 2%
- Common ancestry
- Slovak 5% Romanian 5% Lithuanian 3%
- Foreign-born
- 3% · Canada
- Languages at home
- 98% English-only · Spanish 1%
Political lean MEDSL · Brunswick
- 2024 margin
- Strong R (+24.9) · D 37.2% · R 62.0%
- 2008→2024 swing
- -6.9pp toward R · 2008: -17.9pp · 2024: -24.9pp
- All cycles
- 2024: R+24.9 2020: R+25.0 2016: R+28.7 2012: R+22.2 2008: R+17.9
Not yet ingested
- Civics
- —
Market trends
- HPI YoY
- ▼ -67.90%
- Current HPI
- 133.7186
- Rent YoY
- —
- Metro
- Myrtle Beach-Conway-North Myrtle Beach, SC-NC
- State GDP YoY
- ▲ 3.28%
- F500 in state
- 26
Industry mix (Fortune 500 HQ in NC)
| Industry | F500 HQs | Revenue |
|---|---|---|
| Financial Services | 2 | $213B |
|
||
| Retail | 2 | $95B |
|
||
| Industrial Conglomerate | 1 | $38B |
|
||
| Metals / Steel | 1 | $35B |
|
||
| Utilities | 1 | $30B |
|
||
| Industrial Machinery | 1 | $19B |
|
||
Price history
-18.8% since first listed7 events — show timeline
- 2026-05-07 Price Changed $259,465 Hive MLS
- 2026-05-07 Price Changed $266,365 Hive MLS
- 2026-04-23 Relisted — Hive MLS
- 2026-04-23 Price Changed $295,000 Hive MLS
- 2026-02-26 Pending — Hive MLS
- 2026-02-16 Price Changed $284,565 Hive MLS
- 2026-02-15 Listed $319,465 Hive MLS
Cash-flow waterfall
monthlySold comps — $/sqft
last 12 mo · ≤1 miLoading sold comps…