 Multi-family
1089 W Schafer Dr · Flowing Wells, AZ
Flood risk 1/10 · Minimal
- FEMA flood zone
- X (unshaded)
- Chance of flooding over 30 yrs
- 0.0%
- Est. flood insurance / yr
- $507 – $1,088
Fire risk 1/10 · Minimal
- Est. fire insurance / yr
- $610 – $1,132
Heat risk 8/10 · Major
- Hot days now (above 107°F)
- 7 days/yr
- Hot days in 30 yrs
- 19 days/yr
Wind risk 1/10 · Minimal
- Chance of severe wind over 30 yrs
- —
Air-quality risk 1/10 · Minimal
- Unhealthy air days now
- 0 days/yr
- Unhealthy air days in 30 yrs
- 0 days/yr
Risk factors via First Street. Map © Google.
Why this score? — see what drove the C grade
The composite is a weighted blend of 9 inputs, each scored 0–100. Each bar is that input's sub-score; the figure is the points it added to the 100-point composite (weight × sub-score).
- Cash flow +20.5/30.0
- ARV discount +9.6/15.0
- DSCR +6.5/10.0
- 1% rule +5.4/10.0
- Condition / age +3.8/5.0
- Livability +3.7/5.0
- Schools +3.1/10.0
- Rent growth +2.6/5.0
- Appreciation +0.0/10.0
$499,999
🖨 Deal sheet 📄 Offer letter ✓ Due diligence
Multi-family units
County records classify this as Multi-Family (2-4 Unit). Listing-text estimate: 1 unit. estimate disagrees with records
Listing remarks MLS
MOTIVATED SELLER! Exceptional Investment Opportunity - Multi-Unit Property with Strong Rental Potential! Discover this unique income-generating property featuring a spacious manufactured home, a studio apartment, and four one-bedroom, one-bath units—perfect for investors or owner-occupants seeking rental income. Owner/Agent
Key facts
- One-bedroom units
- Studio apartment
- 0.28 acre lot
Tags
Neighborhood map
What this means for you Summary
Snapshot
- This is a 4-bed/4.0-bath multifamily listed at $500k. Condition is rated good.
Deal economics
- At list price, monthly cash flow is $660 ($8k/yr) — positive.
- The deal already cash-flows at list — no discount required.
- Meets the 1% rule at list price ($5k rent vs $500k).
- Recommended offer: $440k (12.0% below list) — sets the bar for market timing.
- Cap rate 7.9% vs local median 6.1% in Flowing Wells — meaningfully above typical; check what's discounted (condition, days-on-market, listing class) to confirm the premium yield is real.
Location & tenants
- Location reads 73/100 on livability (#21 in AZ) — a middle-class / working-renter tenant base. Strengths: commute A+, cost of living A+, health & safety A+; Watch: schools D+, crime F, amenities F.
- Amphitheater Unified District (4406) (suburban): math 32% / reading 40% proficiency, ranked #85 of 249 in AZ (top 34%) — families likely to look elsewhere, expect single-tenant / working-renter base with shorter leases.
- Market conditions: Rents flat; 177 active listings in the ZIP; lower-income renter base — watch delinquency; 5,268 units permitted in Pima County in 2024 (996 in 5+ unit buildings).
- At $5,209/mo this rent would consume 168% of the median local household income ($37k/yr) (locally 4240% of renters already pay >50% of income on rent) — very limited rent-growth headroom before tenants either downsize or default.
Forward outlook
- Local home prices are declining (-3.0%/yr); year-one equity from $3k of loan paydown is wiped out by about $15k of value loss. Plan a longer hold.
- Pima County population projected at +8% by 2050 — modest demand growth; plan on rents tracking national, not racing it.
Negotiation context
- It's been on market 217 days — a 12% lower offer ($440k) is reasonable based on typical stale-listing flexibility.
- 5 sale attempts since 29y ago; this cycle's ask has dropped $99k (17%) from the opening price — seller is motivated, your offer sets the floor, not the list.
Risks & watch-outs
- Climate carrying-cost: extreme-heat days projected 7→19/yr by 2055 (HVAC capex compounding) — expect insurance premiums to compound above CPI over the hold.
Questions for the listing agent
- It's been on market 217 days. Have you received any prior offers? Is the seller open to a 12% concession, seller financing, or rate buy-down credit?
- Built in 1964 — when were the roof, HVAC, electrical panel, plumbing, and water heater last replaced?
- Why hasn't it sold? Are there any deal-killer items the seller is aware of (foundation, flood, title, zoning, code violations)?
- Is there a deadline driving the sale (1031 exchange, divorce, estate, relocation)? That informs how much negotiation room exists.
- Schools are D-rated, which usually means shorter tenancies and higher turnover. Who's the typical renter profile here, and what's been the actual vacancy rate?
- Crime grade is F in this area — have there been break-ins, vandalism, or insurance claims at this property in the last 3 years? What carrier currently insures it and at what premium?
- What's the average days-on-market for RENTAL listings here right now (not sales)? A rising rental-DOM trend means longer vacancies and softer asking-rent achievability than the comps imply.
- What's the recent tenant-quality profile in this submarket — average credit score on applications, eviction rate, late-payment / NSF rate, and stable-employment percentage? A property-management company in the area should have these aggregated.
- How much new apartment / multifamily construction is in the pipeline within 1–3 miles? Heavy new supply (>2% of stock underway) typically softens rents 12–24 months out; light construction supports rent growth.
Investment metrics
- 1% rule
- 1.04% ✓
- Cap rate
- 7.88%
- Cash-on-cash
- 5.65%
- DSCR
- 1.25
- GRM
- 8.0
CMA / ARV
- ARV (median comp)
- $523,976
- List price
- $499,999
- Delta
- -4.58%
- Verdict
- FAIR
- Comps
- 3 within 1.0 mi
Projected returns pro-forma
-3.0% appreciation · 0.3% rent growth · sell at horizon
- IRR
- -10.6%
- Equity multiple
- 0.62×
- Total profit
- $-52,704
- Equity at exit
- $74,551
- IRR
- -5.6%
- Equity multiple
- 0.68×
- Total profit
- $-45,038
- Equity at exit
- $43,231
Cash invested: $140,000 (down + closing). Projections, not guarantees.
Landlord ↔ Tenant lean methodology
- Overall (STATE)
- 87 Strongly Landlord-Friendly
- State Arizona
- 87 Strongly Landlord-Friendly · R+3
- County
- — inherits STATE
- City
- — inherits STATE
ZIP-level market 85705
- Rents YoY
- 0.3%
- Active inventory
- 177
- Price-to-rent
- 40.4×
Monthly cashflow live
- Estimated rent
- $5,209 high interval (Pro) →
- Mortgage (P&I)
- −$2,622
- Tax est. 1.5%
- −$625 /mo · $7,500/yr
- Insurance
- −$208
- HOA
- −$0
- Vacancy / Maint / Mgmt
- −$1,094
- Net cashflow
- $660
Break-even live
5-unit breakdown (identical units grouped — click to expand)
| Units | Beds | Baths | Est. rent |
|---|---|---|---|
| 4× units | 1 | 1 | $4,128 |
| #1 | 1 | 1 | $1,032 |
| #2 | 1 | 1 | $1,032 |
| #3 | 1 | 1 | $1,032 |
| #4 | 1 | 1 | $1,032 |
| 1× unit | 0 | 1 | $1,079 |
| Total (5 units) | $5,209 | ||
UW: 25.0% down · 7.5% · 30yr · 1.5% tax · 5.0% vac · 8.0% maint · 8.0% mgmt
Financing live
Cash to close
- Down payment
- $125,000
- Closing costs
- $15,000
- Reserves months
- —
- Total cash needed
- —
Loan-product check · same deal, 3 products live
Conventional
25% down · 7.5% · 30yr
- Down + closing
- —
- Monthly P&I
- —
- Monthly cashflow
- —
- DSCR
- —
- Eligible?
- —
Personal DTI + credit; lowest rate.
DSCR
20% down · 8.5% · 30yr
- Down + closing
- —
- Monthly P&I
- —
- Monthly cashflow
- —
- DSCR
- —
- Eligible?
- —
No personal income docs; deal must DSCR.
Hard money
10% down · 12.0% · 12mo
- Down + closing
- —
- Monthly P&I
- —
- Monthly cashflow
- —
- DSCR
- —
- Eligible?
- —
Short-term bridge; refi at stabilization.
Listing history 25 events
-
2026-06-18days on market $499,999 Active 217 DOM
-
2026-06-17days on market $499,999 Active 216 DOM
-
2026-06-16days on market $499,999 Active 215 DOM
-
2026-06-15days on market $499,999 Active 214 DOM
-
2026-06-13days on market $499,999 Active 212 DOM
-
2026-06-10days on market $499,999 Active 209 DOM
-
2026-06-09days on market $499,999 Active 208 DOM
-
2026-06-08days on market $499,999 Active 207 DOM
-
2026-06-07days on market $499,999 Active 206 DOM
-
2026-06-05days on market $499,999 Active 203 DOM
-
2026-06-03days on market $499,999 Active 202 DOM
-
2026-06-02days on market $499,999 Active 201 DOM
-
2026-06-01days on market $499,999 Active 200 DOM
-
2026-05-31days on market $499,999 Active 199 DOM
-
2026-04-06price $499,999 331-char remark
Show marketing remark (331 chars)
MOTIVATED SELLER! Exceptional Investment Opportunity - Multi-Unit Property with Strong Rental Potential! Discover this unique income-generating property featuring a spacious manufactured home, a studio apartment, and four one-bedroom, one-bath units—perfect for investors or owner-occupants seeking rental income. Owner/Agent
-
2025-12-04price $550,000 331-char remark
Show marketing remark (331 chars)
MOTIVATED SELLER! Exceptional Investment Opportunity - Multi-Unit Property with Strong Rental Potential! Discover this unique income-generating property featuring a spacious manufactured home, a studio apartment, and four one-bedroom, one-bath units—perfect for investors or owner-occupants seeking rental income. Owner/Agent
-
2025-11-13$599,000 Active 331-char remark
Show marketing remark (331 chars)
MOTIVATED SELLER! Exceptional Investment Opportunity - Multi-Unit Property with Strong Rental Potential! Discover this unique income-generating property featuring a spacious manufactured home, a studio apartment, and four one-bedroom, one-bath units—perfect for investors or owner-occupants seeking rental income. Owner/Agent
-
2005-10-31historical
-
2005-04-14$370,000
-
2002-10-02historical
-
2002-07-07$299,900
-
2002-02-01historical
-
2002-02-01historical
-
2000-06-16$199,000
-
1997-04-06$295,000
ⓘ Source: listings_history table (triggers on properties + properties_extension) + one-shot
backfill from property_details.listing_events for pre-trigger history.
Climate risk First Street
- Flood 1/10 Low FEMA zone X (unshaded) · 0% chance over 30 yrs
- Wildfire 1/10 Low
- Heat 8/10 Severe 7 d/yr ≥107°F today · 19 d/yr by 30 yrs out
- Wind 1/10 Low
- Air quality 1/10 Low 0 unhealthy d/yr today · 0 by 30 yrs out
Nearby sold comps map
Loading sold comps map…
Walkable amenities ~0.75 mi
Loading nearby amenities…
Taxation est. · year 1
- Rental income
- $62,508
- − Mortgage interest
- −$28,008
- − Property taxes
- −$7,500
- − Insurance
- −$2,500
- − Repairs & maintenance
- −$5,001
- − Management
- −$5,001
- − Depreciation
- −$14,545
- Taxable loss
- −$46
- Est. tax savings @ 24.0%
- +$11
- After-tax cash flow
- $7,928/yr
For passive investors: Depreciation is non-cash, so a rental often shows a tax loss while cash-flowing — sheltering income. Rental losses are passive: they offset passive income freely, and up to $25,000/yr can offset ordinary (W-2) income if you actively participate and your MAGI is under $100k (phasing out to $0 by $150k); unused losses carry forward. On sale, claimed depreciation is recaptured at up to 25%, and gains may owe capital-gains tax (a 1031 exchange can defer both). Figures are a year-1 estimate at your 24.0% rate — not tax advice; consult a CPA.
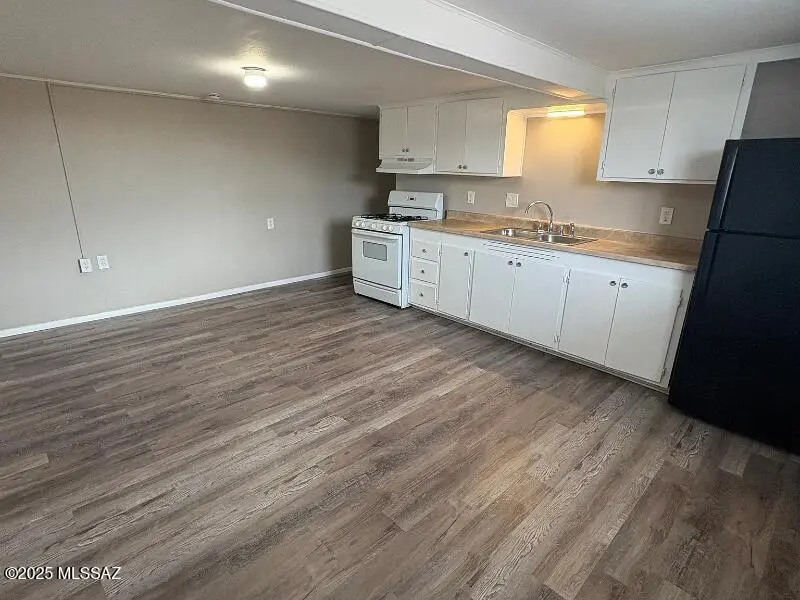
Condition & rehab AI · 7 photos
This multi-family property is in good condition with recent cosmetic updates, making it a strong investment opportunity for rental income.
Value-add opportunities
- Both Paint touch-ups — Enhances curb appeal and interior aesthetics.
- Both Clean air conditioning unit — Improves comfort and energy efficiency for tenants.
- Both Add smart home features — Attracts tech-savvy tenants and enhances property value.
- Both Landscaping improvements — Enhances curb appeal and creates a more inviting atmosphere.
Renovation cost estimate screening
Value-add ROI direction
- Both Paint touch-ups — Enhances curb appeal and interior aesthetics. ↑
- Both Clean air conditioning unit — Improves comfort and energy efficiency for tenants. ↑
- Both Add smart home features — Attracts tech-savvy tenants and enhances property value. ↑
- Both Landscaping improvements — Enhances curb appeal and creates a more inviting atmosphere. ↑
ⓘ Cost ranges are severity-bucket heuristics (US national rule-of-thumb). Get contractor quotes + a written scope before underwriting a rehab budget.
Schools (NCES district)
- District
- Amphitheater Unified District (4406)
- NCES district ID
- 0400680
- Math proficiency
- 32% ▼ -13.00%
- Reading proficiency
- 40% ▼ -8.00%
- Median HH income
- $46,524
- Composite
- 30.82/100
- National rank
- #6135
- State rank
- #85 of 249 in AZ
Livability — Flowing Wells
- Score
- 73/100
- State rank
- #21
- US rank
- #5288
Category grades
Schools grade is shown separately in the Schools card above.
Census & demographics
- Census place
- Flowing Wells, AZ
- County
- Pima County · 1,012,107 people
- Metro
- Tucson, AZ
- Population (ZIP)
- 54,700
- Household income
- $37,194
- Rent vs Own
- Severe rent burden
- 4240.0
Population outlook (Pima County) Hauer SSP2
- Today (2025)
- 1,066,056 people
- By 2030
- 1,086,684 · +1.9%
- By 2040
- 1,117,160 · +4.8%
- By 2050
- 1,149,778 · +7.9%
- By 2075
- 1,271,480 · +19.3%
- By 2100
- 1,321,160 · +23.9%
Race, ethnicity, and origin ACS 2023
- Neighborhood character
- Diverse neighborhood (Simpson 0.63)
- Race & ethnicity
- Hispanic / Latino 45% White 41% Two or more races 18% Asian 4% Black 3% Native American 3%
- Hispanic origin (detail)
- Mexican 41%
- Common ancestry
- Portuguese 2% Romanian 2% Lithuanian 2%
- Foreign-born
- 18% · Canada, China, Vietnam
- Languages at home
- 65% English-only · Spanish 30% Chinese 1% Vietnamese 1%
Political lean MEDSL · Pima
- 2024 margin
- D (+15.2) · D 57.0% · R 41.8% · Other 1.2%
- 2008→2024 swing
- +9.1pp toward D · 2008: 6.1pp · 2024: 15.2pp
- All cycles
- 2024: D+15.2 2020: D+18.7 2016: D+13.5 2012: D+5.8 2008: D+6.1
Not yet ingested
- Civics
- —
Market trends
- HPI YoY
- ▼ -163.31%
- Current HPI
- 283.0647
- Rent YoY
- ▲ 0.30%
- Metro
- Tucson, AZ
- State GDP YoY
- ▲ 4.54%
- F500 in state
- 20
Industry mix (Fortune 500 HQ in AZ)
| Industry | F500 HQs | Revenue |
|---|---|---|
| Technology | 2 | $13B |
|
||
| Mining / Metals | 1 | $23B |
|
||
| Environmental Services | 1 | $16B |
|
||
| Metals / Steel | 1 | $14B |
|
||
| Technology Distribution | 1 | $9B |
|
||
| Homebuilding | 1 | $8B |
|
||
Price history
+69.5% since first listed11 events — show timeline
- 2026-04-06 Price Changed $499,999 MLSSAZ
- 2025-12-04 Price Changed $550,000 MLSSAZ
- 2025-11-13 Listed $599,000 MLSSAZ
- 2005-10-31 Listing Removed — MLSSAZ
- 2005-04-14 Listed $370,000 MLSSAZ
- 2002-10-02 Listing Removed — MLSSAZ
- 2002-07-07 Listed $299,900 MLSSAZ
- 2002-02-01 Listing Removed — MLSSAZ
- 2002-02-01 Listing Removed — MLSSAZ
- 2000-06-16 Listed $199,000 MLSSAZ
- 1997-04-06 Listed $295,000 MLSSAZ
Cash-flow waterfall
monthlySold comps — $/sqft
last 12 mo · ≤1 miLoading sold comps…