 Duplex
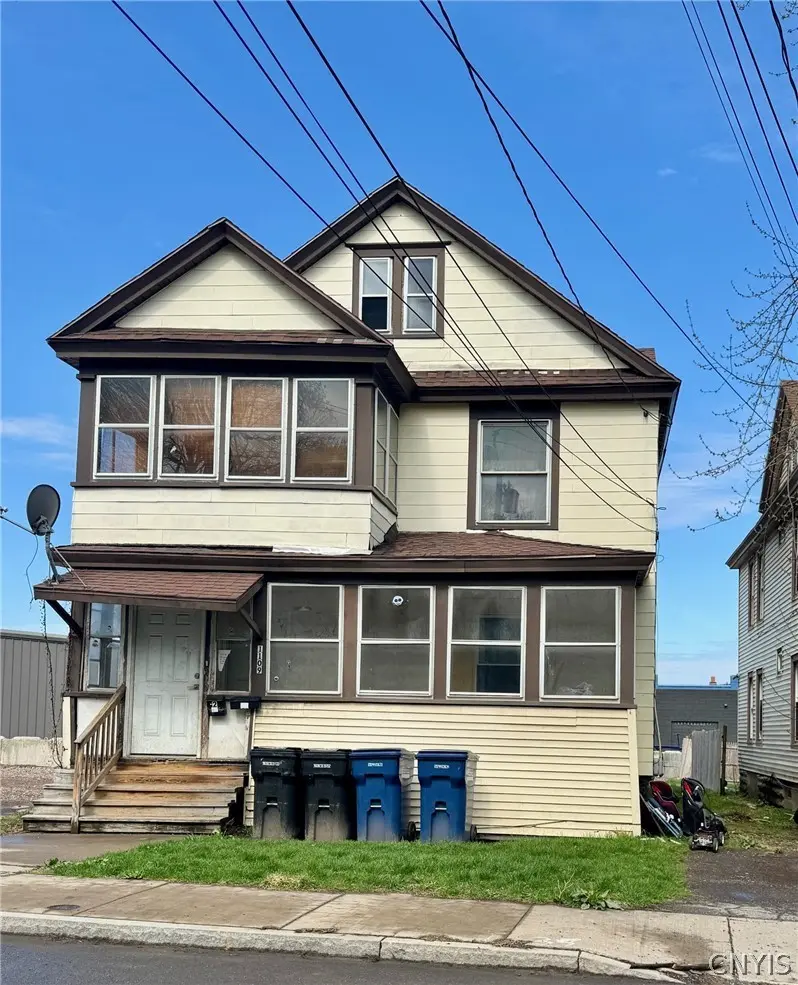
1109 Wolf St · Syracuse, NY
Flood risk 1/10 · Minimal
- FEMA flood zone
- X (unshaded)
- Chance of flooding over 30 yrs
- 0.0%
- Est. flood insurance / yr
- $473 – $860
Fire risk 1/10 · Minimal
- Est. fire insurance / yr
- $691 – $1,283
Heat risk 3/10 · Minor
- Hot days now (above 95°F)
- 7 days/yr
- Hot days in 30 yrs
- 16 days/yr
Wind risk 1/10 · Minimal
- Chance of severe wind over 30 yrs
- 0.0%
Air-quality risk 2/10 · Minimal
- Unhealthy air days now
- 0 days/yr
- Unhealthy air days in 30 yrs
- 1 days/yr
Risk factors via First Street. Map © Google.
Why this score? — see what drove the B grade
The composite is a weighted blend of 9 inputs, each scored 0–100. Each bar is that input's sub-score; the figure is the points it added to the 100-point composite (weight × sub-score).
- Cash flow +26.0/30.0
- Appreciation +10.0/10.0
- ARV discount +9.6/15.0
- DSCR +8.8/10.0
- 1% rule +5.8/10.0
- Livability +3.9/5.0
- Rent growth +2.5/5.0
- Condition / age +2.5/5.0
- Schools +1.8/10.0
$280,000
🖨 Deal sheet 📄 Offer letter ✓ Due diligence
Multi-family units
County records classify this as Multi-Family (2-4 Unit). Listing-text estimate: 2 units. confirmed
Listing remarks MLS
North Side Syracuse Two-Family. Excellent Cap Rate. The numbers do the talking here. Two units at $1,660/month each, tenants pay their own utilities keeping expenses in check. Hardwood floors throughout. Low-maintenance and income-producing.
Key facts
- Income-producing
- North side syracuse
- Two-family
Tags
Neighborhood map
What this means for you Summary
Snapshot
- This is a 2 × 3-bed/1.0-bath units multifamily listed at $280k.
Deal economics
- At list price, monthly cash flow is $698 ($8k/yr) — positive. Per door: $349/mo.
- The deal already cash-flows at list — no discount required.
- Meets the 1% rule at list price ($3k rent vs $280k).
- Recommended offer: $272k (3.0% below list) — sets the bar for market timing.
Location & tenants
- Location reads 77/100 on livability (#187 in NY, #2,869 nationally) — a middle-class / working-renter tenant base. Strengths: amenities A+, commute A+, cost of living A+; Watch: schools D+, crime F, employment D-.
- Syracuse City School District (urban): math 18% / reading 26% proficiency, ranked #590 of 590 in NY (top 100%) — low school quality limits family demand, transient renter base, plan for 1-2y turnover; 74% free/reduced lunch — lower-income household profile, screen leases tightly.
- Market conditions: 99 active listings in the ZIP; lower-income renter base — watch delinquency; 616 units permitted in Onondaga County in 2024 (256 in 5+ unit buildings).
- At $3,023/mo this rent would consume 81% of the median local household income ($45k/yr) (locally 1437% of renters already pay >50% of income on rent) — very limited rent-growth headroom before tenants either downsize or default.
Forward outlook
- In year one you build about $30k of equity ($2k loan paydown + $28k appreciation (10.0% local appreciation)).
- Onondaga County population projected to shrink 9% by 2050 — rents likely to lag national; underwrite the cash flow, not the appreciation.
- At projected returns (10.0% appreciation + 3.0% rent growth), your $78k cash investment doubles in ~2 years — after that, you're playing with house money.
- By year 2, paydown + projected appreciation supports a ~$48k cash-out refi (75% LTV) — recoverable capital for the next deal without selling this one.
Negotiation context
- It's been on market 60 days — a 3% lower offer ($272k) is reasonable based on typical stale-listing flexibility.
- 3 sale attempts since 16y ago; this cycle's ask is 30% above the opening price — seller raised mid-cycle; expect resistance to lowballs.
- Current owner paid $66k; list at $280k implies a 326% gain — meaningful room to come down on a strong offer.
Risks & watch-outs
- Watch-outs: built in 1900 — expect roof / HVAC / electrical / plumbing capex.
Questions for the listing agent
- It's been on market 60 days. Have you received any prior offers? Is the seller open to a 3% concession, seller financing, or rate buy-down credit?
- Can we see the unit-by-unit rent roll, current vacancy, and any below-market leases? What's the average tenancy length?
- What capital expenditures (roof, boiler, parking lot, exteriors) have been made in the last 5 years, and what's planned in the next 2?
- Built in 1900 — when were the roof, HVAC, electrical panel, plumbing, and water heater last replaced?
- Is there a deadline driving the sale (1031 exchange, divorce, estate, relocation)? That informs how much negotiation room exists.
- Schools are D-rated, which usually means shorter tenancies and higher turnover. Who's the typical renter profile here, and what's been the actual vacancy rate?
- Crime grade is F in this area — have there been break-ins, vandalism, or insurance claims at this property in the last 3 years? What carrier currently insures it and at what premium?
- What's the average days-on-market for RENTAL listings here right now (not sales)? A rising rental-DOM trend means longer vacancies and softer asking-rent achievability than the comps imply.
- What's the recent tenant-quality profile in this submarket — average credit score on applications, eviction rate, late-payment / NSF rate, and stable-employment percentage? A property-management company in the area should have these aggregated.
- How much new apartment / multifamily construction is in the pipeline within 1–3 miles? Heavy new supply (>2% of stock underway) typically softens rents 12–24 months out; light construction supports rent growth.
Investment metrics
- 1% rule
- 1.08% ✓
- Cap rate
- 9.28%
- Cash-on-cash
- 10.68%
- DSCR
- 1.48
- GRM
- 7.7
CMA / ARV
- ARV (median comp)
- $293,628
- List price
- $280,000
- Delta
- -4.64%
- Verdict
- FAIR
- Comps
- 20 within 1.0 mi
Show comp detail 11 sales within ~0.75 mi
| Address | Dist | Beds/Ba | Sqft | Sold | Price | $/sf | Match |
|---|---|---|---|---|---|---|---|
| 1203-05 Court St | 0.46mi | 5/2.0 (-1) | 2,544 (+2%) | 10mo | $275,000 | $108 | 62 |
| 2725 Grant Blvd #27 | 0.45mi | 6/2.0 | 2,320 (-7%) | 8mo | $265,500 | $114 | 61 |
| 124 7th North St #26 | 0.44mi | 6/2.0 | 2,704 (+8%) | 7mo | $235,000 | $87 | 60 |
| 110 Murray Ave | 0.30mi | 6/2.0 | 2,796 (+12%) | 21mo | $140,000 | $50 | 49 |
| 958 Lemoyne Ave | 0.23mi | 5/3.0 (-1) | 2,140 (-14%) | 9mo | $220,000 | $103 | 49 |
| 114 Burdick Ave | 0.41mi | 5/2.0 (-1) | 2,356 (-6%) | 22mo | $160,000 | $68 | 48 |
| 177 Kuhl Ave | 0.62mi | 7/2.0 (+1) | 2,776 (+11%) | 3mo | $205,000 | $74 | 45 |
| 1411 Spring St | 0.64mi | 6/3.0 | 2,732 (+9%) | 11mo | $165,000 | $60 | 41 |
| 1705 Court St | 0.64mi | 6/3.0 | 2,650 (+6%) | 21mo | $260,000 | $98 | 39 |
| 401 Lemoyne Ave | 0.74mi | 5/2.0 (-1) | 2,312 (-8%) | 13mo | $169,900 | $73 | 37 |
| 507 - 509 Lemoyne Ave | 0.68mi | 7/2.0 (+1) | 2,834 (+13%) | 17mo | $134,900 | $48 | 27 |
Match score weights: distance 35% · size 25% · config 20% · recency 20%. Top-matched comps best support the ARV.
Projected returns pro-forma
10.0% appreciation · 3.0% rent growth · sell at horizon
- IRR
- 32.1%
- Equity multiple
- 3.51×
- Total profit
- $196,842
- Equity at exit
- $252,246
- IRR
- 27.7%
- Equity multiple
- 7.95×
- Total profit
- $544,502
- Equity at exit
- $543,978
Cash invested: $78,400 (down + closing). Projections, not guarantees.
Landlord ↔ Tenant lean methodology
- Overall (STATE)
- 15 Strongly Tenant-Friendly
- State New York
- 15 Strongly Tenant-Friendly · D+10
- County
- — inherits STATE
- City
- — inherits STATE
ZIP-level market 13208
- Home prices YoY
- 8.4%
- Active inventory
- 99
- Price-to-rent
- 15.4×
Monthly cashflow live
- Estimated rent
- $3,023 high interval (Pro) →
- Mortgage (P&I)
- −$1,468
- Tax from tax record
- −$105 /mo · $1,263/yr
- Insurance
- −$117
- HOA
- −$0
- Vacancy / Maint / Mgmt
- −$635
- Net cashflow
- $698
Break-even live
2-unit breakdown (identical units grouped — click to expand)
| Units | Beds | Baths | Est. rent |
|---|---|---|---|
| 2× units | 3 | 1 | $3,022 |
| #1 | 3 | 1 | $1,511 |
| #2 | 3 | 1 | $1,511 |
| Total (2 units) | $3,023 | ||
UW: 25.0% down · 7.5% · 30yr · 1.5% tax · 5.0% vac · 8.0% maint · 8.0% mgmt
Financing live
Cash to close
- Down payment
- $70,000
- Closing costs
- $8,400
- Reserves months
- —
- Total cash needed
- —
Loan-product check · same deal, 3 products live
Conventional
25% down · 7.5% · 30yr
- Down + closing
- —
- Monthly P&I
- —
- Monthly cashflow
- —
- DSCR
- —
- Eligible?
- —
Personal DTI + credit; lowest rate.
DSCR
20% down · 8.5% · 30yr
- Down + closing
- —
- Monthly P&I
- —
- Monthly cashflow
- —
- DSCR
- —
- Eligible?
- —
No personal income docs; deal must DSCR.
Hard money
10% down · 12.0% · 12mo
- Down + closing
- —
- Monthly P&I
- —
- Monthly cashflow
- —
- DSCR
- —
- Eligible?
- —
Short-term bridge; refi at stabilization.
Listing history 24 events
-
2026-06-18days on market $280,000 Active 60 DOM
-
2026-06-17days on market $280,000 Active 59 DOM
-
2026-06-16days on market $280,000 Active 58 DOM
-
2026-06-15days on market $280,000 Active 57 DOM
-
2026-06-14days on market $280,000 Active 55 DOM
-
2026-06-13days on market $280,000 Active 54 DOM
-
2026-06-10days on market $280,000 Active 52 DOM
-
2026-06-09days on market $280,000 Active 51 DOM
-
2026-06-08days on market $280,000 Active 50 DOM
-
2026-06-07days on market $280,000 Active 49 DOM
-
2026-06-05days on market $280,000 Active 46 DOM
-
2026-06-02days on market $280,000 Active 44 DOM
-
2026-06-01days on market $280,000 Active 43 DOM
-
2026-05-31days on market $280,000 Active 42 DOM
-
2026-05-30days on market $280,000 Active 41 DOM
-
2026-04-19$214,900 Active 241-char remark
Show marketing remark (241 chars)
North Side Syracuse Two-Family. Excellent Cap Rate. The numbers do the talking here. Two units at $1,660/month each, tenants pay their own utilities keeping expenses in check. Hardwood floors throughout. Low-maintenance and income-producing.
-
2022-02-20price $1,100
-
2021-04-07historical
-
2021-02-07$115,000 Active
-
2011-04-01historical
-
2011-03-30soldstatus $65,700
-
2011-03-24soldstatus $65,700
-
2010-07-24$69,900
-
2002-02-06soldstatus $19,500
ⓘ Source: listings_history table (triggers on properties + properties_extension) + one-shot
backfill from property_details.listing_events for pre-trigger history.
Tax reassessment forecast NY · Partial reset (capped growth)
- Current annual tax
- $1,263 · $105/mo
- Projected year-2 tax
- $2,997 · $250/mo
- Expected delta
- +$1,735/yr (+$145/mo · 137.4%)
ⓘ Screening estimate from a state-policy table — verify with the county assessor before closing.
Climate risk First Street
- Flood 1/10 Low FEMA zone X (unshaded) · 0% chance over 30 yrs
- Wildfire 1/10 Low
- Heat 3/10 Moderate 7 d/yr ≥95°F today · 16 d/yr by 30 yrs out
- Wind 1/10 Low 0% chance of damaging wind over 30 yrs
- Air quality 2/10 Low 0 unhealthy d/yr today · 1 by 30 yrs out
Nearby sold comps map
Loading sold comps map…
Walkable amenities ~0.75 mi
Loading nearby amenities…
Taxation est. · year 1
- Rental income
- $36,276
- − Mortgage interest
- −$15,684
- − Property taxes
- −$1,263
- − Insurance
- −$1,400
- − Repairs & maintenance
- −$2,902
- − Management
- −$2,902
- − Depreciation
- −$8,145
- Taxable income
- $3,979
- Est. tax owed @ 24.0%
- −$955
- After-tax cash flow
- $7,420/yr
For passive investors: Depreciation is non-cash, so a rental often shows a tax loss while cash-flowing — sheltering income. Rental losses are passive: they offset passive income freely, and up to $25,000/yr can offset ordinary (W-2) income if you actively participate and your MAGI is under $100k (phasing out to $0 by $150k); unused losses carry forward. On sale, claimed depreciation is recaptured at up to 25%, and gains may owe capital-gains tax (a 1031 exchange can defer both). Figures are a year-1 estimate at your 24.0% rate — not tax advice; consult a CPA.
Schools (NCES district)
- District
- Syracuse City School District
- NCES district ID
- 3628590
- Math proficiency
- 18% ▼ -5.00%
- Reading proficiency
- 26% ▬ 0.00%
- Median HH income
- $32,097
- Composite
- 17.83/100
- National rank
- #9007
- State rank
- #590 of 590 in NY
Livability — Syracuse
- Score
- 77/100
- State rank
- #187
- US rank
- #2869
Category grades
Schools grade is shown separately in the Schools card above.
Census & demographics
- Census place
- Syracuse, NY
- County
- Onondaga County · 247,257 people
- City population
- 152,627
- Metro
- Syracuse, NY
- Population (ZIP)
- 22,993
- Household income
- $44,712
- Rent vs Own
- Severe rent burden
- 1437.0
Population outlook (Onondaga County) Hauer SSP2
- Today (2025)
- 467,894 people
- By 2030
- 463,381 · -1.0%
- By 2040
- 447,697 · -4.3%
- By 2050
- 426,399 · -8.9%
- By 2075
- 373,661 · -20.1%
- By 2100
- 307,967 · -34.2%
Race, ethnicity, and origin ACS 2023
- Neighborhood character
- Highly diverse neighborhood (Simpson 0.70)
- Race & ethnicity
- White 46% Black 24% Asian 14% Two or more races 10% Hispanic / Latino 6%
- Hispanic origin (detail)
- Puerto Rican 4% Dominican 1%
- Common ancestry
- Romanian 3% Swedish 3% Italian 1%
- Foreign-born
- 22% · Vietnam, Philippines, Canada
- Languages at home
- 70% English-only · Spanish 6% Other Asian/Pacific 5% Vietnamese 4%
Political lean MEDSL · Onondaga
- 2024 margin
- D (+17.3) · D 58.6% · R 41.4%
- 2008→2024 swing
- -3.0pp toward R · 2008: 20.3pp · 2024: 17.3pp
- All cycles
- 2024: D+17.3 2020: D+20.6 2016: D+12.8 2012: D+21.1 2008: D+20.3
Not yet ingested
- Civics
- —
Market trends
- HPI YoY
- ▲ 30.91%
- Current HPI
- 399.3284
- Rent YoY
- —
- Metro
- Syracuse, NY
- State GDP YoY
- ▲ 2.60%
- F500 in state
- 92
Industry mix (Fortune 500 HQ in NY)
| Industry | F500 HQs | Revenue |
|---|---|---|
| Financial Services | 10 | $950B |
|
||
| Consumer Goods | 9 | $162B |
|
||
| Insurance | 4 | $225B |
|
||
| Telecommunications | 2 | $144B |
|
||
| Pharmaceuticals | 2 | $112B |
|
||
| Media / Entertainment | 2 | $69B |
|
||
Price history
+1002.1% since first listed9 events — show timeline
- 2026-04-19 Listed $214,900 CNYIS
- 2022-02-20 Price Changed $1,100 RENT.
- 2021-04-07 Listing Removed — CNYIS
- 2021-02-07 Listed $115,000 CNYIS
- 2011-04-01 Listing Removed — CNYIS
- 2011-03-30 Sold (MLS) $65,700 CNYIS
- 2011-03-24 Sold (Public Records) $65,700 Public Records
- 2010-07-24 Listed $69,900 CNYIS
- 2002-02-06 Sold (Public Records) $19,500 Public Records
Property tax history
+0.2%/yrLatest (2025): $1,263 · +0.0% YoY. Source: county tax records.
Cash-flow waterfall
monthlySold comps — $/sqft
last 12 mo · ≤1 miLoading sold comps…