18 Highpoint Dr · The Hideout, PA
Flood risk 1/10 · Minimal
- FEMA flood zone
- X (unshaded)
- Chance of flooding over 30 yrs
- 0.0%
- Est. flood insurance / yr
- $507 – $1,088
Fire risk 1/10 · Minimal
- Est. fire insurance / yr
- $511 – $949
Heat risk 2/10 · Minimal
- Hot days now (above 90°F)
- 7 days/yr
- Hot days in 30 yrs
- 16 days/yr
Wind risk 2/10 · Minimal
- Chance of severe wind over 30 yrs
- 3.0%
Air-quality risk 2/10 · Minimal
- Unhealthy air days now
- 1 days/yr
- Unhealthy air days in 30 yrs
- 2 days/yr
Risk factors via First Street. Map © Google.
Why this score? — see what drove the C grade
The composite is a weighted blend of 9 inputs, each scored 0–100. Each bar is that input's sub-score; the figure is the points it added to the 100-point composite (weight × sub-score).
- Cash flow +21.3/30.0
- Appreciation +10.0/10.0
- DSCR +6.8/10.0
- 1% rule +5.9/10.0
- Schools +4.4/10.0
- Livability +3.6/5.0
- Rent growth +2.5/5.0
- Condition / age +2.5/5.0
- ARV discount +1.4/15.0
$265,000
🖨 Deal sheet 📄 Offer letter ✓ Due diligence
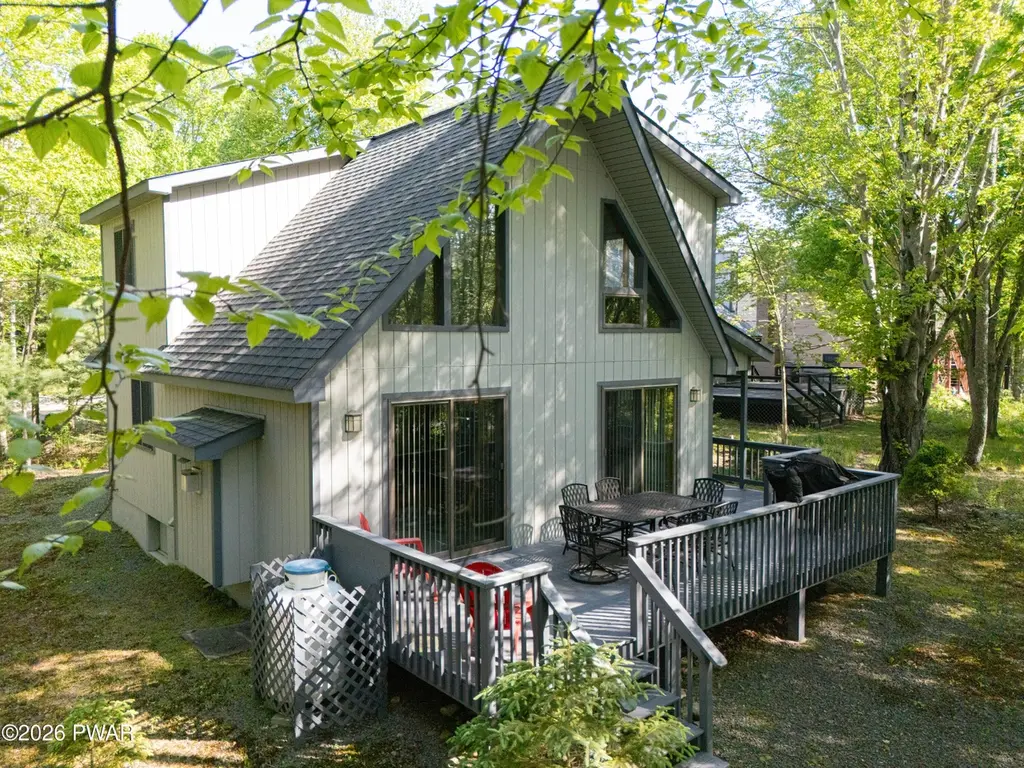
Listing remarks
Meticulously maintained chalet-style home in the heart of the Poconos! This bright and inviting home offers a spacious open floor plan with warm chalet charm and plenty of natural light throughout. Pride of ownership is evident inside and out, making this property truly move-in ready. Great location close to the North Beach for easy access to summer fun and lake enjoyment! Located in the amenity-filled gated recreational community of The Hideout featuring lakes, pools, beaches, golf course, ski hill, bar, restaurant, fitness center, and tiki bar. Whether you're looking for a full-time home, vacation getaway, or investment property, this Pocono retreat is ready to enjoy!
Key facts
- Open floor plan
- Great location
- Natural light
Tags
Property features AI
Finance
- Other: Located in The Hideout community; community features include clubhouse, restaurant, pool, playground, park, lake, golf, fitness center, and fishing
- HOA & community: Homeowners association with annual fee (amount disclosed but excluded per instructions); Association amenities include: basketball court, trails, ski access, tennis courts, seasonal stream and pond, powered boats allowed, recreation facilities, pool, picnic area, playground, marina, park, golf course, jogging path, exterior and interior game courts, gated access, game room, fitness center, dog park, clubhouse, beach rights and access
Exterior
- Parking: Driveway (gravel)
- Security: Located in a gated community
- Utilities: Public sewer
- Home design: Single family residence; Two levels
- Construction: Asphalt roof
- Exterior features: Deck; Side porch; Wrap-around porch; Few trees on the lot; Views and access to Roamingwood Lake; Paved private road with private maintenance
Interior
- Kitchen: Dishwasher; Electric oven; Refrigerator
- Bedrooms: Total of 7 rooms (bedroom count not specified)
- Flooring: Carpet; Vinyl
- Bathrooms: 2 full bathrooms
- Heating & cooling: Baseboard heating (electric); Ceiling fan(s) for cooling
- Interior features: High ceilings; Open floor plan; Crawl space basement; Has fireplace (living room, propane)
- Laundry & utility: Washer; Dryer; Laundry room and laundry closet on the main level
Neighborhood map
What this means for you Summary
Snapshot
- This is a 3-bed/2.0-bath single-family listed at $265k.
Deal economics
- At list price, monthly cash flow is $387 ($5k/yr) — positive.
- The deal already cash-flows at list — no discount required.
- Meets the 1% rule at list price ($3k rent vs $265k).
- Cap rate 8.0% vs local median 5.0% in The Hideout — top-decile yield for the area; either an underpriced asset or a hidden risk that comps aren't pricing in. Stress-test before assuming the spread holds.
Location & tenants
- Location reads 72/100 on livability (#668 in PA) — a middle-class / working-renter tenant base. Strengths: crime A+, employment A+, cost of living A+; Watch: schools D, amenities F, commute F.
- Western Wayne SD (rural): math 39% / reading 63% proficiency, ranked #165 of 539 in PA (top 31%) — acceptable for families but not a draw, mixed tenant base, ~2y average lease.
- Market conditions: 337 active listings in the ZIP; 1 comparable units currently listed for rent nearby; 177 units permitted in Wayne County in 2024 (0 in 5+ unit buildings).
Forward outlook
- In year one you build about $28k of equity ($2k loan paydown + $26k appreciation (10.0% local appreciation)).
- Wayne County population projected at -17% by 2050 — secular population decline; favor cash flow + early exit over multi-decade hold.
- At projected returns (10.0% appreciation + 3.0% rent growth), your $74k cash investment doubles in ~3 years — after that, you're playing with house money.
- By year 2, paydown + projected appreciation supports a ~$46k cash-out refi (75% LTV) — recoverable capital for the next deal without selling this one.
Negotiation context
- Only 9 days on market — expect competitive offers; lowballing is unlikely to land.
- Current owner paid $26k; list at $265k implies a 923% gain — meaningful room to come down on a strong offer.
Questions for the listing agent
- What does the HOA fee cover, when was the last increase, and are there any pending special assessments or reserve-fund shortfalls?
- Is there a deadline driving the sale (1031 exchange, divorce, estate, relocation)? That informs how much negotiation room exists.
- Schools are D-rated, which usually means shorter tenancies and higher turnover. Who's the typical renter profile here, and what's been the actual vacancy rate?
- What's the average days-on-market for RENTAL listings here right now (not sales)? A rising rental-DOM trend means longer vacancies and softer asking-rent achievability than the comps imply.
- What's the recent tenant-quality profile in this submarket — average credit score on applications, eviction rate, late-payment / NSF rate, and stable-employment percentage? A property-management company in the area should have these aggregated.
- How much new for-sale + rental construction is in the pipeline within 1–3 miles? Heavy new supply typically softens prices + rents 12–24 months out; constrained supply supports both.
Investment metrics
- 1% rule
- 1.09% ✓
- Cap rate
- 8.05%
- Cash-on-cash
- 6.26%
- DSCR
- 1.28
- GRM
- 7.6
CMA / ARV
- ARV (on-the-fly)
- $233,496
- Comps found
- 11
Show comp detail 11 sales within ~0.75 mi
| Address | Dist | Beds/Ba | Sqft | Sold | Price | $/sf | Match |
|---|---|---|---|---|---|---|---|
| 543 Lakeview Dr. Dr E | 0.14mi | 2/1.5 (-1) | 1,280 (+3%) | 3mo | $265,000 | $207 | 79 |
| 543 Lakeview Dr E | 0.14mi | 2/1.5 (-1) | 1,280 (+3%) | 12mo | $265,000 | $207 | 71 |
| 529 Lakeview Dr E | 0.15mi | 4/2.0 (+1) | 1,386 (+12%) | 4mo | $280,000 | $202 | 65 |
| 16 N Gate Ct S | 0.11mi | 2/1.0 (-1) | 1,112 (-10%) | 8mo | $235,000 | $211 | 62 |
| 9 Grandview Dr | 0.52mi | 3/1.5 | 1,282 (+3%) | 13mo | $215,000 | $168 | 58 |
| 37 Glenwood Ln | 0.20mi | 4/2.0 (+1) | 1,398 (+13%) | 15mo | $235,500 | $168 | 53 |
| 8 Boulder Ct | 0.47mi | 2/1.0 (-1) | 1,093 (-12%) | 0mo | $205,000 | $188 | 49 |
| 9 Roamingwood Rd | 0.71mi | 2/2.0 (-1) | 1,342 (+8%) | 6mo | $248,000 | $185 | 44 |
| 642 Lakeview Dr E | 0.59mi | 2/2.0 (-1) | 1,386 (+12%) | 14mo | $218,000 | $157 | 36 |
| 32 Rockway Rd | 0.57mi | 3/2.0 | 1,418 (+14%) | 17mo | $215,000 | $152 | 36 |
| 667 Lakeview Dr E | 0.71mi | 3/2.0 | 1,404 (+13%) | 19mo | $285,000 | $203 | 29 |
Match score weights: distance 35% · size 25% · config 20% · recency 20%. Top-matched comps best support the ARV.
Projected returns pro-forma
10.0% appreciation · 3.0% rent growth · sell at horizon
- IRR
- 28.8%
- Equity multiple
- 3.28×
- Total profit
- $169,058
- Equity at exit
- $238,733
- IRR
- 25.1%
- Equity multiple
- 7.45×
- Total profit
- $478,644
- Equity at exit
- $514,837
Cash invested: $74,200 (down + closing). Projections, not guarantees.
Landlord ↔ Tenant lean methodology
- Overall (STATE)
- 62 Landlord-Friendly
- State Pennsylvania
- 62 Landlord-Friendly · EVEN
- County
- — inherits STATE
- City
- — inherits STATE
ZIP-level market 18436
- Home prices YoY
- 16.9%
- Active inventory
- 337
- Price-to-rent
- 7.6×
Monthly cashflow live
- Estimated rent
- $2,900 medium interval (Pro) →
- Mortgage (P&I)
- −$1,390
- Tax from tax record
- −$215 /mo · $2,580/yr
- Insurance
- −$110
- HOA
- −$189
- Vacancy / Maint / Mgmt
- −$609
- Net cashflow
- $387
Break-even live
UW: 25.0% down · 7.5% · 30yr · 1.5% tax · 5.0% vac · 8.0% maint · 8.0% mgmt
Financing live
Cash to close
- Down payment
- $66,250
- Closing costs
- $7,950
- Reserves months
- —
- Total cash needed
- —
Loan-product check · same deal, 3 products live
Conventional
25% down · 7.5% · 30yr
- Down + closing
- —
- Monthly P&I
- —
- Monthly cashflow
- —
- DSCR
- —
- Eligible?
- —
Personal DTI + credit; lowest rate.
DSCR
20% down · 8.5% · 30yr
- Down + closing
- —
- Monthly P&I
- —
- Monthly cashflow
- —
- DSCR
- —
- Eligible?
- —
No personal income docs; deal must DSCR.
Hard money
10% down · 12.0% · 12mo
- Down + closing
- —
- Monthly P&I
- —
- Monthly cashflow
- —
- DSCR
- —
- Eligible?
- —
Short-term bridge; refi at stabilization.
Rent comps 1 comps
| Address | Beds | Baths | Sqft | Rent | $/sqft | DOM | Units | Dist |
|---|---|---|---|---|---|---|---|---|
| 1148 Golf Park Dr Lake Ariel, PA | 3.0 | 1.0 | 1210 | $2,900 | $2.40 | 24d | 1 | 1.27mi |
HOA detail
- Monthly dues
- $189 · $2,268/yr
- Likely covers
- poolgymsecurity
Listing history 2 events
-
2026-05-18$265,000 Active
-
1987-06-29soldstatus $25,900
ⓘ Source: listings_history table (triggers on properties + properties_extension) + one-shot
backfill from property_details.listing_events for pre-trigger history.
Tax reassessment forecast PA · Partial reset (capped growth)
- Current annual tax
- $2,580 · $215/mo
- Projected year-2 tax
- $3,383 · $282/mo
- Expected delta
- +$804/yr (+$67/mo · 31.2%)
ⓘ Screening estimate from a state-policy table — verify with the county assessor before closing.
Climate risk First Street
- Flood 1/10 Low FEMA zone X (unshaded) · 0% chance over 30 yrs
- Wildfire 1/10 Low
- Heat 2/10 Low 7 d/yr ≥90°F today · 16 d/yr by 30 yrs out
- Wind 2/10 Low 3% chance of damaging wind over 30 yrs
- Air quality 2/10 Low 1 unhealthy d/yr today · 2 by 30 yrs out
Nearby sold comps map
Loading sold comps map…
Walkable amenities ~0.75 mi
Loading nearby amenities…
Taxation est. · year 1
- Rental income
- $34,800
- − Mortgage interest
- −$14,844
- − Property taxes
- −$2,580
- − Insurance
- −$1,325
- − Repairs & maintenance
- −$2,784
- − Management
- −$2,784
- − HOA
- −$2,268
- − Depreciation
- −$7,709
- Taxable income
- $506
- Est. tax owed @ 24.0%
- −$121
- After-tax cash flow
- $4,522/yr
For passive investors: Depreciation is non-cash, so a rental often shows a tax loss while cash-flowing — sheltering income. Rental losses are passive: they offset passive income freely, and up to $25,000/yr can offset ordinary (W-2) income if you actively participate and your MAGI is under $100k (phasing out to $0 by $150k); unused losses carry forward. On sale, claimed depreciation is recaptured at up to 25%, and gains may owe capital-gains tax (a 1031 exchange can defer both). Figures are a year-1 estimate at your 24.0% rate — not tax advice; consult a CPA.
Schools (NCES district)
- District
- Western Wayne SD
- NCES district ID
- 4226070
- Math proficiency
- 39% ▼ -12.00%
- Reading proficiency
- 63% ▼ -6.00%
- Median HH income
- $51,358
- Composite
- 43.65/100
- National rank
- #2964
- State rank
- #165 of 539 in PA
Livability — The Hideout
- Score
- 72/100
- State rank
- #668
- US rank
- #6516
Category grades
Schools grade is shown separately in the Schools card above.
Census & demographics
- Census place
- The Hideout, PA
- Population (ZIP)
- 13,225
Population outlook (Wayne County) Hauer SSP2
- Today (2025)
- 47,924 people
- By 2030
- 46,191 · -3.6%
- By 2040
- 42,815 · -10.7%
- By 2050
- 39,873 · -16.8%
- By 2075
- 34,556 · -27.9%
- By 2100
- 28,358 · -40.8%
Race, ethnicity, and origin ACS 2023
- Neighborhood character
- Predominantly White (95%)
- Race & ethnicity
- White 95% Two or more races 3% Hispanic / Latino 2%
- Common ancestry
- Romanian 9% Scotch-Irish 2% Iranian 2%
- Foreign-born
- 4%
- Languages at home
- 95% English-only · French/Haitian/Cajun 2% Russian/Polish/Slavic 1% Spanish 1%
Political lean MEDSL · Wayne
- 2024 margin
- Solid R (+37.1) · D 31.1% · R 68.2%
- 2008→2024 swing
- -24.8pp toward R · 2008: -12.3pp · 2024: -37.1pp
- All cycles
- 2024: R+37.1 2020: R+33.6 2016: R+39.7 2012: R+20.9 2008: R+12.3
Not yet ingested
- Civics
- —
Market trends
- HPI YoY
- ▲ 47.95%
- Current HPI
- 331.9645
- Rent YoY
- —
- Metro
- —
- State GDP YoY
- ▲ 1.68%
- F500 in state
- 34
Industry mix (Fortune 500 HQ in PA)
| Industry | F500 HQs | Revenue |
|---|---|---|
| Healthcare | 2 | $309B |
|
||
| Insurance | 2 | $27B |
|
||
| Telecommunications / Media | 1 | $124B |
|
||
| Industrial Distribution | 1 | $22B |
|
||
| Financial Services | 1 | $20B |
|
||
| Chemicals / Materials | 1 | $18B |
|
||
Price history
+923.2% since first listed2 events — show timeline
- 2026-05-18 Listed $265,000 PWMLS
- 1987-06-29 Sold (Public Records) $25,900 Public Records
Property tax history
+1.0%/yrLatest (2026): $2,580 · +3.0% YoY. Source: county tax records.
Cash-flow waterfall
monthlySold comps — $/sqft
last 12 mo · ≤1 miLoading sold comps…