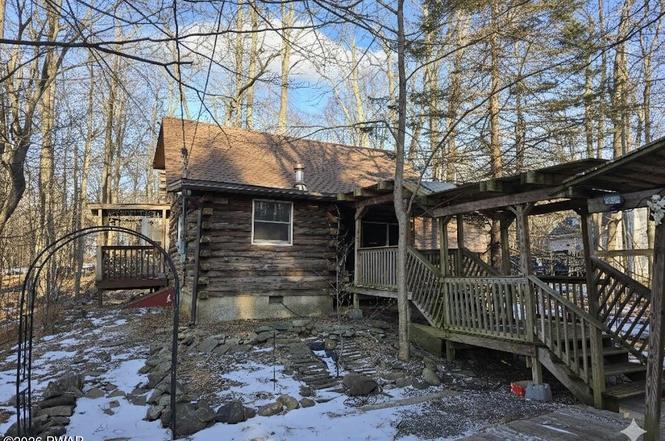
9339 Fairmount Way · Pocono Springs, PA
Flood risk 1/10 · Minimal
- FEMA flood zone
- X (unshaded)
- Chance of flooding over 30 yrs
- 0.0%
- Est. flood insurance / yr
- $507 – $1,088
Fire risk 1/10 · Minimal
- Est. fire insurance / yr
- $511 – $949
Heat risk 1/10 · Minimal
- Hot days now (above 89°F)
- 7 days/yr
- Hot days in 30 yrs
- 15 days/yr
Wind risk 3/10 · Minor
- Chance of severe wind over 30 yrs
- 6.0%
Air-quality risk 2/10 · Minimal
- Unhealthy air days now
- 1 days/yr
- Unhealthy air days in 30 yrs
- 2 days/yr
Risk factors via First Street. Map © Google.
Why this score? — see what drove the A- grade
The composite is a weighted blend of 9 inputs, each scored 0–100. Each bar is that input's sub-score; the figure is the points it added to the 100-point composite (weight × sub-score).
- Cash flow +30.0/30.0
- ARV discount +15.0/15.0
- 1% rule +10.0/10.0
- DSCR +10.0/10.0
- Appreciation +6.2/10.0
- Schools +4.0/10.0
- Livability +3.7/5.0
- Rent growth +2.5/5.0
- Condition / age +2.5/5.0
$124,500
🖨 Deal sheet 📄 Offer letter ✓ Due diligence
Listing remarks
Unlocking Potential in A Pocono Country Place! Whether you are an investor looking for your next rental project or a weekend warrior seeking a custom secondary home, or looking for primary living, this 3-bedroom mountain retreat is ready for its second act. The Vision: This home features a sought-after layout with a convenient first-floor bedroom and full bath, making it accessible and functional. The open-concept kitchen and dining area transition into a vaulted living room, where a classic stone fireplace serves as the focal point. Two additional bedrooms upstairs. The Opportunity: While the home requires some TLC, the bones are there to create a high-demand short-term rental or a modern
Key facts
- Open concept kitchen
- Full bath
- Vaulted living room
Tags
Neighborhood map
What this means for you Summary
Snapshot
- This is a 2-bed/1.0-bath single-family listed at $124k.
Deal economics
- At list price, monthly cash flow is $650 ($8k/yr) — positive.
- The deal already cash-flows at list — no discount required.
- Meets the 1% rule at list price ($2k rent vs $124k).
- Cap rate 12.6% vs local median 5.0% in Pocono Springs — top-decile yield for the area; either an underpriced asset or a hidden risk that comps aren't pricing in. Stress-test before assuming the spread holds.
Location & tenants
- Location reads 73/100 on livability (#560 in PA) — a middle-class / working-renter tenant base. Strengths: crime A+, employment A+, cost of living A+; Watch: schools F, amenities F, commute F.
- Pocono Mountain SD (rural): math 37% / reading 55% proficiency, ranked #245 of 539 in PA (top 46%) — families likely to look elsewhere, expect single-tenant / working-renter base with shorter leases.
- Market conditions: 355 active listings in the ZIP; 5 comparable units currently listed for rent nearby; rentals leasing fast (median 13d on market — plan ~1-2 weeks tenant-placement turnaround); 278 units permitted in Monroe County in 2024 (52 in 5+ unit buildings).
Forward outlook
- In year one you build about $4k of equity ($861 loan paydown + $3k appreciation (2.4% local appreciation)).
- Monroe County population projected at -11% by 2050 — secular population decline; favor cash flow + early exit over multi-decade hold.
- At projected returns (2.4% appreciation + 3.0% rent growth), your $35k cash investment doubles in ~3 years — after that, you're playing with house money.
- By year 9, paydown + projected appreciation supports a ~$32k cash-out refi (75% LTV) — recoverable capital for the next deal without selling this one.
Negotiation context
- Only 13 days on market — expect competitive offers; lowballing is unlikely to land.
- Current owner paid $66k; list at $124k implies a 89% gain — meaningful room to come down on a strong offer.
Questions for the listing agent
- What does the HOA fee cover, when was the last increase, and are there any pending special assessments or reserve-fund shortfalls?
- Is there a deadline driving the sale (1031 exchange, divorce, estate, relocation)? That informs how much negotiation room exists.
- Schools are F-rated, which usually means shorter tenancies and higher turnover. Who's the typical renter profile here, and what's been the actual vacancy rate?
- What's the average days-on-market for RENTAL listings here right now (not sales)? A rising rental-DOM trend means longer vacancies and softer asking-rent achievability than the comps imply.
- What's the recent tenant-quality profile in this submarket — average credit score on applications, eviction rate, late-payment / NSF rate, and stable-employment percentage? A property-management company in the area should have these aggregated.
- How much new for-sale + rental construction is in the pipeline within 1–3 miles? Heavy new supply typically softens prices + rents 12–24 months out; constrained supply supports both.
Investment metrics
- 1% rule
- 1.65% ✓
- Cap rate
- 12.56%
- Cash-on-cash
- 22.38%
- DSCR
- 2.00
- GRM
- 5.1
CMA / ARV
- ARV (on-the-fly)
- $191,360
- Comps found
- 8
Show comp detail 8 sales within ~0.75 mi
| Address | Dist | Beds/Ba | Sqft | Sold | Price | $/sf | Match |
|---|---|---|---|---|---|---|---|
| 9066 Idlewild Dr | 0.10mi | 2/1.0 | 864 (-6%) | 6mo | $262,500 | $304 | 80 |
| 9817 Deerwood Dr | 0.30mi | 3/1.0 (+1) | 948 (+3%) | 9mo | $125,000 | $132 | 68 |
| 9870 Deerwood Dr | 0.36mi | 2/1.0 | 956 (+4%) | 10mo | $140,000 | $146 | 68 |
| 9113 Idlewild Dr | 0.28mi | 3/1.0 (+1) | 1,000 (+9%) | 14mo | $195,000 | $195 | 56 |
| 9833 Deerwood Dr | 0.22mi | 3/2.0 (+1) | 960 (+4%) | 24mo | $221,000 | $230 | 54 |
| 9633 Stony Hollow Dr | 0.28mi | 3/1.0 (+1) | 806 (-12%) | 10mo | $220,000 | $273 | 52 |
| 9131 Brandywine Dr | 0.44mi | 2/1.0 | 854 (-7%) | 21mo | $178,000 | $208 | 50 |
| 9681 Stony Hollow Dr | 0.49mi | 3/1.0 (+1) | 1,008 (+10%) | 14mo | $180,000 | $179 | 44 |
Match score weights: distance 35% · size 25% · config 20% · recency 20%. Top-matched comps best support the ARV.
Projected returns pro-forma
2.36% appreciation · 3.0% rent growth · sell at horizon
- IRR
- 27.3%
- Equity multiple
- 2.50×
- Total profit
- $52,319
- Equity at exit
- $51,527
- IRR
- 28.6%
- Equity multiple
- 4.84×
- Total profit
- $133,717
- Equity at exit
- $76,105
Cash invested: $34,860 (down + closing). Projections, not guarantees.
Landlord ↔ Tenant lean methodology
- Overall (STATE)
- 62 Landlord-Friendly
- State Pennsylvania
- 62 Landlord-Friendly · EVEN
- County
- — inherits STATE
- City
- — inherits STATE
ZIP-level market 18466
- Home prices YoY
- 1.2%
- Active inventory
- 355
- Price-to-rent
- 5.1×
Monthly cashflow live
- Estimated rent
- $2,051 high interval (Pro) →
- Mortgage (P&I)
- −$653
- Tax from tax record
- −$122 /mo · $1,465/yr
- Insurance
- −$52
- HOA
- −$143
- Vacancy / Maint / Mgmt
- −$431
- Net cashflow
- $650
Break-even live
UW: 25.0% down · 7.5% · 30yr · 1.5% tax · 5.0% vac · 8.0% maint · 8.0% mgmt
Financing live
Cash to close
- Down payment
- $31,125
- Closing costs
- $3,735
- Reserves months
- —
- Total cash needed
- —
Loan-product check · same deal, 3 products live
Conventional
25% down · 7.5% · 30yr
- Down + closing
- —
- Monthly P&I
- —
- Monthly cashflow
- —
- DSCR
- —
- Eligible?
- —
Personal DTI + credit; lowest rate.
DSCR
20% down · 8.5% · 30yr
- Down + closing
- —
- Monthly P&I
- —
- Monthly cashflow
- —
- DSCR
- —
- Eligible?
- —
No personal income docs; deal must DSCR.
Hard money
10% down · 12.0% · 12mo
- Down + closing
- —
- Monthly P&I
- —
- Monthly cashflow
- —
- DSCR
- —
- Eligible?
- —
Short-term bridge; refi at stabilization.
Rent comps 5 comps
| Address | Beds | Baths | Sqft | Rent | $/sqft | DOM | Units | Dist |
|---|---|---|---|---|---|---|---|---|
| 9026 Idlewild Dr Tobyhanna, PA | 3.0 | 2.0 | 1068 | $2,300 | $2.15 | 13d | 1 | 0.37mi |
| 954 Country Place Dr Tobyhanna, PA | 3.0 | 1.0 | 1000 | $1,900 | $1.90 | 15d | 1 | 0.99mi |
| 954 Country Place Dr Unit H623 Tobyhanna, PA | 3.0 | 1.0 | 1040 | $1,900 | $1.83 | 43d | 1 | 0.99mi |
| 2846 Fairhaven Dr Tobyhanna, PA | 3.0 | 2.0 | 1024 | $1,950 | $1.90 | 13d | 1 | 1.05mi |
| 1763 Rolling Hills Dr Tobyhanna, PA | 3.0 | 1.5 | 1008 | $1,800 | $1.79 | 7d | 1 | 1.06mi |
HOA detail
- Monthly dues
- $143 · $1,716/yr
Listing history 4 events
-
2026-02-02status Pending
-
2026-01-20$124,500 Active
-
1995-06-13soldstatus $66,000
-
1990-05-01soldstatus $65,000
ⓘ Source: listings_history table (triggers on properties + properties_extension) + one-shot
backfill from property_details.listing_events for pre-trigger history.
Tax reassessment forecast PA · Partial reset (capped growth)
- Current annual tax
- $1,465 · $122/mo
- Projected year-2 tax
- $1,716 · $143/mo
- Expected delta
- +$251/yr (+$21/mo · 17.1%)
ⓘ Screening estimate from a state-policy table — verify with the county assessor before closing.
Climate risk First Street
- Flood 1/10 Low FEMA zone X (unshaded) · 0% chance over 30 yrs
- Wildfire 1/10 Low
- Heat 1/10 Low 7 d/yr ≥89°F today · 15 d/yr by 30 yrs out
- Wind 3/10 Moderate 6% chance of damaging wind over 30 yrs
- Air quality 2/10 Low 1 unhealthy d/yr today · 2 by 30 yrs out
Nearby sold comps map
Loading sold comps map…
Walkable amenities ~0.75 mi
Loading nearby amenities…
Taxation est. · year 1
- Rental income
- $24,608
- − Mortgage interest
- −$6,974
- − Property taxes
- −$1,465
- − Insurance
- −$622
- − Repairs & maintenance
- −$1,969
- − Management
- −$1,969
- − HOA
- −$1,716
- − Depreciation
- −$3,622
- Taxable income
- $6,271
- Est. tax owed @ 24.0%
- −$1,505
- After-tax cash flow
- $6,297/yr
For passive investors: Depreciation is non-cash, so a rental often shows a tax loss while cash-flowing — sheltering income. Rental losses are passive: they offset passive income freely, and up to $25,000/yr can offset ordinary (W-2) income if you actively participate and your MAGI is under $100k (phasing out to $0 by $150k); unused losses carry forward. On sale, claimed depreciation is recaptured at up to 25%, and gains may owe capital-gains tax (a 1031 exchange can defer both). Figures are a year-1 estimate at your 24.0% rate — not tax advice; consult a CPA.
Schools (NCES district)
- District
- Pocono Mountain SD
- NCES district ID
- 4219500
- Math proficiency
- 37% ▼ -5.00%
- Reading proficiency
- 55% ▲ 1.00%
- Median HH income
- $55,317
- Composite
- 39.91/100
- National rank
- #3856
- State rank
- #245 of 539 in PA
Livability — Pocono Springs
- Score
- 73/100
- State rank
- #560
- US rank
- #5263
Category grades
Schools grade is shown separately in the Schools card above.
Census & demographics
- Population (ZIP)
- 17,997
Population outlook (Monroe County) Hauer SSP2
- Today (2025)
- 164,099 people
- By 2030
- 161,412 · -1.6%
- By 2040
- 154,616 · -5.8%
- By 2050
- 146,710 · -10.6%
- By 2075
- 140,830 · -14.2%
- By 2100
- 138,472 · -15.6%
Race, ethnicity, and origin ACS 2023
- Neighborhood character
- Highly diverse neighborhood (Simpson 0.72)
- Race & ethnicity
- White 38% Hispanic / Latino 27% Black 24% Two or more races 17% Asian 4%
- Hispanic origin (detail)
- Puerto Rican 12% Dominican 6%
- Common ancestry
- Romanian 2% Portuguese 1% German 1%
- Foreign-born
- 16% · Canada
- Languages at home
- 77% English-only · Spanish 17% Other Indo-European 2% Russian/Polish/Slavic 1%
Political lean MEDSL · Monroe
- 2024 margin
- Toss-up / Even · D 49.1% · R 49.9%
- 2008→2024 swing
- -17.1pp toward R · 2008: 16.3pp · 2024: -0.8pp
- All cycles
- 2024: R+0.8 2020: D+6.4 2016: D+0.3 2012: D+14.0 2008: D+16.3
Not yet ingested
- Civics
- —
Market trends
- HPI YoY
- ▲ 2.36%
- Current HPI
- 202.4134
- Rent YoY
- —
- Metro
- —
- State GDP YoY
- ▲ 1.68%
- F500 in state
- 34
Industry mix (Fortune 500 HQ in PA)
| Industry | F500 HQs | Revenue |
|---|---|---|
| Healthcare | 2 | $309B |
|
||
| Insurance | 2 | $27B |
|
||
| Telecommunications / Media | 1 | $124B |
|
||
| Industrial Distribution | 1 | $22B |
|
||
| Financial Services | 1 | $20B |
|
||
| Chemicals / Materials | 1 | $18B |
|
||
Price history
+91.5% since first listed4 events — show timeline
- 2026-02-02 Pending — PWMLS
- 2026-01-20 Listed $124,500 PWMLS
- 1995-06-13 Sold (Public Records) $66,000 Public Records
- 1990-05-01 Sold (Public Records) $65,000 Public Records
Property tax history
-5.4%/yrLatest (2026): $1,465 · +3.2% YoY. Source: county tax records.
Cash-flow waterfall
monthlySold comps — $/sqft
last 12 mo · ≤1 miLoading sold comps…