7957 Joy St · Houston, TX
Flood risk 4/10 · Minor
- FEMA flood zone
- X (unshaded)
- Chance of flooding over 30 yrs
- 0.22%
- Est. flood insurance / yr
- $507 – $1,088
Fire risk 1/10 · Minimal
- Est. fire insurance / yr
- $1,222 – $2,270
Heat risk 9/10 · Severe
- Hot days now (above 111°F)
- 7 days/yr
- Hot days in 30 yrs
- 24 days/yr
Wind risk 9/10 · Severe
- Chance of severe wind over 30 yrs
- 99.0%
Air-quality risk 3/10 · Minor
- Unhealthy air days now
- 2 days/yr
- Unhealthy air days in 30 yrs
- 3 days/yr
Risk factors via First Street. Map © Google.
Why this score? — see what drove the B- grade
The composite is a weighted blend of 9 inputs, each scored 0–100. Each bar is that input's sub-score; the figure is the points it added to the 100-point composite (weight × sub-score).
- Cash flow +19.8/30.0
- ARV discount +15.0/15.0
- Appreciation +7.6/10.0
- DSCR +6.3/10.0
- 1% rule +5.7/10.0
- Livability +3.7/5.0
- Schools +2.7/10.0
- Condition / age +2.5/5.0
- Rent growth +2.1/5.0
$160,000
🖨 Deal sheet (PDF) 📄 Offer letter ✓ Due diligence
Listing remarks
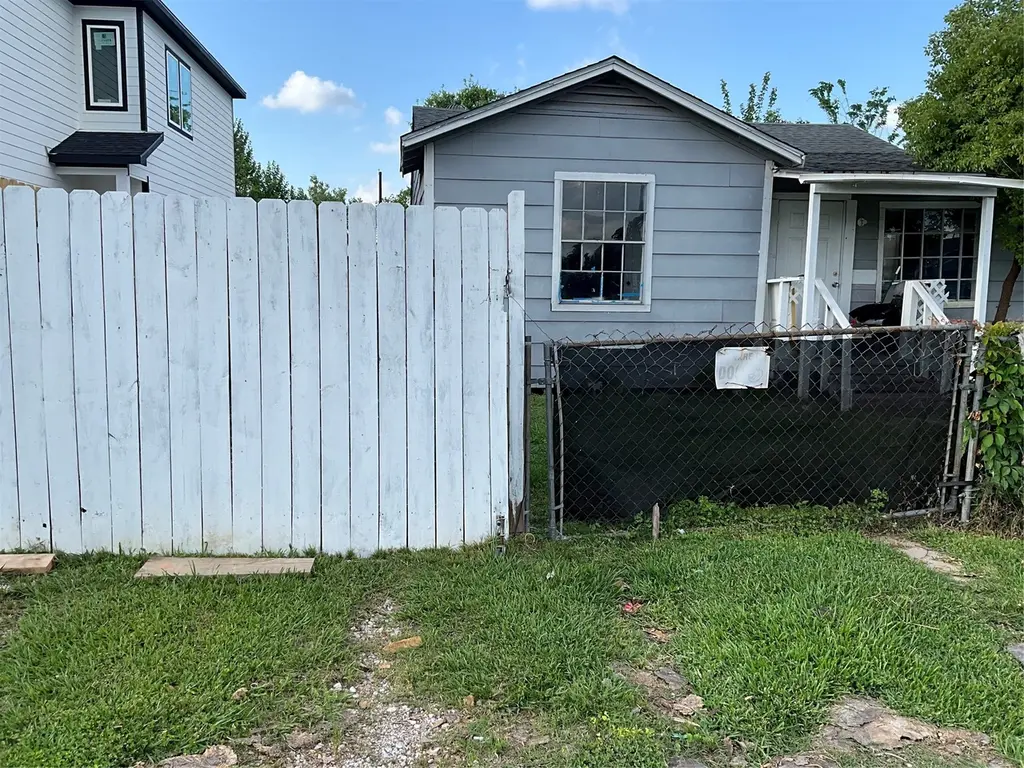
Prime Houston Investment Opportunity - Minutes from Downtown! Discover the potential of this property in close proximity to Downtown Houston, the University of Houston and the Medical Center, perfectly positioned in a rapidly growing area surrounded by new developments. This home features four spacious bedrooms, two bathrooms, and a charming covered front porch, gated parking space for two cars, and a storage shed in the back. The property needs repairs. It's secured partially by wood picket and metal fence. According to public records, the parcel measures 40ft front by 123 deep, offering a unique canvas for your imagination and "big thing" visions. Whether you're looking for a s
Key facts
- Covered front porch
- Gated parking space
- Storage shed
Tags
Property features AI
Finance
- Other: Lot dimensions approximately 40 x 123 (about 0.11 acres); Living area listed as 1,428
Exterior
- Parking: No parking available
- Utilities: Public water; Public sewer; Concrete road access
- Home design: Residential property; Single-story entry (all main rooms listed on first floor); Full ownership
- Construction: Built in 1940; Cement and wood siding; Composition roof; Block foundation
- Exterior features: Fully fenced yard; Private yard; Porch; Storage shed(s)
Interior
- Kitchen: Electric range
- Bedrooms: Primary bedroom (First floor) — 19 x 12; Bedroom (First floor) — 15 x 12; Bedroom (First floor) — 12 x 11; Bedroom (First floor) — 11 x 10
- Flooring: Laminate flooring
- Bathrooms: 2 full bathrooms
- Interior features: Tub with shower; Kitchen and dining combined
Neighborhood map
What this means for you Summary
Snapshot
- This is a 2-bed/1.0-bath single-family listed at $160k.
Deal economics
- At list price, monthly cash flow is $191 ($2k/yr) — positive.
- The deal already cash-flows at list — no discount required.
- Meets the 1% rule at list price ($2k rent vs $160k).
- Recommended offer: $150k (6.0% below list) — sets the bar for market timing.
Location & tenants
- Location reads 74/100 on livability (#184 in TX, #4,771 nationally) — a middle-class / working-renter tenant base. Strengths: amenities A+, cost of living A+, housing A+; Watch: crime F.
- Houston ISD (urban): math 27% / reading 35% proficiency, ranked #593 of 826 in TX (top 72%) — families likely to look elsewhere, expect single-tenant / working-renter base with shorter leases; 71% free/reduced lunch — lower-income household profile, screen leases tightly.
- Zoned schools: Elmore El (math 12% / reading 14%, grade F, #4,152 of 4,322 statewide, top 96%, 532 students, 99% FRL); Key Middle (math 10% / reading 20%, grade F, #1,569 of 1,662 statewide, top 95%, 615 students, 100% FRL); Kashmere H S (math 14% / reading 22%, grade F, #1,445 of 1,632 statewide, top 89%, 725 students, 96% FRL) — zoned schools average 98% FRL vs 71% district-wide (27 pts higher); higher-poverty schools than district average — tighter screening recommended.
- Zoned-school proficiency averages 15% at this address vs 31% district-wide (-16 pts) — the specific schools serving this property underperform the Houston ISD average; the district grade overstates school quality for this exact location.
- Market conditions: Rents soft (-1.6%/yr); 356 active listings in the ZIP; 36 comparable units currently listed for rent nearby; rentals at typical pace (median 27d on market — plan ~3-4 weeks tenant-placement turnaround); lower-income renter base — watch delinquency; 29,883 units permitted in Harris County in 2024 (8,621 in 5+ unit buildings).
Forward outlook
- In year one you build about $9k of equity ($1k loan paydown + $8k appreciation (5.2% local appreciation)).
- Harris County population projected at +47% by 2050 — long-run rental-demand tailwind backs the buy-and-hold thesis.
- At projected returns (5.2% appreciation + 0.0% rent growth), your $45k cash investment doubles in ~4 years — after that, you're playing with house money.
- By year 4, paydown + projected appreciation supports a ~$32k cash-out refi (75% LTV) — recoverable capital for the next deal without selling this one.
Negotiation context
- It's been on market 66 days — a 6% lower offer ($150k) is reasonable based on typical stale-listing flexibility.
- 4 sale attempts since 4y ago; this cycle's ask has dropped $20k (11%) from the opening price — seller is motivated, your offer sets the floor, not the list.
Risks & watch-outs
- Watch-outs: built in 1940 — expect roof / HVAC / electrical / plumbing capex.
- Climate carrying-cost: severe wind risk, 99% chance of damaging wind over 30y; extreme-heat days projected 7→24/yr by 2055 (HVAC capex compounding) — expect insurance premiums to compound above CPI over the hold.
Questions for the listing agent
- It's been on market 66 days. Have you received any prior offers? Is the seller open to a 6% concession, seller financing, or rate buy-down credit?
- Built in 1940 — when were the roof, HVAC, electrical panel, plumbing, and water heater last replaced?
- Why hasn't it sold? Are there any deal-killer items the seller is aware of (foundation, flood, title, zoning, code violations)?
- Is there a deadline driving the sale (1031 exchange, divorce, estate, relocation)? That informs how much negotiation room exists.
- Schools are D-rated, which usually means shorter tenancies and higher turnover. Who's the typical renter profile here, and what's been the actual vacancy rate?
- Crime grade is F in this area — have there been break-ins, vandalism, or insurance claims at this property in the last 3 years? What carrier currently insures it and at what premium?
- What's the average days-on-market for RENTAL listings here right now (not sales)? A rising rental-DOM trend means longer vacancies and softer asking-rent achievability than the comps imply.
- What's the recent tenant-quality profile in this submarket — average credit score on applications, eviction rate, late-payment / NSF rate, and stable-employment percentage? A property-management company in the area should have these aggregated.
- How much new for-sale + rental construction is in the pipeline within 1–3 miles? Heavy new supply typically softens prices + rents 12–24 months out; constrained supply supports both.
Investment metrics
- 1% rule
- 1.07% ✓
- Cap rate
- 7.73%
- Cash-on-cash
- 5.12%
- DSCR
- 1.23
- GRM
- 7.8
CMA / ARV
- ARV (median comp)
- $251,824
- List price
- $160,000
- Delta
- -36.46%
- Verdict
- UNDERPRICED
- Comps
- 20 within 1.0 mi
Show comp detail 12 sales within ~0.75 mi
| Address | Dist | Beds/Ba | Sqft | Sold | Price | $/sf | Match |
|---|---|---|---|---|---|---|---|
| 8008 Sunbury St | 0.31mi | 3/2.5 (+1) | 1,553 (+9%) | 1mo | $266,000 | $171 | 59 |
| 8022 Sunbury St | 0.32mi | 3/2.5 (+1) | 1,553 (+9%) | 4mo | $279,900 | $180 | 56 |
| 8002 Carolwood Dr | 0.72mi | 3/2.0 (+1) | 1,450 (+2%) | 4mo | $194,900 | $134 | 52 |
| 7930 Carolwood Dr | 0.70mi | 3/1.5 (+1) | 1,366 (-4%) | 3mo | $99,900 | $73 | 50 |
| 7963 Miley St | 0.59mi | 3/2.0 (+1) | 1,550 (+8%) | 4mo | $285,000 | $184 | 46 |
| 7832 Dewitt St | 0.56mi | 3/2.0 (+1) | 1,594 (+12%) | 1mo | $264,900 | $166 | 44 |
| 7546 Delavan Dr | 0.73mi | 3/2.5 (+1) | 1,505 (+5%) | 4mo | $289,999 | $193 | 43 |
| 7714 N Howton St | 0.54mi | 3/2.0 (+1) | 1,615 (+13%) | 4mo | $270,000 | $167 | 40 |
| 6111 Haight St | 0.60mi | 3/2.5 (+1) | 1,627 (+14%) | 3mo | $274,000 | $168 | 35 |
| 7941 Attwater St | 0.66mi | 3/2.5 (+1) | 1,614 (+13%) | 5mo | $235,000 | $146 | 33 |
| 7939 Carolwood Dr | 0.73mi | 3/2.0 (+1) | 1,620 (+13%) | 2mo | $122,900 | $76 | 32 |
| 5915 Haight St | 0.74mi | 3/2.5 (+1) | 1,627 (+14%) | 2mo | $282,000 | $173 | 30 |
Match score weights: distance 35% · size 25% · config 20% · recency 20%. Top-matched comps best support the ARV.
Projected returns pro-forma
5.25% appreciation · 0.0% rent growth · sell at horizon
- IRR
- 16.3%
- Equity multiple
- 2.03×
- Total profit
- $46,340
- Equity at exit
- $93,061
- IRR
- 15.4%
- Equity multiple
- 3.68×
- Total profit
- $120,088
- Equity at exit
- $162,622
Cash invested: $44,800 (down + closing). Projections, not guarantees.
Landlord ↔ Tenant lean methodology
- Overall (STATE)
- 87 Strongly Landlord-Friendly
- State Texas
- 87 Strongly Landlord-Friendly · R+5
- County
- — inherits STATE
- City
- — inherits STATE
ZIP-level market 77028
- Home prices YoY
- 2.0%
- Rents YoY
- -1.6%
- Active inventory
- 356
- Price-to-rent
- 7.8×
Monthly cashflow live
- Estimated rent
- $1,713 high interval (Pro) →
- Mortgage (P&I)
- −$839
- Tax from tax record
- −$256 /mo · $3,077/yr
- Insurance
- −$67
- HOA
- −$0
- Lot rent
- −$0
- Vacancy / Maint / Mgmt
- −$360
- Net cashflow
- $191
Break-even live
Sensitivity live
| Price | -10% $282 | -5% $236 | +0% $191 | +5% $146 | +10% $101 |
|---|---|---|---|---|---|
| Rent | -10% $56 | -5% $123 | +0% $191 | +5% $259 | +10% $326 |
| Rate | -1.0pp $272 | -0.5pp $232 | base $191 | +0.5pp $150 | +1.0pp $108 |
UW: 25.0% down · 7.5% · 30yr · 1.5% tax · 5.0% vac · 8.0% maint · 8.0% mgmt
Financing live
Cash to close
- Down payment
- $40,000
- Closing costs
- $4,800
- Reserves months
- —
- Total cash needed
- —
Loan-product check · same deal, 3 products live
Conventional
25% down · 7.5% · 30yr
- Down + closing
- —
- Monthly P&I
- —
- Monthly cashflow
- —
- DSCR
- —
- Eligible?
- —
Personal DTI + credit; lowest rate.
DSCR
20% down · 8.5% · 30yr
- Down + closing
- —
- Monthly P&I
- —
- Monthly cashflow
- —
- DSCR
- —
- Eligible?
- —
No personal income docs; deal must DSCR.
Hard money
10% down · 12.0% · 12mo
- Down + closing
- —
- Monthly P&I
- —
- Monthly cashflow
- —
- DSCR
- —
- Eligible?
- —
Short-term bridge; refi at stabilization.
Rent comps 36 comps
| Address | Beds | Baths | Sqft | Rent | $/sqft | DOM | Units | Dist |
|---|---|---|---|---|---|---|---|---|
| 7973 Ritz St Houston, TX | 3.0 | 2.0 | 1076 | $2,250 | $2.09 | 10d | 1 | 0.08mi |
| 7945 Henson St Houston, TX | 3.0 | 2.0 | 1300 | $1,665 | $1.28 | 2d | 1 | 0.18mi |
| 7947 Henson St Houston, TX | 3.0 | 2.0 | 1090 | $1,349 | $1.24 | 8d | 1 | 0.18mi |
| 7966 Henson St Unit B Houston, TX | 3.0 | 2.0 | 1608 | $1,410 | $0.88 | 46d | 1 | 0.21mi |
| 7830 Nashville St Houston, TX | 3.0 | 2.0 | 1175 | $1,800 | $1.53 | 10d | 1 | 0.24mi |
| 8158 Sunbury St Houston, TX | 3.0 | 2.5 | 1300 | $1,525 | $1.17 | 27d | 1 | 0.44mi |
| 8135 Chateau St Houston, TX | 3.0 | 3.0 | 1610 | $1,645 | $1.02 | 13d | 1 | 0.48mi |
| 8117 Saint Louis St Houston, TX | 3.0 | 2.0 | 1090 | $1,335 | $1.22 | 24d | 1 | 0.50mi |
| 8119 Saint Louis St Houston, TX | 3.0 | 2.0 | 1090 | $1,349 | $1.24 | 46d | 1 | 0.50mi |
| 8102 Crestview Dr Unit A Houston, TX | 3.0 | 2.5 | 1800 | $1,900 | $1.06 | 24d | 1 | 0.76mi |
| 8102 Crestview Dr Unit B Houston, TX | 3.0 | 2.5 | 1600 | $1,900 | $1.19 | 46d | 1 | 0.76mi |
| 7804 Crestview Dr Unit A Houston, TX | 3.0 | 2.0 | 1150 | $1,550 | $1.35 | 24d | 1 | 0.77mi |
| 8113 Denton St Houston, TX | 3.0 | 2.0 | 1150 | $1,750 | $1.52 | 46d | 1 | 0.79mi |
| 7839 Sandy St Houston, TX | 3.0 | 2.0 | 1300 | $1,575 | $1.21 | 2d | 1 | 0.84mi |
| 8309 Carolwood Dr Houston, TX | 3.0 | 1.0 | 938 | $1,350 | $1.44 | 46d | 1 | 0.87mi |
| 8216 Richland Dr Unit B Houston, TX | 3.0 | 2.0 | 1150 | $1,750 | $1.52 | 46d | 1 | 0.91mi |
| 8015 Elbert St Unit A Houston, TX | 2.0 | 2.0 | 1021 | $1,650 | $1.62 | 10d | 1 | 0.92mi |
| 7600 E Houston Rd Houston, TX | 1.0–3.0 | 1.0–2.0 | 1017 | $1,233 | $1.21 | 16d | 8 | 0.94mi |
| 7914 Laura Koppe Rd Houston, TX | 3.0 | 2.0 | 1400 | $1,850 | $1.32 | 46d | 1 | 0.98mi |
| 8213 Linda Vista Rd Houston, TX | 3.0 | 2.0 | 1298 | $1,625 | $1.25 | 27d | 1 | 0.99mi |
| 7956 Bonaire St Unit B Houston, TX | 3.0 | 2.5 | 1498 | $2,150 | $1.44 | 46d | 1 | 1.04mi |
| 7956 Bonaire St Unit A Houston, TX | 3.0 | 2.5 | 1498 | $2,050 | $1.37 | 2d | 1 | 1.04mi |
| 7601 Springdale St Houston, TX | 3.0 | 2.0 | 1224 | $1,200 | $0.98 | 18d | 1 | 1.06mi |
| 7418 Bywood St Houston, TX | 3.0 | 2.0 | 1300 | $1,800 | $1.38 | 27d | 1 | 1.08mi |
| 5415 Bacher St Unit A Houston, TX | 3.0 | 2.5 | 1540 | $2,350 | $1.53 | 27d | 1 | 1.11mi |
| 5415 Bacher St Unit A Houston, TX | 3.0 | 2.5 | 1540 | $2,350 | $1.53 | 46d | 1 | 1.11mi |
| 8203 Woodlyn Rd Unit C Houston, TX | 3.0 | 2.5 | 1650 | $1,650 | $1.00 | 10d | 1 | 1.14mi |
| 8238 Homewood Ln Houston, TX | 3.0 | 2.0 | 1696 | $1,695 | $1.00 | 27d | 1 | 1.21mi |
| 8238 Homewood Ln Houston, TX | 3.0 | 2.0 | 1696 | $1,695 | $1.00 | 1d | 1 | 1.21mi |
| 5212 Ina St Houston, TX | 1.0 | 1.5 | 1175 | $1,050 | $0.89 | 46d | 1 | 1.24mi |
| 8006 Lynette St Houston, TX | 3.0 | 1.0 | 1400 | $1,475 | $1.05 | 27d | 1 | 1.29mi |
| 5426 E Houston Rd Unit A Houston, TX | 3.0 | 2.5 | 1608 | $1,675 | $1.04 | 2d | 1 | 1.31mi |
| 7119 Bywood St Unit A Houston, TX | 3.0 | 2.5 | 1150 | $1,795 | $1.56 | 46d | 1 | 1.38mi |
| 8602 Wilkins Oaks Dr Houston, TX | 3.0 | 2.0 | 1307 | $1,775 | $1.36 | 46d | 1 | 1.43mi |
| 5217 E Houston Rd Unit A Houston, TX | 3.0 | 2.5 | 1608 | $1,700 | $1.06 | 1d | 1 | 1.44mi |
| 8638 Doris Oaks Cir Houston, TX | 3.0 | 3.0 | 1777 | $1,975 | $1.11 | 46d | 1 | 1.47mi |
Listing history 25 events
-
2026-06-22days on market $160,000 Active 66 DOM
-
2026-06-21days on market $160,000 Active 65 DOM
-
2026-06-18days on market $160,000 Active 62 DOM
-
2026-06-17days on market $160,000 Active 61 DOM
-
2026-06-16days on market $160,000 Active 60 DOM
-
2026-06-15price $160,000 Active 59 DOM
-
2026-06-15days on market $180,000 Active 59 DOM
-
2026-06-13days on market $180,000 Active 57 DOM
-
2026-06-10days on market $180,000 Active 53 DOM
-
2026-06-08days on market $180,000 Active 52 DOM
-
2026-06-07days on market $180,000 Active 51 DOM
-
2026-06-04days on market $180,000 Active 48 DOM
-
2026-06-01days on market $180,000 Active 45 DOM
-
2026-05-31days on market $180,000 Active 44 DOM
-
2026-04-17$180,000 Active 873-char remark
-
2024-01-03historical
-
2023-11-02price $160,000
-
2023-09-05$175,000 Active
-
2023-05-01historical
-
2023-04-18price $165,000
-
2023-03-26price $170,000
-
2023-03-02$175,000 Active
-
2023-01-31historical
-
2022-11-27$180,000 Active
-
1988-01-02soldstatus
ⓘ Source: listings_history table (triggers on properties + properties_extension) + one-shot
backfill from property_details.listing_events for pre-trigger history.
Tax reassessment forecast TX · Resets to sale price
- Current annual tax
- $3,077 · $256/mo
- Projected year-2 tax
- $3,077 · $256/mo
- Expected delta
- $0/yr ($0/mo · 0.0%)
ⓘ Screening estimate from a state-policy table — verify with the county assessor before closing.
Climate risk First Street
- Flood 4/10 Moderate FEMA zone X (unshaded) · 22% chance over 30 yrs
- Wildfire 1/10 Low
- Heat 9/10 Extreme 7 d/yr ≥111°F today · 24 d/yr by 30 yrs out
- Wind 9/10 Extreme 99% chance of damaging wind over 30 yrs
- Air quality 3/10 Moderate 2 unhealthy d/yr today · 3 by 30 yrs out
Nearby sold comps map
Loading sold comps map…
Walkable amenities ~0.75 mi
Loading nearby amenities…
Taxation est. · year 1
- Rental income
- $20,556
- − Mortgage interest
- −$8,962
- − Property taxes
- −$3,077
- − Insurance
- −$800
- − Repairs & maintenance
- −$1,644
- − Management
- −$1,644
- − Depreciation
- −$4,655
- Taxable loss
- −$227
- Est. tax savings @ 24.0%
- +$54
- After-tax cash flow
- $2,348/yr
For passive investors: Depreciation is non-cash, so a rental often shows a tax loss while cash-flowing — sheltering income. Rental losses are passive: they offset passive income freely, and up to $25,000/yr can offset ordinary (W-2) income if you actively participate and your MAGI is under $100k (phasing out to $0 by $150k); unused losses carry forward. On sale, claimed depreciation is recaptured at up to 25%, and gains may owe capital-gains tax (a 1031 exchange can defer both). Figures are a year-1 estimate at your 24.0% rate — not tax advice; consult a CPA.
Schools (NCES district)
- District
- Houston ISD
- NCES district ID
- 4823640
- Math proficiency
- 27% ▼ -18.00%
- Reading proficiency
- 35% ▼ -6.00%
- Median HH income
- $46,054
- Composite
- 26.63/100
- National rank
- #7173
- State rank
- #593 of 826 in TX
Livability — Houston
- Score
- 74/100
- State rank
- #184
- US rank
- #4771
Category grades
Schools grade is shown separately in the Schools card above.
Census & demographics
- Census place
- Houston, TX
- County
- Harris County · 4,702,590 people
- City population
- 3,226,434
- Metro
- Houston-The Woodlands-Sugar Land, TX
- Population (ZIP)
- 19,109
- Household income
- $38,357
- Rent vs Own
- Severe rent burden
- 1177.0
Population outlook (Harris County) Hauer SSP2
- Today (2025)
- 5,571,493 people
- By 2030
- 6,089,821 · +9.3%
- By 2040
- 7,142,806 · +28.2%
- By 2050
- 8,185,864 · +46.9%
- By 2075
- 10,574,329 · +89.8%
- By 2100
- 12,109,958 · +117.4%
Race, ethnicity, and origin ACS 2023
- Neighborhood character
- Majority Black (57%)
- Race & ethnicity
- Black 57% Hispanic / Latino 41% Two or more races 15% White 2%
- Hispanic origin (detail)
- Mexican 36%
- Foreign-born
- 13% · Canada
- Languages at home
- 61% English-only · Spanish 38%
Political lean MEDSL · Harris
- 2024 margin
- Lean D (+5.5) · D 52.0% · R 46.4% · Other 1.6%
- 2008→2024 swing
- +3.9pp toward D · 2008: 1.6pp · 2024: 5.5pp
- All cycles
- 2024: D+5.5 2020: D+13.3 2016: D+12.4 2012: D+0.1 2008: D+1.6
Not yet ingested
- Civics
- —
Market trends
- HPI YoY
- ▲ 5.25%
- Current HPI
- 267.7798
- Rent YoY
- ▼ -1.55%
- Metro
- Houston-The Woodlands-Sugar Land, TX
- State GDP YoY
- ▲ 3.95%
- F500 in state
- 110
Industry mix (Fortune 500 HQ in TX)
| Industry | F500 HQs | Revenue |
|---|---|---|
| Energy | 16 | $1,198B |
|
||
| Technology | 5 | $198B |
|
||
| Engineering / Construction | 4 | $72B |
|
||
| Energy Services | 3 | $60B |
|
||
| Utilities | 3 | $41B |
|
||
| Healthcare | 2 | $330B |
|
||
Price history
-11.1% since first listed12 events — show timeline
- 2026-06-15 Price Changed $160,000 HARMLS
- 2026-04-17 Listed $180,000 HARMLS
- 2024-01-03 Listing Removed — HARMLS
- 2023-11-02 Price Changed $160,000 HARMLS
- 2023-09-05 Listed $175,000 HARMLS
- 2023-05-01 Listing Removed — HARMLS
- 2023-04-18 Price Changed $165,000 HARMLS
- 2023-03-26 Price Changed $170,000 HARMLS
- 2023-03-02 Listed $175,000 HARMLS
- 2023-01-31 Listing Removed — HARMLS
- 2022-11-27 Listed $180,000 HARMLS
- 1988-01-02 Sold (Public Records) — Public Records
Property tax history
+16.1%/yrLatest (2025): $3,077 · +20.0% YoY. Source: county tax records.
Cash-flow waterfall
monthlySold comps — $/sqft
last 12 mo · ≤1 miLoading sold comps…