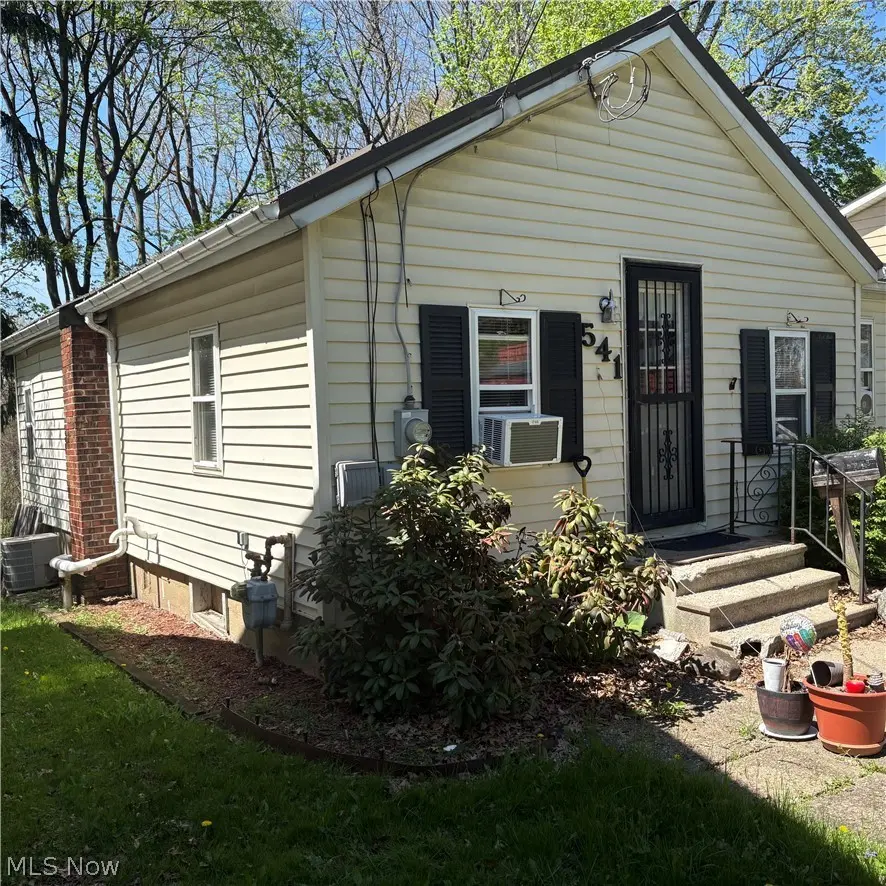
541 Clinton St · Ravenna, OH
Flood risk 1/10 · Minimal
- FEMA flood zone
- X (unshaded)
- Chance of flooding over 30 yrs
- 0.0%
- Est. flood insurance / yr
- $473 – $860
Fire risk 1/10 · Minimal
- Est. fire insurance / yr
- $713 – $1,323
Heat risk 3/10 · Minor
- Hot days now (above 96°F)
- 7 days/yr
- Hot days in 30 yrs
- 17 days/yr
Wind risk 1/10 · Minimal
- Chance of severe wind over 30 yrs
- —
Air-quality risk 3/10 · Minor
- Unhealthy air days now
- 2 days/yr
- Unhealthy air days in 30 yrs
- 5 days/yr
Risk factors via First Street. Map © Google.
Why this score? — see what drove the B- grade
The composite is a weighted blend of 9 inputs, each scored 0–100. Each bar is that input's sub-score; the figure is the points it added to the 100-point composite (weight × sub-score).
- Cash flow +30.0/30.0
- 1% rule +10.0/10.0
- DSCR +10.0/10.0
- ARV discount +7.5/15.0
- Livability +3.7/5.0
- Schools +3.0/10.0
- Rent growth +2.5/5.0
- Condition / age +2.5/5.0
- Appreciation +0.0/10.0
$69,900
🖨 Deal sheet 📄 Offer letter ✓ Due diligence
Listing remarks MLS
Hud Case no. 412-546492, sold as-is
Key facts
- 7,501 sq ft lot
- Parking
- Built 1947
Property features AI
Finance
- Other: Below-grade finished area present
Exterior
- Parking: Driveway
- Utilities: Public water; Public sewer
- Home design: Single-story home; Faces east; Property listed as fixer
- Construction: Vinyl siding; Asphalt/fiberglass roof; Block foundation; Built according to public records
- Exterior features: Backyard access from laundry room; Lot dimensions approximately 50 x 150
Interior
- Kitchen: Eat-in kitchen with good cupboard space; Gas range stays; Refrigerator stays
- Bedrooms: Two main-level bedrooms; Bedroom with laminate flooring and closet space; Second bedroom with large closet and laminate floors
- Flooring: Laminate flooring in living room and bedrooms; Linoleum in kitchen and laundry
- Bathrooms: One full bathroom (main level)
- Heating & cooling: Forced-air heating; Window air conditioning unit(s)
- Interior features: Ceiling fan(s); Eat-in kitchen; Full basement
- Laundry & utility: Laundry room on main level with hookups; Laundry room provides access to the backyard
Neighborhood map
What this means for you Summary
Snapshot
- This is a 3-bed/1.0-bath single-family listed at $70k.
Deal economics
- At list price, monthly cash flow is $331 ($4k/yr) — positive.
- The deal already cash-flows at list — no discount required.
- Meets the 1% rule at list price ($1k rent vs $70k).
- Cap rate 12.0% vs local median 3.0% in Ravenna — top-decile yield for the area; either an underpriced asset or a hidden risk that comps aren't pricing in. Stress-test before assuming the spread holds.
Location & tenants
- Location reads 73/100 on livability (#323 in OH) — a middle-class / working-renter tenant base. Strengths: cost of living A+, health & safety A+, housing A-; Watch: amenities F, commute F, employment F.
- Ravenna City (suburban): math 31% / reading 41% proficiency, ranked #559 of 656 in OH (top 85%) — families likely to look elsewhere, expect single-tenant / working-renter base with shorter leases.
- Market conditions: 159 active listings in the ZIP; 4 comparable units currently listed for rent nearby; rentals at typical pace (median 14d on market — plan ~3-4 weeks tenant-placement turnaround); 196 units permitted in Portage County in 2024 (10 in 5+ unit buildings).
Forward outlook
- Local home prices are declining (-3.0%/yr); year-one equity from $483 of loan paydown is wiped out by about $2k of value loss. Plan a longer hold.
- At projected returns (-3.0% appreciation + 3.0% rent growth), your $20k cash investment doubles in ~6 years — after that, you're playing with house money.
Negotiation context
- Only 5 days on market — expect competitive offers; lowballing is unlikely to land.
- 5 sale attempts since 21y ago with the ask held roughly flat each time — persistent listings suggest the price (not the market) is what's stuck; bring a comps-based counter.
- Current owner paid $9k; list at $70k implies a 640% gain — meaningful room to come down on a strong offer.
Risks & watch-outs
- Watch-outs: built in 1947 — expect roof / HVAC / electrical / plumbing capex.
Questions for the listing agent
- Built in 1947 — when were the roof, HVAC, electrical panel, plumbing, and water heater last replaced?
- Is there a deadline driving the sale (1031 exchange, divorce, estate, relocation)? That informs how much negotiation room exists.
- What's the average days-on-market for RENTAL listings here right now (not sales)? A rising rental-DOM trend means longer vacancies and softer asking-rent achievability than the comps imply.
- What's the recent tenant-quality profile in this submarket — average credit score on applications, eviction rate, late-payment / NSF rate, and stable-employment percentage? A property-management company in the area should have these aggregated.
- How much new for-sale + rental construction is in the pipeline within 1–3 miles? Heavy new supply typically softens prices + rents 12–24 months out; constrained supply supports both.
Investment metrics
- 1% rule
- 1.53% ✓
- Cap rate
- 11.98%
- Cash-on-cash
- 20.30%
- DSCR
- 1.90
- GRM
- 5.4
CMA / ARV
- ARV (median comp)
- $150,992
- List price
- $69,900
- Delta
- -0.72%
- Verdict
- FAIR
- Comps
- 20 within 1.0 mi
Show comp detail 3 sales within ~0.75 mi
| Address | Dist | Beds/Ba | Sqft | Sold | Price | $/sf | Match |
|---|---|---|---|---|---|---|---|
| 368 E Central Ave | 0.20mi | 2/1.0 (-1) | 825 (+7%) | 14mo | $139,900 | $170 | 62 |
| 143 E Central Ave | 0.25mi | 2/1.0 (-1) | 718 (-7%) | 18mo | $70,000 | $97 | 56 |
| 326 E Highland Ave | 0.38mi | 2/1.0 (-1) | 852 (+10%) | 12mo | $135,000 | $158 | 50 |
Match score weights: distance 35% · size 25% · config 20% · recency 20%. Top-matched comps best support the ARV.
Projected returns pro-forma
-3.0% appreciation · 3.0% rent growth · sell at horizon
- IRR
- 12.6%
- Equity multiple
- 1.50×
- Total profit
- $9,792
- Equity at exit
- $10,422
- IRR
- 21.5%
- Equity multiple
- 2.83×
- Total profit
- $35,818
- Equity at exit
- $6,044
Cash invested: $19,572 (down + closing). Projections, not guarantees.
Landlord ↔ Tenant lean methodology
- Overall (STATE)
- 73 Landlord-Friendly
- State Ohio
- 73 Landlord-Friendly · R+6
- County
- — inherits STATE
- City
- — inherits STATE
ZIP-level market 44266
- Active inventory
- 159
- Price-to-rent
- 5.4×
Monthly cashflow live
- Estimated rent
- $1,070 medium interval (Pro) →
- Mortgage (P&I)
- −$367
- Tax from tax record
- −$118 /mo · $1,421/yr
- Insurance
- −$29
- HOA
- −$0
- Vacancy / Maint / Mgmt
- −$225
- Net cashflow
- $331
Break-even live
UW: 25.0% down · 7.5% · 30yr · 1.5% tax · 5.0% vac · 8.0% maint · 8.0% mgmt
Financing live
Cash to close
- Down payment
- $17,475
- Closing costs
- $2,097
- Reserves months
- —
- Total cash needed
- —
Loan-product check · same deal, 3 products live
Conventional
25% down · 7.5% · 30yr
- Down + closing
- —
- Monthly P&I
- —
- Monthly cashflow
- —
- DSCR
- —
- Eligible?
- —
Personal DTI + credit; lowest rate.
DSCR
20% down · 8.5% · 30yr
- Down + closing
- —
- Monthly P&I
- —
- Monthly cashflow
- —
- DSCR
- —
- Eligible?
- —
No personal income docs; deal must DSCR.
Hard money
10% down · 12.0% · 12mo
- Down + closing
- —
- Monthly P&I
- —
- Monthly cashflow
- —
- DSCR
- —
- Eligible?
- —
Short-term bridge; refi at stabilization.
Rent comps 4 comps
| Address | Beds | Baths | Sqft | Rent | $/sqft | DOM | Units | Dist |
|---|---|---|---|---|---|---|---|---|
| 709 Sapp Rd Ravenna, OH | 1.0–2.0 | 1.0 | 712 | $950 | $1.33 | 13d | 1 | 0.34mi |
| 529 E Main St Unit B-18 Ravenna, OH | 2.0 | 1.0 | 850 | $1,000 | $1.18 | 14d | 1 | 0.44mi |
| 4514 Coe Rd Ravenna, OH | 3.0 | 1.0 | 964 | $929 | $0.96 | 13d | 1 | 0.55mi |
| 608 W Highland Ave Ravenna, OH | 2.0 | 1.0 | 870 | $1,025 | $1.18 | 14d | 1 | 0.75mi |
Listing history 15 events
-
2026-06-18days on market $69,900 Active 5 DOM
-
2026-06-17days on market $69,900 Active 4 DOM
-
2026-06-16days on market $69,900 Active 3 DOM
-
2026-06-15days on market $69,900 Active 2 DOM
-
2026-06-14remarks 303-char remark
-
2026-06-14pricestatus $69,900 Active 1 DOM
-
2026-05-06historical
-
2026-04-30$149,900 Active
-
2009-03-05soldstatus $9,450 35-char remark
Show marketing remark (35 chars)
Hud Case no. 412-546492, sold as-is
-
2008-06-13$16,000 35-char remark
Show marketing remark (35 chars)
Hud Case no. 412-546492, sold as-is
-
2006-07-27soldstatus $84,000
-
2006-01-30historical
-
2005-10-13historical
-
2005-07-30$82,000
-
2005-04-13$84,900
ⓘ Source: listings_history table (triggers on properties + properties_extension) + one-shot
backfill from property_details.listing_events for pre-trigger history.
Tax reassessment forecast OH · Partial reset (capped growth)
- Current annual tax
- $1,421 · $118/mo
- Projected year-2 tax
- $1,421 · $118/mo
- Expected delta
- $0/yr ($0/mo · 0.0%)
ⓘ Screening estimate from a state-policy table — verify with the county assessor before closing.
Climate risk First Street
- Flood 1/10 Low FEMA zone X (unshaded) · 0% chance over 30 yrs
- Wildfire 1/10 Low
- Heat 3/10 Moderate 7 d/yr ≥96°F today · 17 d/yr by 30 yrs out
- Wind 1/10 Low
- Air quality 3/10 Moderate 2 unhealthy d/yr today · 5 by 30 yrs out
Nearby sold comps map
Loading sold comps map…
Walkable amenities ~0.75 mi
Loading nearby amenities…
Taxation est. · year 1
- Rental income
- $12,838
- − Mortgage interest
- −$3,915
- − Property taxes
- −$1,421
- − Insurance
- −$350
- − Repairs & maintenance
- −$1,027
- − Management
- −$1,027
- − Depreciation
- −$2,033
- Taxable income
- $3,064
- Est. tax owed @ 24.0%
- −$735
- After-tax cash flow
- $3,237/yr
For passive investors: Depreciation is non-cash, so a rental often shows a tax loss while cash-flowing — sheltering income. Rental losses are passive: they offset passive income freely, and up to $25,000/yr can offset ordinary (W-2) income if you actively participate and your MAGI is under $100k (phasing out to $0 by $150k); unused losses carry forward. On sale, claimed depreciation is recaptured at up to 25%, and gains may owe capital-gains tax (a 1031 exchange can defer both). Figures are a year-1 estimate at your 24.0% rate — not tax advice; consult a CPA.
Schools (NCES district)
- District
- Ravenna City
- NCES district ID
- 3904468
- Math proficiency
- 31% ▼ -22.00%
- Reading proficiency
- 41% ▼ -13.00%
- Median HH income
- $40,018
- Composite
- 30.19/100
- National rank
- #6314
- State rank
- #559 of 656 in OH
Livability — Ravenna
- Score
- 73/100
- State rank
- #323
- US rank
- #5309
Category grades
Schools grade is shown separately in the Schools card above.
Census & demographics
- Census place
- Ravenna, OH
- County
- Portage County · 70,400 people
- City population
- 32,612
- Metro
- Akron, OH
- Population (ZIP)
- 32,612
- Household income
- $64,918
- Rent vs Own
- Severe rent burden
- 1468.0
Population outlook (Portage County) Hauer SSP2
- Today (2025)
- 166,109 people
- By 2030
- 167,752 · +1.0%
- By 2040
- 168,640 · +1.5%
- By 2050
- 167,469 · +0.8%
- By 2075
- 170,131 · +2.4%
- By 2100
- 167,958 · +1.1%
Race, ethnicity, and origin ACS 2023
- Neighborhood character
- Predominantly White (87%)
- Race & ethnicity
- White 87% Black 6% Two or more races 4% Hispanic / Latino 2%
- Common ancestry
- Romanian 3% Italian 2% Slovak 2%
- Foreign-born
- 1% · Canada
- Languages at home
- 98% English-only · Spanish 1%
Political lean MEDSL · Portage
- 2024 margin
- R (+15.5) · D 41.8% · R 57.3%
- 2008→2024 swing
- -24.5pp toward R · 2008: 9.0pp · 2024: -15.5pp
- All cycles
- 2024: R+15.5 2020: R+12.5 2016: R+10.2 2012: D+4.9 2008: D+9.0
Not yet ingested
- Civics
- —
Market trends
- HPI YoY
- ▼ -146.76%
- Current HPI
- 196.8027
- Rent YoY
- —
- Metro
- Akron, OH
- State GDP YoY
- ▲ 1.98%
- F500 in state
- 48
Industry mix (Fortune 500 HQ in OH)
| Industry | F500 HQs | Revenue |
|---|---|---|
| Insurance | 3 | $145B |
|
||
| Industrial Machinery | 3 | $49B |
|
||
| Financial Services | 3 | $24B |
|
||
| Consumer Goods | 2 | $93B |
|
||
| Aerospace / Defense | 2 | $47B |
|
||
| Utilities | 2 | $33B |
|
||
Price history
-17.7% since first listed10 events — show timeline
- 2026-06-12 Listed $69,900 MLSNOW
- 2026-05-06 Listing Removed — MLSNOW
- 2026-04-30 Listed $149,900 MLSNOW
- 2009-03-05 Sold (MLS) $9,450 MLSNOW
- 2008-06-13 Listed $16,000 MLSNOW
- 2006-07-27 Sold (Public Records) $84,000 Public Records
- 2006-01-30 Listing Removed — MLSNOW
- 2005-10-13 Listing Removed — MLSNOW
- 2005-07-30 Listed $82,000 MLSNOW
- 2005-04-13 Listed $84,900 MLSNOW
Property tax history
+3.7%/yrLatest (2025): $1,421 · +17.3% YoY. Source: county tax records.
Cash-flow waterfall
monthlySold comps — $/sqft
last 12 mo · ≤1 miLoading sold comps…