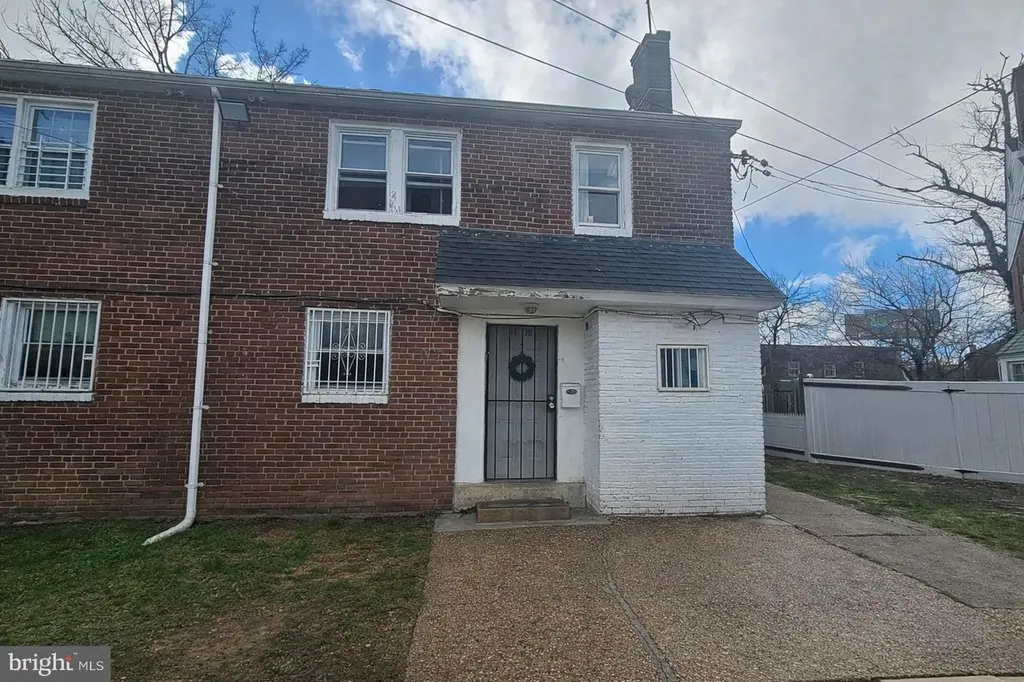
1438 Perkins St · Chester, PA
Flood risk 1/10 · Minimal
- FEMA flood zone
- X (unshaded)
- Chance of flooding over 30 yrs
- 0.0%
- Est. flood insurance / yr
- $507 – $1,088
Fire risk 1/10 · Minimal
- Est. fire insurance / yr
- $511 – $949
Heat risk 7/10 · Major
- Hot days now (above 104°F)
- 7 days/yr
- Hot days in 30 yrs
- 15 days/yr
Wind risk 6/10 · Moderate
- Chance of severe wind over 30 yrs
- 27.0%
Air-quality risk 4/10 · Minor
- Unhealthy air days now
- 4 days/yr
- Unhealthy air days in 30 yrs
- 7 days/yr
Risk factors via First Street. Map © Google.
Why this score? — see what drove the D+ grade
The composite is a weighted blend of 9 inputs, each scored 0–100. Each bar is that input's sub-score; the figure is the points it added to the 100-point composite (weight × sub-score).
- Cash flow +19.6/30.0
- ARV discount +7.5/15.0
- DSCR +6.2/10.0
- 1% rule +5.0/10.0
- Rent growth +4.2/5.0
- Livability +3.7/5.0
- Condition / age +2.5/5.0
- Schools +0.8/10.0
- Appreciation +0.0/10.0
$149,900
🖨 Deal sheet 📄 Offer letter ✓ Due diligence
Listing remarks MLS
Welcome to 1438 Perkins Street in Chester, a well-maintained end unit rowhome offering an excellent opportunity for investors or future owner-occupants. This updated property is currently rented to a long-term tenant and has been well cared for throughout ownership. The home features a bright and functional kitchen, a combination of tile and hardwood flooring, and comfortable living spaces. Enjoy the rear yard, perfect for outdoor use or additional storage. Conveniently located near major roadways, public transportation, shopping, and local amenities, this solid property delivers strong rental potential and dependable condition.
Key facts
- Parking
- Built 1943
- Listed 117 days
Neighborhood map
What this means for you Summary
Snapshot
- This is a 3-bed/1.0-bath townhouse listed at $150k.
Deal economics
- At list price, monthly cash flow is $173 ($2k/yr) — positive.
- The deal already cash-flows at list — no discount required.
- To meet the 1% rule (rent ≥ 1% of price), the offer needs to be $149k (0.4% below list).
- Recommended offer: $136k (9.0% below list) — sets the bar for market timing.
Location & tenants
- Location reads 73/100 on livability (#540 in PA) — a middle-class / working-renter tenant base. Strengths: amenities A+, commute A+, cost of living A+; Watch: schools F, crime F, employment F.
- Chester-Upland SD (suburban): math 4% / reading 17% proficiency, ranked #533 of 539 in PA (top 99%) — low school quality limits family demand, transient renter base, plan for 1-2y turnover; 81% free/reduced lunch — lower-income household profile, screen leases tightly.
- Market conditions: Rents rising fast (+6.9%/yr); 138 active listings in the ZIP; 16 comparable units currently listed for rent nearby; rentals at typical pace (median 21d on market — plan ~3-4 weeks tenant-placement turnaround); lower-income renter base — watch delinquency; 299 units permitted in Delaware County in 2024 (5 in 5+ unit buildings).
- This rent runs 43% of the median local income ($41k/yr) — at the standard rent-burdened threshold; future hikes will face affordability resistance.
Forward outlook
- Local home prices are declining (-3.0%/yr); year-one equity from $1k of loan paydown is wiped out by about $4k of value loss. Plan a longer hold.
- At projected returns (-3.0% appreciation + 6.9% rent growth), your $42k cash investment doubles in ~10 years — after that, you're playing with house money.
Negotiation context
- It's been on market 117 days — a 9% lower offer ($136k) is reasonable based on typical stale-listing flexibility.
Risks & watch-outs
- Watch-outs: built in 1943 — expect roof / HVAC / electrical / plumbing capex.
- Climate carrying-cost: major wind risk, 27% chance of damaging wind over 30y; extreme-heat days projected 7→15/yr by 2055 (HVAC capex compounding) — expect insurance premiums to compound above CPI over the hold.
Questions for the listing agent
- It's been on market 117 days. Have you received any prior offers? Is the seller open to a 9% concession, seller financing, or rate buy-down credit?
- Built in 1943 — when were the roof, HVAC, electrical panel, plumbing, and water heater last replaced?
- Why hasn't it sold? Are there any deal-killer items the seller is aware of (foundation, flood, title, zoning, code violations)?
- Is there a deadline driving the sale (1031 exchange, divorce, estate, relocation)? That informs how much negotiation room exists.
- Schools are F-rated, which usually means shorter tenancies and higher turnover. Who's the typical renter profile here, and what's been the actual vacancy rate?
- Crime grade is F in this area — have there been break-ins, vandalism, or insurance claims at this property in the last 3 years? What carrier currently insures it and at what premium?
- The area grade is low — what's the realistic commute time and amenity access for the typical tenant pool here? Any planned neighborhood developments (good or bad) we should know about?
- What's the average days-on-market for RENTAL listings here right now (not sales)? A rising rental-DOM trend means longer vacancies and softer asking-rent achievability than the comps imply.
- What's the recent tenant-quality profile in this submarket — average credit score on applications, eviction rate, late-payment / NSF rate, and stable-employment percentage? A property-management company in the area should have these aggregated.
- How much new for-sale + rental construction is in the pipeline within 1–3 miles? Heavy new supply typically softens prices + rents 12–24 months out; constrained supply supports both.
Investment metrics
- 1% rule
- 1.00% ✗
- Cap rate
- 7.68%
- Cash-on-cash
- 4.95%
- DSCR
- 1.22
- GRM
- 8.4
CMA / ARV
- ARV (median comp)
- $85,887
- List price
- $149,900
- Delta
- 74.53%
- Verdict
- OVERPRICED
- Comps
- 20 within 1.0 mi
Show comp detail 12 sales within ~0.75 mi
| Address | Dist | Beds/Ba | Sqft | Sold | Price | $/sf | Match |
|---|---|---|---|---|---|---|---|
| 1305 Highland Ave | 0.17mi | 3/1.0 | 1,210 (-1%) | 4mo | $125,000 | $103 | 87 |
| 1405 Highland Ave | 0.09mi | 4/1.0 (+1) | 1,210 (-1%) | 4mo | $60,000 | $50 | 86 |
| 2719 Bethel Rd | 0.16mi | 3/1.0 | 1,210 (-1%) | 9mo | $71,500 | $59 | 84 |
| 2624 Mccarey St | 0.31mi | 3/1.0 | 1,210 (-1%) | 6mo | $75,000 | $62 | 80 |
| 2603 Swarts St | 0.21mi | 3/1.0 | 1,196 (-2%) | 11mo | $140,000 | $117 | 78 |
| 3339 Carter Ln | 0.23mi | 3/1.5 | 1,216 (-0%) | 11mo | $170,000 | $140 | 78 |
| 1326 Renshaw Rd | 0.33mi | 3/1.5 | 1,216 (-0%) | 11mo | $172,000 | $141 | 73 |
| 2610 W 7th St | 0.54mi | 3/1.0 | 1,280 (+5%) | 2mo | $81,000 | $63 | 65 |
| 2611 W 6th St | 0.62mi | 3/1.0 | 1,172 (-4%) | 1mo | $72,000 | $61 | 64 |
| 3011 W 7th St | 0.55mi | 3/1.0 | 1,088 (-11%) | 3mo | $120,000 | $110 | 54 |
| 708 Ward St | 0.54mi | 3/2.0 | 1,353 (+11%) | 2mo | $170,000 | $126 | 51 |
| 715 Engle St | 0.68mi | 3/2.0 | 1,268 (+4%) | 10mo | $130,000 | $103 | 50 |
Match score weights: distance 35% · size 25% · config 20% · recency 20%. Top-matched comps best support the ARV.
Projected returns pro-forma
-3.0% appreciation · 6.88% rent growth · sell at horizon
- IRR
- -4.4%
- Equity multiple
- 0.83×
- Total profit
- $-7,203
- Equity at exit
- $22,351
- IRR
- 9.2%
- Equity multiple
- 1.83×
- Total profit
- $34,862
- Equity at exit
- $12,961
Cash invested: $41,972 (down + closing). Projections, not guarantees.
Landlord ↔ Tenant lean methodology
- Overall (STATE)
- 62 Landlord-Friendly
- State Pennsylvania
- 62 Landlord-Friendly · EVEN
- County
- — inherits STATE
- City
- — inherits STATE
ZIP-level market 19013
- Rents YoY
- 6.9%
- Active inventory
- 138
- Price-to-rent
- 8.4×
Monthly cashflow live
- Estimated rent
- $1,493 high interval (Pro) →
- Mortgage (P&I)
- −$786
- Tax from tax record
- −$158 /mo · $1,891/yr
- Insurance
- −$62
- HOA
- −$0
- Vacancy / Maint / Mgmt
- −$313
- Net cashflow
- $173
Break-even live
UW: 25.0% down · 7.5% · 30yr · 1.5% tax · 5.0% vac · 8.0% maint · 8.0% mgmt
Financing live
Cash to close
- Down payment
- $37,475
- Closing costs
- $4,497
- Reserves months
- —
- Total cash needed
- —
Loan-product check · same deal, 3 products live
Conventional
25% down · 7.5% · 30yr
- Down + closing
- —
- Monthly P&I
- —
- Monthly cashflow
- —
- DSCR
- —
- Eligible?
- —
Personal DTI + credit; lowest rate.
DSCR
20% down · 8.5% · 30yr
- Down + closing
- —
- Monthly P&I
- —
- Monthly cashflow
- —
- DSCR
- —
- Eligible?
- —
No personal income docs; deal must DSCR.
Hard money
10% down · 12.0% · 12mo
- Down + closing
- —
- Monthly P&I
- —
- Monthly cashflow
- —
- DSCR
- —
- Eligible?
- —
Short-term bridge; refi at stabilization.
Rent comps 16 comps
| Address | Beds | Baths | Sqft | Rent | $/sqft | DOM | Units | Dist |
|---|---|---|---|---|---|---|---|---|
| 1127 Ward St Chester, PA | 2.0 | 1.0 | 800 | $1,250 | $1.56 | 8d | 1 | 0.27mi |
| 3312 W 13th St Chester, PA | 2.0 | 1.0 | 936 | $1,499 | $1.60 | 22d | 1 | 0.29mi |
| 1107-1115 Keystone Rd Chester, PA | 2.0 | 1.0 | 700 | $1,250 | $1.79 | 44d | 1 | 0.45mi |
| 1006 Keystone Rd Chester, PA | 2.0 | 1.0 | 750 | $1,200 | $1.60 | 24d | 1 | 0.49mi |
| 908 Keystone Rd Chester, PA | 2.0 | 1.0 | 750 | $1,200 | $1.60 | 44d | 1 | 0.50mi |
| 906 Keystone Rd Chester, PA | 2.0 | 1.0 | 800 | $1,200 | $1.50 | 22d | 1 | 0.50mi |
| 906 Keystone Rd Unit 1 Chester, PA | 2.0 | 1.0 | 800 | $1,200 | $1.50 | 24d | 1 | 0.50mi |
| 2832 W 6th St Unit 306 Chester, PA | 3.0 | 1.0 | 1428 | $1,500 | $1.05 | 4d | 1 | 0.56mi |
| 425 Highland Ave Apt A Chester, PA | 2.0 | 1.5 | 990 | $1,000 | $1.01 | 20d | 1 | 0.68mi |
| 1315 Harshaw Rd Brookhaven, PA | 3.0 | 2.5 | 1260 | $2,395 | $1.90 | 1d | 1 | 1.06mi |
| 1224 Elson Rd Brookhaven, PA | 3.0 | 2.0 | 1200 | $1,900 | $1.58 | 17d | 1 | 1.13mi |
| 151 Chadwick Ave Marcus Hook, PA | 3.0 | 1.5 | 1080 | $1,600 | $1.48 | 11d | 1 | 1.39mi |
| 119 E Laughead Ave Marcus Hook, PA | 3.0 | 1.5 | 1080 | $1,530 | $1.42 | 4d | 1 | 1.42mi |
| 130 Harvey Ave Unit 1 Linwood, PA | 3.0 | 1.0 | 1173 | $1,750 | $1.49 | 10d | 1 | 1.44mi |
| 117 Ervin Ave Marcus Hook, PA | 3.0 | 1.5 | 720 | $1,595 | $2.22 | 20d | 1 | 1.44mi |
| 925 W 3rd St Chester, PA | 4.0 | 1.0 | 1500 | $1,700 | $1.13 | 18d | 1 | 1.49mi |
Listing history 2 events
-
2026-05-31days on market $149,900 Active 117 DOM
-
2026-02-03$149,900 Active 636-char remark
Show marketing remark (636 chars)
Welcome to 1438 Perkins Street in Chester, a well-maintained end unit rowhome offering an excellent opportunity for investors or future owner-occupants. This updated property is currently rented to a long-term tenant and has been well cared for throughout ownership. The home features a bright and functional kitchen, a combination of tile and hardwood flooring, and comfortable living spaces. Enjoy the rear yard, perfect for outdoor use or additional storage. Conveniently located near major roadways, public transportation, shopping, and local amenities, this solid property delivers strong rental potential and dependable condition.
ⓘ Source: listings_history table (triggers on properties + properties_extension) + one-shot
backfill from property_details.listing_events for pre-trigger history.
Tax reassessment forecast PA · Partial reset (capped growth)
- Current annual tax
- $1,891 · $158/mo
- Projected year-2 tax
- $2,130 · $177/mo
- Expected delta
- +$239/yr (+$20/mo · 12.6%)
ⓘ Screening estimate from a state-policy table — verify with the county assessor before closing.
Climate risk First Street
- Flood 1/10 Low FEMA zone X (unshaded) · 0% chance over 30 yrs
- Wildfire 1/10 Low
- Heat 7/10 Severe 7 d/yr ≥104°F today · 15 d/yr by 30 yrs out
- Wind 6/10 Major 27% chance of damaging wind over 30 yrs
- Air quality 4/10 Moderate 4 unhealthy d/yr today · 7 by 30 yrs out
Nearby sold comps map
Loading sold comps map…
Walkable amenities ~0.75 mi
Loading nearby amenities…
Taxation est. · year 1
- Rental income
- $17,913
- − Mortgage interest
- −$8,397
- − Property taxes
- −$1,891
- − Insurance
- −$750
- − Repairs & maintenance
- −$1,433
- − Management
- −$1,433
- − Depreciation
- −$4,361
- Taxable loss
- −$351
- Est. tax savings @ 24.0%
- +$84
- After-tax cash flow
- $2,162/yr
For passive investors: Depreciation is non-cash, so a rental often shows a tax loss while cash-flowing — sheltering income. Rental losses are passive: they offset passive income freely, and up to $25,000/yr can offset ordinary (W-2) income if you actively participate and your MAGI is under $100k (phasing out to $0 by $150k); unused losses carry forward. On sale, claimed depreciation is recaptured at up to 25%, and gains may owe capital-gains tax (a 1031 exchange can defer both). Figures are a year-1 estimate at your 24.0% rate — not tax advice; consult a CPA.
Schools (NCES district)
- District
- Chester-Upland SD
- NCES district ID
- 4205860
- Math proficiency
- 4% ▼ -3.00%
- Reading proficiency
- 17% ▼ -6.00%
- Median HH income
- $29,790
- Composite
- 8.05/100
- National rank
- #9918
- State rank
- #533 of 539 in PA
Livability — Chester
- Score
- 73/100
- State rank
- #540
- US rank
- #5053
Category grades
Schools grade is shown separately in the Schools card above.
Census & demographics
- Census place
- Chester, PA
- County
- Delaware County · 399,863 people
- City population
- 35,064
- Metro
- Philadelphia-Camden-Wilmington, PA-NJ-DE-MD
- Population (ZIP)
- 35,064
- Household income
- $41,261
- Rent vs Own
- Severe rent burden
- 2668.0
Population outlook (Delaware County) Hauer SSP2
- Today (2025)
- 577,490 people
- By 2030
- 581,243 · +0.6%
- By 2040
- 584,700 · +1.2%
- By 2050
- 586,581 · +1.6%
- By 2075
- 598,706 · +3.7%
- By 2100
- 590,823 · +2.3%
Race, ethnicity, and origin ACS 2023
- Neighborhood character
- Predominantly Black (71%)
- Race & ethnicity
- Black 71% White 14% Hispanic / Latino 9% Two or more races 4%
- Hispanic origin (detail)
- Puerto Rican 6%
- Common ancestry
- Romanian 2%
- Foreign-born
- 4% · Canada
- Languages at home
- 92% English-only · Spanish 6%
Political lean MEDSL · Delaware
- 2024 margin
- Strong D (+23.7) · D 61.4% · R 37.6% · Other 1.0%
- 2008→2024 swing
- +2.3pp toward D · 2008: 21.4pp · 2024: 23.7pp
- All cycles
- 2024: D+23.7 2020: D+26.7 2016: D+22.0 2012: D+21.8 2008: D+21.4
Not yet ingested
- Civics
- —
Market trends
- HPI YoY
- ▼ -149.69%
- Current HPI
- 219.5173
- Rent YoY
- ▲ 6.88%
- Metro
- Philadelphia-Camden-Wilmington, PA-NJ-DE-MD
- State GDP YoY
- ▲ 1.68%
- F500 in state
- 34
Industry mix (Fortune 500 HQ in PA)
| Industry | F500 HQs | Revenue |
|---|---|---|
| Healthcare | 2 | $309B |
|
||
| Insurance | 2 | $27B |
|
||
| Telecommunications / Media | 1 | $124B |
|
||
| Industrial Distribution | 1 | $22B |
|
||
| Financial Services | 1 | $20B |
|
||
| Chemicals / Materials | 1 | $18B |
|
||
Price history
1 event — show timeline
- 2026-02-03 Listed $149,900 BRIGHT MLS
Property tax history
+24.0%/yrLatest (2026): $1,891 · +143.3% YoY. Source: county tax records.
Cash-flow waterfall
monthlySold comps — $/sqft
last 12 mo · ≤1 miLoading sold comps…