5187 Dostie S · Jacksonville, FL
Flood risk 4/10 · Minor
- FEMA flood zone
- X (unshaded)
- Chance of flooding over 30 yrs
- 0.13%
- Est. flood insurance / yr
- $507 – $1,088
Fire risk 2/10 · Minimal
- Est. fire insurance / yr
- $947 – $1,759
Heat risk 9/10 · Severe
- Hot days now (above 107°F)
- 7 days/yr
- Hot days in 30 yrs
- 20 days/yr
Wind risk 9/10 · Severe
- Chance of severe wind over 30 yrs
- 99.0%
Air-quality risk 4/10 · Minor
- Unhealthy air days now
- 6 days/yr
- Unhealthy air days in 30 yrs
- 6 days/yr
Risk factors via First Street. Map © Google.
Why this score? — see what drove the B grade
The composite is a weighted blend of 9 inputs, each scored 0–100. Each bar is that input's sub-score; the figure is the points it added to the 100-point composite (weight × sub-score).
- Cash flow +30.0/30.0
- DSCR +10.0/10.0
- 1% rule +9.3/10.0
- ARV discount +7.5/15.0
- Livability +4.2/5.0
- Schools +3.9/10.0
- Rent growth +3.0/5.0
- Condition / age +2.5/5.0
- Appreciation +0.0/10.0
$120,000
🖨 Deal sheet 📄 Offer letter ✓ Due diligence
Listing remarks MLS
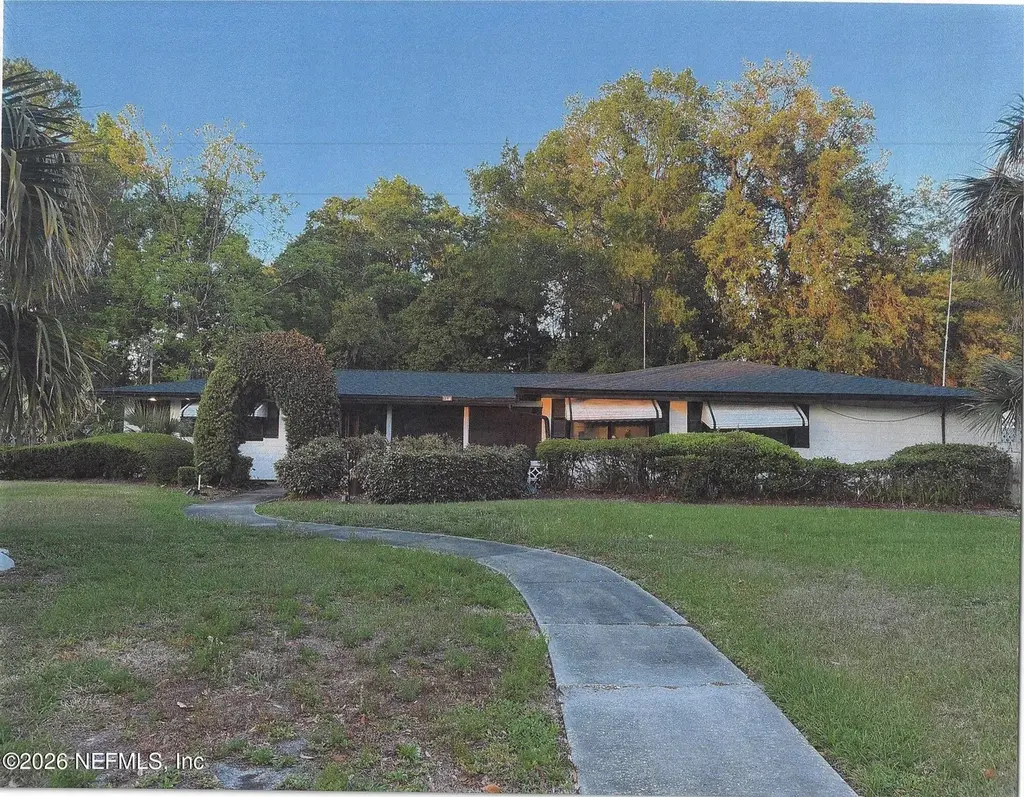
GREAT HOME IN AN ESTABLISHED COMMINITY, HOME ON THE CORNER WITH NICE TREES AND A SIDE TWO CAR GARAGE.
Key facts
- 0.25 acre lot
- 2 garage spots
- Built 1964
Neighborhood map
What this means for you Summary
Snapshot
- This is a 4-bed/3.0-bath single-family listed at $120k.
Deal economics
- At list price, monthly cash flow is $567 ($7k/yr) — positive.
- The deal already cash-flows at list — no discount required.
- Meets the 1% rule at list price ($2k rent vs $120k).
- Cap rate 12.0% vs local median 4.0% in Jacksonville — top-decile yield for the area; either an underpriced asset or a hidden risk that comps aren't pricing in. Stress-test before assuming the spread holds.
Location & tenants
- Location reads 83/100 on livability (#50 in FL, #911 nationally) — a professional / high-income tenant draw. Strengths: amenities A+, commute A+, housing A+.
- Duval (urban): math 46% / reading 45% proficiency, ranked #48 of 73 in FL (top 66%) — families likely to look elsewhere, expect single-tenant / working-renter base with shorter leases.
- Market conditions: Rents rising (+1.8%/yr); 394 active listings in the ZIP; 13 comparable units currently listed for rent nearby; rentals at typical pace (median 20d on market — plan ~3-4 weeks tenant-placement turnaround); lower-income renter base — watch delinquency; 6,503 units permitted in Duval County in 2024 (1,131 in 5+ unit buildings).
- At $1,714/mo this rent would consume 67% of the median local household income ($31k/yr) (locally 2921% of renters already pay >50% of income on rent) — very limited rent-growth headroom before tenants either downsize or default.
Forward outlook
- Local home prices are declining (-3.0%/yr); year-one equity from $830 of loan paydown is wiped out by about $4k of value loss. Plan a longer hold.
- Duval County population projected at +19% by 2050 — long-run rental-demand tailwind backs the buy-and-hold thesis.
- At projected returns (-3.0% appreciation + 1.8% rent growth), your $34k cash investment doubles in ~7 years — after that, you're playing with house money.
Negotiation context
- Only 1 days on market — expect competitive offers; lowballing is unlikely to land.
- 3 sale attempts since 15y ago with the ask held roughly flat each time — persistent listings suggest the price (not the market) is what's stuck; bring a comps-based counter.
- Current owner paid $80k; list at $120k implies a 50% gain — meaningful room to come down on a strong offer.
Risks & watch-outs
- Climate carrying-cost: severe wind risk, 99% chance of damaging wind over 30y; extreme-heat days projected 7→20/yr by 2055 (HVAC capex compounding) — expect insurance premiums to compound above CPI over the hold.
Questions for the listing agent
- Built in 1964 — when were the roof, HVAC, electrical panel, plumbing, and water heater last replaced?
- Is there a deadline driving the sale (1031 exchange, divorce, estate, relocation)? That informs how much negotiation room exists.
- Schools are B-rated — typically a magnet for longer-tenancy family renters. What's the average tenant stay here, and is there a school-zone premium baked into asking?
- What's the average days-on-market for RENTAL listings here right now (not sales)? A rising rental-DOM trend means longer vacancies and softer asking-rent achievability than the comps imply.
- What's the recent tenant-quality profile in this submarket — average credit score on applications, eviction rate, late-payment / NSF rate, and stable-employment percentage? A property-management company in the area should have these aggregated.
- How much new for-sale + rental construction is in the pipeline within 1–3 miles? Heavy new supply typically softens prices + rents 12–24 months out; constrained supply supports both.
Investment metrics
- 1% rule
- 1.43% ✓
- Cap rate
- 11.96%
- Cash-on-cash
- 20.25%
- DSCR
- 1.90
- GRM
- 5.8
CMA / ARV
- ARV (on-the-fly)
- $288,312
- Comps found
- 12
Show comp detail 12 sales within ~0.75 mi
| Address | Dist | Beds/Ba | Sqft | Sold | Price | $/sf | Match |
|---|---|---|---|---|---|---|---|
| 5226 Dostie Dr | 0.06mi | 3/2.5 (-1) | 1,804 (+3%) | 7mo | $267,500 | $148 | 80 |
| 4924 Vermont Rd | 0.34mi | 4/2.0 | 1,640 (-7%) | 2mo | $229,900 | $140 | 68 |
| 4924 Hampshire Dr | 0.49mi | 4/3.0 | 1,670 (-5%) | 4mo | $203,900 | $122 | 65 |
| 7388 Simms Dr | 0.13mi | 4/2.0 | 1,525 (-13%) | 5mo | $250,000 | $164 | 64 |
| 7500 Queensgate Cir | 0.37mi | 4/2.0 | 1,607 (-9%) | 4mo | $299,990 | $187 | 61 |
| 7496 Queensgate Cir | 0.38mi | 4/2.0 | 1,607 (-9%) | 7mo | $290,990 | $181 | 58 |
| 7476 Queensgate Cir | 0.42mi | 4/2.0 | 1,600 (-9%) | 5mo | $280,000 | $175 | 57 |
| 7442 Richardson Rd | 0.28mi | 4/2.0 | 1,525 (-13%) | 5mo | $290,000 | $190 | 56 |
| 7471 Queensgate Cir | 0.42mi | 4/2.0 | 1,607 (-9%) | 8mo | $292,990 | $182 | 55 |
| 6632 Kinlock Dr W | 0.70mi | 3/3.0 (-1) | 1,860 (+6%) | 8mo | $232,500 | $125 | 46 |
| 7836 Smart Ave | 0.75mi | 3/2.0 (-1) | 1,813 (+3%) | 7mo | $285,000 | $157 | 45 |
| 7143 Rhode Island Dr E | 0.45mi | 3/1.0 (-1) | 1,524 (-13%) | 7mo | $80,000 | $52 | 38 |
Match score weights: distance 35% · size 25% · config 20% · recency 20%. Top-matched comps best support the ARV.
Projected returns pro-forma
-3.0% appreciation · 1.81% rent growth · sell at horizon
- IRR
- 11.2%
- Equity multiple
- 1.44×
- Total profit
- $14,633
- Equity at exit
- $17,892
- IRR
- 19.2%
- Equity multiple
- 2.52×
- Total profit
- $51,108
- Equity at exit
- $10,375
Cash invested: $33,600 (down + closing). Projections, not guarantees.
Landlord ↔ Tenant lean methodology
- Overall (STATE)
- 87 Strongly Landlord-Friendly
- State Florida
- 87 Strongly Landlord-Friendly · R+3
- County
- — inherits STATE
- City
- — inherits STATE
ZIP-level market 32209
- Home prices YoY
- -22.1%
- Rents YoY
- 1.8%
- Active inventory
- 394
- Price-to-rent
- 5.8×
Monthly cashflow live
- Estimated rent
- $1,714 high interval (Pro) →
- Mortgage (P&I)
- −$629
- Tax from tax record
- −$108 /mo · $1,297/yr
- Insurance
- −$50
- HOA
- −$0
- Vacancy / Maint / Mgmt
- −$360
- Net cashflow
- $567
Break-even live
UW: 25.0% down · 7.5% · 30yr · 1.5% tax · 5.0% vac · 8.0% maint · 8.0% mgmt
Financing live
Cash to close
- Down payment
- $30,000
- Closing costs
- $3,600
- Reserves months
- —
- Total cash needed
- —
Loan-product check · same deal, 3 products live
Conventional
25% down · 7.5% · 30yr
- Down + closing
- —
- Monthly P&I
- —
- Monthly cashflow
- —
- DSCR
- —
- Eligible?
- —
Personal DTI + credit; lowest rate.
DSCR
20% down · 8.5% · 30yr
- Down + closing
- —
- Monthly P&I
- —
- Monthly cashflow
- —
- DSCR
- —
- Eligible?
- —
No personal income docs; deal must DSCR.
Hard money
10% down · 12.0% · 12mo
- Down + closing
- —
- Monthly P&I
- —
- Monthly cashflow
- —
- DSCR
- —
- Eligible?
- —
Short-term bridge; refi at stabilization.
Rent comps 13 comps
| Address | Beds | Baths | Sqft | Rent | $/sqft | DOM | Units | Dist |
|---|---|---|---|---|---|---|---|---|
| 4910 Rhode Island Dr N Jacksonville, FL | 3.0 | 2.0 | 1300 | $1,696 | $1.30 | 23d | 1 | 0.34mi |
| 6623 Kinlock Dr W Jacksonville, FL | 3.0 | 2.5 | 2081 | $1,610 | $0.77 | 4d | 1 | 0.67mi |
| 6412 New Kings Rd Unit 2 Jacksonville, FL | 3.0 | 2.0 | 1300 | $1,400 | $1.08 | 17d | 1 | 0.77mi |
| 4895 Churchill Dr Jacksonville, FL | 3.0 | 2.0 | 1303 | $1,900 | $1.46 | 23d | 1 | 0.88mi |
| 6188 Pettiford Dr W Jacksonville, FL | 3.0 | 2.0 | 1499 | $1,850 | $1.23 | 12d | 1 | 0.90mi |
| 8534 Addison Rd Jacksonville, FL | 4.0 | 2.0 | 1410 | $1,995 | $1.41 | 23d | 1 | 0.97mi |
| 8509 Addison Rd Jacksonville, FL | 4.0 | 2.0 | 1494 | $1,675 | $1.12 | 23d | 1 | 0.99mi |
| 8367 Tubman Ct Jacksonville, FL | 4.0 | 1.5 | 1398 | $1,790 | $1.28 | 17d | 1 | 1.13mi |
| 8516 Bermuda Rd Jacksonville, FL | 3.0 | 2.0 | 1492 | $1,625 | $1.09 | 20d | 1 | 1.18mi |
| 9340 Sibbald Rd Jacksonville, FL | 4.0 | 2.0 | 1228 | $1,606 | $1.31 | 3d | 1 | 1.44mi |
| 4737 Portsmouth Ave Jacksonville, FL | 4.0 | 2.0 | 1396 | $1,148 | $0.82 | 23d | 1 | 1.47mi |
| 5814 Begonia Rd Unit 1 Jacksonville, FL | 3.0 | 1.5 | 1500 | $1,655 | $1.10 | 23d | 1 | 1.48mi |
| 3528 Mildred Way Jacksonville, FL | 4.0 | 3.0 | 1965 | $1,999 | $1.02 | 17d | 1 | 1.49mi |
Listing history 8 events
-
2026-04-18status Pending
-
2026-04-16$120,000 Active
-
2012-05-23historical 101-char remark
Show marketing remark (101 chars)
GREAT HOME IN AN ESTABLISHED COMMINITY, HOME ON THE CORNER WITH NICE TREES AND A SIDE TWO CAR GARAGE.
-
2012-04-05soldstatus $80,000
-
2012-03-30soldstatus $80,000 101-char remark
Show marketing remark (101 chars)
GREAT HOME IN AN ESTABLISHED COMMINITY, HOME ON THE CORNER WITH NICE TREES AND A SIDE TWO CAR GARAGE.
-
2011-11-21$85,000 101-char remark
Show marketing remark (101 chars)
GREAT HOME IN AN ESTABLISHED COMMINITY, HOME ON THE CORNER WITH NICE TREES AND A SIDE TWO CAR GARAGE.
-
2011-10-18historical 218-char remark
Show marketing remark (218 chars)
Great home in well established area of North Jacksonville. Corner lot with beautiful trees and landscaping. Spacious sq. footage, full equipped kitchen and 2 car garage are just a few of the extras. Thanks for showing.
-
2011-04-18$89,900 218-char remark
Show marketing remark (218 chars)
Great home in well established area of North Jacksonville. Corner lot with beautiful trees and landscaping. Spacious sq. footage, full equipped kitchen and 2 car garage are just a few of the extras. Thanks for showing.
ⓘ Source: listings_history table (triggers on properties + properties_extension) + one-shot
backfill from property_details.listing_events for pre-trigger history.
Tax reassessment forecast FL · Resets to sale price
- Current annual tax
- $1,297 · $108/mo
- Projected year-2 tax
- $1,297 · $108/mo
- Expected delta
- $0/yr ($0/mo · 0.0%)
ⓘ Screening estimate from a state-policy table — verify with the county assessor before closing.
Climate risk First Street
- Flood 4/10 Moderate FEMA zone X (unshaded) · 13% chance over 30 yrs
- Wildfire 2/10 Low
- Heat 9/10 Extreme 7 d/yr ≥107°F today · 20 d/yr by 30 yrs out
- Wind 9/10 Extreme 99% chance of damaging wind over 30 yrs
- Air quality 4/10 Moderate 6 unhealthy d/yr today · 6 by 30 yrs out
Nearby sold comps map
Loading sold comps map…
Walkable amenities ~0.75 mi
Loading nearby amenities…
Taxation est. · year 1
- Rental income
- $20,571
- − Mortgage interest
- −$6,722
- − Property taxes
- −$1,297
- − Insurance
- −$600
- − Repairs & maintenance
- −$1,646
- − Management
- −$1,646
- − Depreciation
- −$3,491
- Taxable income
- $5,170
- Est. tax owed @ 24.0%
- −$1,241
- After-tax cash flow
- $5,562/yr
For passive investors: Depreciation is non-cash, so a rental often shows a tax loss while cash-flowing — sheltering income. Rental losses are passive: they offset passive income freely, and up to $25,000/yr can offset ordinary (W-2) income if you actively participate and your MAGI is under $100k (phasing out to $0 by $150k); unused losses carry forward. On sale, claimed depreciation is recaptured at up to 25%, and gains may owe capital-gains tax (a 1031 exchange can defer both). Figures are a year-1 estimate at your 24.0% rate — not tax advice; consult a CPA.
Schools (NCES district)
- District
- Duval
- NCES district ID
- 1200480
- Math proficiency
- 46% ▼ -11.00%
- Reading proficiency
- 45% ▼ -4.00%
- Median HH income
- $48,987
- Composite
- 38.97/100
- National rank
- #4076
- State rank
- #48 of 73 in FL
Livability — Jacksonville
- Score
- 83/100
- State rank
- #50
- US rank
- #911
Category grades
Schools grade is shown separately in the Schools card above.
Census & demographics
- Census place
- Jacksonville, FL
- County
- Duval County · 1,015,274 people
- City population
- 979,034
- Metro
- Jacksonville, FL
- Population (ZIP)
- 34,657
- Household income
- $30,514
- Rent vs Own
- Severe rent burden
- 2921.0
Population outlook (Duval County) Hauer SSP2
- Today (2025)
- 1,013,010 people
- By 2030
- 1,059,228 · +4.6%
- By 2040
- 1,141,439 · +12.7%
- By 2050
- 1,205,258 · +19.0%
- By 2075
- 1,324,282 · +30.7%
- By 2100
- 1,319,620 · +30.3%
Race, ethnicity, and origin ACS 2023
- Neighborhood character
- Predominantly Black (88%)
- Race & ethnicity
- Black 88% White 5% Hispanic / Latino 5% Two or more races 2%
- Hispanic origin (detail)
- Puerto Rican 3%
- Common ancestry
- Hispanic 1% Romanian 1%
- Foreign-born
- 3% · Canada
- Languages at home
- 95% English-only · Spanish 4% French/Haitian/Cajun 1%
Political lean MEDSL · Duval
- 2024 margin
- Toss-up / Even · D 48.7% · R 50.1% · Other 1.2%
- 2008→2024 swing
- +0.4pp no change · 2008: -1.9pp · 2024: -1.5pp
- All cycles
- 2024: R+1.5 2020: D+3.8 2016: R+1.5 2012: R+3.6 2008: R+1.9
Not yet ingested
- Civics
- —
Market trends
- HPI YoY
- ▼ -53.92%
- Current HPI
- 189.5977
- Rent YoY
- ▲ 1.81%
- Metro
- Jacksonville, FL
- State GDP YoY
- ▲ 3.28%
- F500 in state
- 36
Industry mix (Fortune 500 HQ in FL)
| Industry | F500 HQs | Revenue |
|---|---|---|
| Industrial Technology | 2 | $29B |
|
||
| Insurance | 2 | $17B |
|
||
| Retail | 1 | $60B |
|
||
| Technology Distribution | 1 | $58B |
|
||
| Homebuilding | 1 | $35B |
|
||
| Technology Manufacturing | 1 | $35B |
|
||
Price history
+33.5% since first listed8 events — show timeline
- 2026-04-18 Pending — realMLS
- 2026-04-16 Listed $120,000 realMLS
- 2012-05-23 Listing Removed — realMLS
- 2012-04-05 Sold (Public Records) $80,000 Public Records
- 2012-03-30 Sold (MLS) $80,000 realMLS
- 2011-11-21 Listed $85,000 realMLS
- 2011-10-18 Listing Removed — realMLS
- 2011-04-18 Listed $89,900 realMLS
Property tax history
+3.8%/yrLatest (2025): $1,297 · +18.8% YoY. Source: county tax records.
Cash-flow waterfall
monthlySold comps — $/sqft
last 12 mo · ≤1 miLoading sold comps…