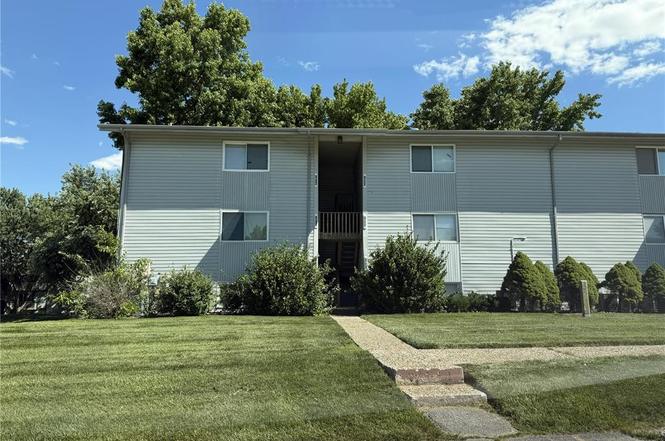
1913 Gascony Parc Dr #1913 · Lake St. Louis, MO
Flood risk 1/10 · Minimal
- FEMA flood zone
- X (unshaded)
- Chance of flooding over 30 yrs
- 0.0%
- Est. flood insurance / yr
- $507 – $1,088
Fire risk 1/10 · Minimal
- Est. fire insurance / yr
- $1,054 – $1,958
Heat risk 5/10 · Moderate
- Hot days now (above 107°F)
- 7 days/yr
- Hot days in 30 yrs
- 20 days/yr
Wind risk 2/10 · Minimal
- Chance of severe wind over 30 yrs
- 1.0%
Air-quality risk 1/10 · Minimal
- Unhealthy air days now
- 0 days/yr
- Unhealthy air days in 30 yrs
- 0 days/yr
Risk factors via First Street. Map © Google.
Why this score? — see what drove the C- grade
The composite is a weighted blend of 9 inputs, each scored 0–100. Each bar is that input's sub-score; the figure is the points it added to the 100-point composite (weight × sub-score).
- Cash flow +16.6/30.0
- 1% rule +8.9/10.0
- ARV discount +7.5/15.0
- DSCR +5.2/10.0
- Schools +4.3/10.0
- Rent growth +3.6/5.0
- Livability +2.5/5.0
- Condition / age +2.5/5.0
- Appreciation +0.0/10.0
$102,500
🖨 Deal sheet (PDF) 📄 Offer letter ✓ Due diligence
Listing remarks
Welcome to easy living in this beautifully updated 1-bedroom, 1-bath condo that perfectly combines style, comfort, and convenience. From the moment you walk through the door, you'll appreciate the modern finishes and thoughtful updates throughout. The stunning kitchen is sure to impress with upgraded cabinetry, gleaming granite countertops, stainless steel appliances, and a classic subway tile backsplash that ties it all together. Luxury vinyl plank flooring flows seamlessly throughout the entire home, creating a clean, contemporary feel. The spacious bedroom offers an oversized closet with exceptional storage, while the updated bathroom features stylish finishes that make everyday living f
Key facts
- Upgraded cabinetry
- Updated kitchen
- Granite countertops
Tags
Property features AI
Finance
- Other: Private ownership; Residential condominium
- HOA & community: Mystic Village Condos association; Monthly HOA fee of $368; HOA covers insurance, water, sewer and trash; Association management; Community pool
Exterior
- Parking: Additional parking available; Assigned parking
- Utilities: Public water; Public sewer; Ameren electric service; Cable available
- Home design: Attached condominium; Apartment building structure; One level
- Construction: Vinyl siding
- Exterior features: Level lot; In-ground pool (association)
Interior
- Kitchen: Dishwasher; Electric range; Disposal
- Bedrooms: 1 bedroom (main level)
- Flooring: Laminate flooring
- Bathrooms: 1 full bathroom (main level)
- Heating & cooling: Forced air heating; Central air conditioning; Electric cooling
- Interior features: Dishwasher; Disposal; Electric range; Electric water heater
- Laundry & utility: Laundry in common area
Neighborhood map
What this means for you Summary
Snapshot
- This is a 1-bed/1.0-bath condo listed at $102k.
Deal economics
- At list price, monthly cash flow is $63 ($754/yr) — positive.
- The deal already cash-flows at list — no discount required.
- Meets the 1% rule at list price ($1k rent vs $102k).
- Cap rate 7.0% vs local median 3.2% in Lake St. Louis — top-decile yield for the area; either an underpriced asset or a hidden risk that comps aren't pricing in. Stress-test before assuming the spread holds.
Location & tenants
- Location reads: area grade C — affects rentability + tenant quality, not the cash-flow math above.
- Wentzville R-IV (suburban): math 44% / reading 52% proficiency, ranked #32 of 324 in MO (top 10%) — families likely to look elsewhere, expect single-tenant / working-renter base with shorter leases; only 18% free/reduced lunch — higher-income household profile.
- Zoned schools: Lakeview Elementary (math 50% / reading 56%, grade C, #221 of 1,115 statewide, top 20%, 630 students, 12% FRL); Wentzville Middle (math 40% / reading 42%, grade F, #172 of 391 statewide, top 46%, 794 students, 19% FRL); Emil E. Holt Sr. High (math 48% / reading 58%, grade C-, #88 of 521 statewide, top 17%, 1,273 students, 12% FRL) — zoned schools at 14% FRL track the district average.
- Market conditions: Rents rising fast (+4.2%/yr); 230 active listings in the ZIP; high-income renter base; 2,021 units permitted in St. Charles County in 2024 (568 in 5+ unit buildings).
- This rent is only 12% of the median local income ($138k/yr) — well below the 30% rent-burden line; pricing power to push rent on renewal without tenant pushback.
Forward outlook
- Local home prices are declining (-3.0%/yr); year-one equity from $709 of loan paydown is wiped out by about $3k of value loss. Plan a longer hold.
- St. Charles County population projected at +22% by 2050 — long-run rental-demand tailwind backs the buy-and-hold thesis.
Negotiation context
- Only 5 days on market — expect competitive offers; lowballing is unlikely to land.
- 2 sale attempts with the ask held roughly flat each time — persistent listings suggest the price (not the market) is what's stuck; bring a comps-based counter.
- Current owner paid $60k; list at $102k implies a 71% gain — meaningful room to come down on a strong offer.
Risks & watch-outs
- Watch-outs: HOA is 26% of rent.
- Climate carrying-cost: extreme-heat days projected 7→20/yr by 2055 (HVAC capex compounding) — expect insurance premiums to compound above CPI over the hold.
Questions for the listing agent
- Built in 1970 — when were the roof, HVAC, electrical panel, plumbing, and water heater last replaced?
- What does the HOA fee cover, when was the last increase, and are there any pending special assessments or reserve-fund shortfalls?
- Any open or pending special assessments — roof, HVAC, plumbing, elevator, façade? What's the per-unit balance and payoff schedule, and is the seller paying it off at close or rolling it to the buyer?
- Is there a deadline driving the sale (1031 exchange, divorce, estate, relocation)? That informs how much negotiation room exists.
- What's the average days-on-market for RENTAL listings here right now (not sales)? A rising rental-DOM trend means longer vacancies and softer asking-rent achievability than the comps imply.
- What's the recent tenant-quality profile in this submarket — average credit score on applications, eviction rate, late-payment / NSF rate, and stable-employment percentage? A property-management company in the area should have these aggregated.
- How much new apartment / multifamily construction is in the pipeline within 1–3 miles? Heavy new supply (>2% of stock underway) typically softens rents 12–24 months out; light construction supports rent growth.
Investment metrics
- 1% rule
- 1.39% ✓
- Cap rate
- 7.03%
- Cash-on-cash
- 2.63%
- DSCR
- 1.12
- GRM
- 6.0
CMA / ARV
No comps found within radius.
Projected returns pro-forma
-3.0% appreciation · 4.21% rent growth · sell at horizon
- IRR
- -9.9%
- Equity multiple
- 0.63×
- Total profit
- $-10,623
- Equity at exit
- $15,283
- IRR
- 1.9%
- Equity multiple
- 1.15×
- Total profit
- $4,221
- Equity at exit
- $8,862
Cash invested: $28,700 (down + closing). Projections, not guarantees.
Landlord ↔ Tenant lean methodology
- Overall (STATE)
- 81 Strongly Landlord-Friendly
- State Missouri
- 81 Strongly Landlord-Friendly · R+10
- County
- — inherits STATE
- City
- — inherits STATE
ZIP-level market 63367
- Rents YoY
- 4.2%
- Active inventory
- 230
- Price-to-rent
- 6.0×
Monthly cashflow live
- Estimated rent
- $1,420 medium interval (Pro) →
- Mortgage (P&I)
- −$538
- Tax from tax record
- −$111 /mo · $1,328/yr
- Insurance
- −$43
- HOA
- −$368
- Vacancy / Maint / Mgmt
- −$298
- Net cashflow
- $63
Break-even live
Sensitivity live
| Price | -10% $121 | -5% $92 | +0% $63 | +5% $34 | +10% $5 |
|---|---|---|---|---|---|
| Rent | -10% $-49 | -5% $7 | +0% $63 | +5% $119 | +10% $175 |
| Rate | -1.0pp $114 | -0.5pp $89 | base $63 | +0.5pp $36 | +1.0pp $9 |
UW: 25.0% down · 7.5% · 30yr · 1.5% tax · 5.0% vac · 8.0% maint · 8.0% mgmt
Financing live
Cash to close
- Down payment
- $25,625
- Closing costs
- $3,075
- Reserves months
- —
- Total cash needed
- —
Loan-product check · same deal, 3 products live
Conventional
25% down · 7.5% · 30yr
- Down + closing
- —
- Monthly P&I
- —
- Monthly cashflow
- —
- DSCR
- —
- Eligible?
- —
Personal DTI + credit; lowest rate.
DSCR
20% down · 8.5% · 30yr
- Down + closing
- —
- Monthly P&I
- —
- Monthly cashflow
- —
- DSCR
- —
- Eligible?
- —
No personal income docs; deal must DSCR.
Hard money
10% down · 12.0% · 12mo
- Down + closing
- —
- Monthly P&I
- —
- Monthly cashflow
- —
- DSCR
- —
- Eligible?
- —
Short-term bridge; refi at stabilization.
HOA detail condo
- Monthly dues
- $368 · $4,416/yr
- Assessments
- None detected in remarks — confirm with the listing agent.
Listing history 4 events
-
2026-06-21days on market $102,500 Active 5 DOM
-
2026-06-18days on market $102,500 Active 2 DOM
-
2026-06-17remarks 699-char remark
-
2026-06-17$102,500 Active 1 DOM
ⓘ Source: listings_history table (triggers on properties + properties_extension) + one-shot
backfill from property_details.listing_events for pre-trigger history.
Tax reassessment forecast MO · Resets to sale price
- Current annual tax
- $1,328 · $111/mo
- Projected year-2 tax
- $1,328 · $111/mo
- Expected delta
- $0/yr ($0/mo · 0.0%)
ⓘ Screening estimate from a state-policy table — verify with the county assessor before closing.
Climate risk First Street
- Flood 1/10 Low FEMA zone X (unshaded) · 0% chance over 30 yrs
- Wildfire 1/10 Low
- Heat 5/10 Major 7 d/yr ≥107°F today · 20 d/yr by 30 yrs out
- Wind 2/10 Low 100% chance of damaging wind over 30 yrs
- Air quality 1/10 Low 0 unhealthy d/yr today · 0 by 30 yrs out
Nearby sold comps map
Loading sold comps map…
Walkable amenities ~0.75 mi
Loading nearby amenities…
Taxation est. · year 1
- Rental income
- $17,039
- − Mortgage interest
- −$5,742
- − Property taxes
- −$1,328
- − Insurance
- −$512
- − Repairs & maintenance
- −$1,363
- − Management
- −$1,363
- − HOA
- −$4,416
- − Depreciation
- −$2,982
- Taxable loss
- −$668
- Est. tax savings @ 24.0%
- +$160
- After-tax cash flow
- $914/yr
For passive investors: Depreciation is non-cash, so a rental often shows a tax loss while cash-flowing — sheltering income. Rental losses are passive: they offset passive income freely, and up to $25,000/yr can offset ordinary (W-2) income if you actively participate and your MAGI is under $100k (phasing out to $0 by $150k); unused losses carry forward. On sale, claimed depreciation is recaptured at up to 25%, and gains may owe capital-gains tax (a 1031 exchange can defer both). Figures are a year-1 estimate at your 24.0% rate — not tax advice; consult a CPA.
Schools (NCES district)
- District
- Wentzville R-IV
- NCES district ID
- 2931650
- Math proficiency
- 44% ▼ -9.00%
- Reading proficiency
- 52% ▼ -7.00%
- Median HH income
- $74,961
- Composite
- 43.49/100
- National rank
- #2994
- State rank
- #32 of 324 in MO
Livability — Lake St. Louis
No livability data for this city. (Only ~50 U.S. cities are tracked.)
Census & demographics
- Census place
- Lake St. Louis, MO
- County
- Saint Charles County · 399,703 people
- City population
- 27,893
- Metro
- St. Louis, MO-IL
- Population (ZIP)
- 29,725
- Household income
- $137,648
- Rent vs Own
- Severe rent burden
- 184.0
Population outlook (St. Charles County) Hauer SSP2
- Today (2025)
- 437,857 people
- By 2030
- 461,707 · +5.4%
- By 2040
- 503,222 · +14.9%
- By 2050
- 534,684 · +22.1%
- By 2075
- 597,047 · +36.4%
- By 2100
- 609,682 · +39.2%
Race, ethnicity, and origin ACS 2023
- Neighborhood character
- Predominantly White (86%)
- Race & ethnicity
- White 86% Two or more races 6% Black 5% Hispanic / Latino 3% Asian 2%
- Common ancestry
- Lithuanian 4% Romanian 4% Italian 3%
- Foreign-born
- 4% · Canada
- Languages at home
- 96% English-only · Spanish 2% Other Indo-European 1%
Political lean MEDSL · St. Charles
- 2024 margin
- R (+17.0) · D 40.8% · R 57.8% · Other 1.4%
- 2008→2024 swing
- -7.2pp toward R · 2008: -9.7pp · 2024: -17.0pp
- All cycles
- 2024: R+17.0 2020: R+17.5 2016: R+26.4 2012: R+21.0 2008: R+9.7
Not yet ingested
- Civics
- —
Market trends
- HPI YoY
- ▼ -165.38%
- Current HPI
- 208.2774
- Rent YoY
- ▲ 4.21%
- Metro
- St. Louis, MO-IL
- State GDP YoY
- ▲ 1.84%
- F500 in state
- 20
Industry mix (Fortune 500 HQ in MO)
| Industry | F500 HQs | Revenue |
|---|---|---|
| Healthcare | 1 | $163B |
|
||
| Insurance | 1 | $21B |
|
||
| Industrial Technology | 1 | $17B |
|
||
| Retail | 1 | $16B |
|
||
| Industrial Distribution | 1 | $10B |
|
||
| Utilities | 1 | $9B |
|
||
Price history
+229.1% since first listed9 events — show timeline
- 2026-06-16 Listed $102,500 MARIS as Distributed by MLS Grid
- 2026-02-27 Price Changed $98,750 MARIS as Distributed by MLS Grid
- 2026-02-08 Price Changed $102,250 MARIS as Distributed by MLS Grid
- 2026-01-29 Price Changed $107,250 MARIS as Distributed by MLS Grid
- 2026-01-21 Listed $109,500 MARIS as Distributed by MLS Grid
- 2006-11-29 Sold (Public Records) $60,000 Public Records
- 1999-03-03 Sold (Public Records) $25,500 Public Records
- 1993-06-01 Sold (Public Records) — Public Records
- 1983-05-01 Sold (Public Records) $31,150 Public Records
Property tax history
+9.2%/yrLatest (2025): $1,328 · +16.8% YoY. Source: county tax records.
Cash-flow waterfall
monthlySold comps — $/sqft
last 12 mo · ≤1 miLoading sold comps…