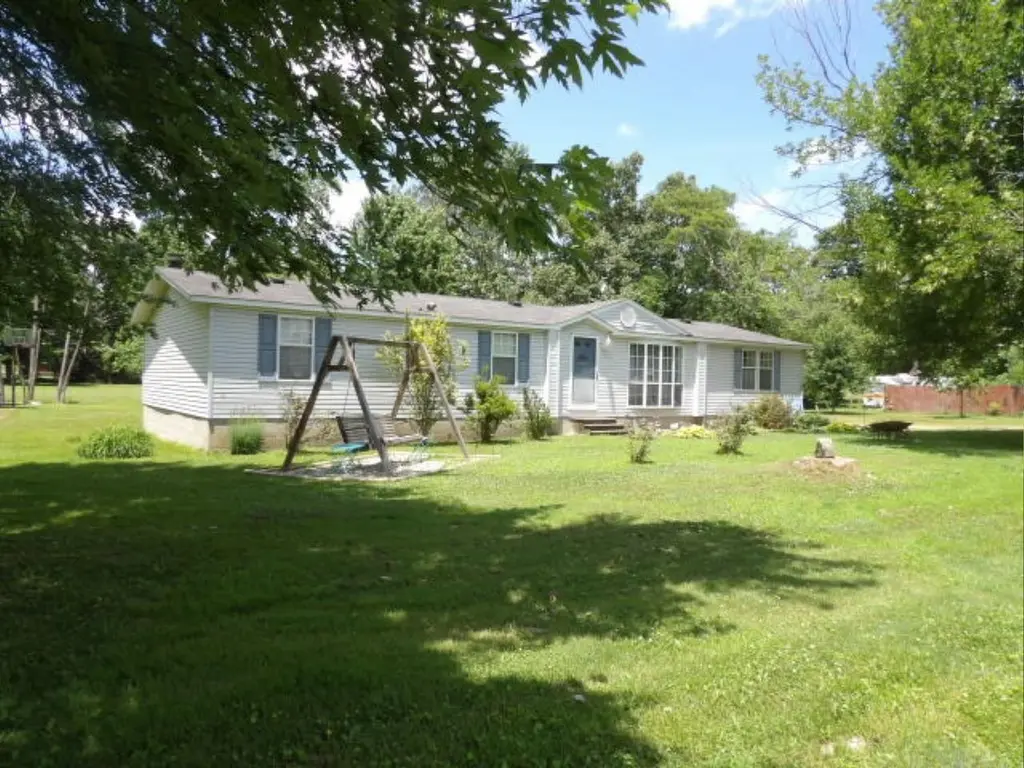
1117 Cannon Ln · Harrisburg, IL
Flood risk No data
- FEMA flood zone
- —
- Chance of flooding over 30 yrs
- %
- Est. flood insurance / yr
- —
Fire risk No data
- Est. fire insurance / yr
- —
Heat risk No data
- Hot days now (above °F)
- days/yr
- Hot days in 30 yrs
- days/yr
Wind risk No data
- Chance of severe wind over 30 yrs
- %
Air-quality risk No data
- Unhealthy air days now
- days/yr
- Unhealthy air days in 30 yrs
- days/yr
Risk factors via First Street. Map © Google.
Why this score? — see what drove the C- grade
The composite is a weighted blend of 9 inputs, each scored 0–100. Each bar is that input's sub-score; the figure is the points it added to the 100-point composite (weight × sub-score).
- Cash flow +25.4/30.0
- DSCR +8.4/10.0
- 1% rule +6.7/10.0
- Livability +3.6/5.0
- Rent growth +2.5/5.0
- Condition / age +2.5/5.0
- Schools +1.3/10.0
- ARV discount +0.0/15.0
- Appreciation +0.0/10.0
$92,000
🖨 Deal sheet 📄 Offer letter ✓ Due diligence
Listing remarks
Spacious 3 Bedroom, 2 Bath Home with split floor plan. Living Room and Family Room with Fireplace. 2 car Det. Garage with Storage and Heated Workshop, all sitting on over an acre of ground. Large Yard.
Key facts
- Split floor plan
- Living room
- Large yard
Tags
Neighborhood map
What this means for you Summary
Snapshot
- This is a 3-bed/2.0-bath single-family listed at $92k.
Deal economics
- At list price, monthly cash flow is $212 ($3k/yr) — positive.
- The deal already cash-flows at list — no discount required.
- Meets the 1% rule at list price ($1k rent vs $92k).
- Cap rate 9.1% vs local median 5.1% in Harrisburg — top-decile yield for the area; either an underpriced asset or a hidden risk that comps aren't pricing in. Stress-test before assuming the spread holds.
Location & tenants
- Location reads 72/100 on livability (#309 in IL) — a middle-class / working-renter tenant base. Strengths: crime A+, cost of living A+, housing A+; Watch: schools F, commute F, employment F.
- Harrisburg CUSD 3 (town): math 5% / reading 25% proficiency, ranked #521 of 620 in IL (top 84%) — low school quality limits family demand, transient renter base, plan for 1-2y turnover.
- Market conditions: 73 active listings in the ZIP.
Forward outlook
- Local home prices are declining (-3.0%/yr); year-one equity from $636 of loan paydown is wiped out by about $3k of value loss. Plan a longer hold.
- Saline County population projected at -16% by 2050 — secular population decline; favor cash flow + early exit over multi-decade hold.
Negotiation context
- Only 6 days on market — expect competitive offers; lowballing is unlikely to land.
Questions for the listing agent
- Is there a deadline driving the sale (1031 exchange, divorce, estate, relocation)? That informs how much negotiation room exists.
- Schools are F-rated, which usually means shorter tenancies and higher turnover. Who's the typical renter profile here, and what's been the actual vacancy rate?
- What's the average days-on-market for RENTAL listings here right now (not sales)? A rising rental-DOM trend means longer vacancies and softer asking-rent achievability than the comps imply.
- What's the recent tenant-quality profile in this submarket — average credit score on applications, eviction rate, late-payment / NSF rate, and stable-employment percentage? A property-management company in the area should have these aggregated.
- How much new for-sale + rental construction is in the pipeline within 1–3 miles? Heavy new supply typically softens prices + rents 12–24 months out; constrained supply supports both.
Investment metrics
- 1% rule
- 1.17% ✓
- Cap rate
- 9.06%
- Cash-on-cash
- 9.88%
- DSCR
- 1.44
- GRM
- 7.1
CMA / ARV
- ARV (on-the-fly)
- $64,512
- Comps found
- 1
Show comp detail 1 sale within ~0.75 mi
| Address | Dist | Beds/Ba | Sqft | Sold | Price | $/sf | Match |
|---|---|---|---|---|---|---|---|
| 2001 Ginko St | 0.72mi | 4/1.5 (+1) | 1,875 (+5%) | 23mo | $68,000 | $36 | 33 |
Match score weights: distance 35% · size 25% · config 20% · recency 20%. Top-matched comps best support the ARV.
Projected returns pro-forma
-3.0% appreciation · 3.0% rent growth · sell at horizon
- IRR
- -1.4%
- Equity multiple
- 0.95×
- Total profit
- $-1,377
- Equity at exit
- $13,717
- IRR
- 8.3%
- Equity multiple
- 1.63×
- Total profit
- $16,269
- Equity at exit
- $7,954
Cash invested: $25,760 (down + closing). Projections, not guarantees.
Landlord ↔ Tenant lean methodology
- Overall (STATE)
- 43 Moderately Tenant-Leaning
- State Illinois
- 43 Moderately Tenant-Leaning · D+7
- County
- — inherits STATE
- City
- — inherits STATE
ZIP-level market 62946
- Active inventory
- 73
- Price-to-rent
- 7.1×
Monthly cashflow live
- Estimated rent
- $1,073 medium interval (Pro) →
- Mortgage (P&I)
- −$482
- Tax est. 1.5%
- −$115 /mo · $1,380/yr
- Insurance
- −$38
- HOA
- −$0
- Vacancy / Maint / Mgmt
- −$225
- Net cashflow
- $212
Break-even live
UW: 25.0% down · 7.5% · 30yr · 1.5% tax · 5.0% vac · 8.0% maint · 8.0% mgmt
Financing live
Cash to close
- Down payment
- $23,000
- Closing costs
- $2,760
- Reserves months
- —
- Total cash needed
- —
Loan-product check · same deal, 3 products live
Conventional
25% down · 7.5% · 30yr
- Down + closing
- —
- Monthly P&I
- —
- Monthly cashflow
- —
- DSCR
- —
- Eligible?
- —
Personal DTI + credit; lowest rate.
DSCR
20% down · 8.5% · 30yr
- Down + closing
- —
- Monthly P&I
- —
- Monthly cashflow
- —
- DSCR
- —
- Eligible?
- —
No personal income docs; deal must DSCR.
Hard money
10% down · 12.0% · 12mo
- Down + closing
- —
- Monthly P&I
- —
- Monthly cashflow
- —
- DSCR
- —
- Eligible?
- —
Short-term bridge; refi at stabilization.
Listing history 2 events
-
2026-06-18remarks 202-char remark
-
2026-06-18$92,000 Active 6 DOM
ⓘ Source: listings_history table (triggers on properties + properties_extension) + one-shot
backfill from property_details.listing_events for pre-trigger history.
Nearby sold comps map
Loading sold comps map…
Walkable amenities ~0.75 mi
Loading nearby amenities…
Taxation est. · year 1
- Rental income
- $12,881
- − Mortgage interest
- −$5,153
- − Property taxes
- −$1,380
- − Insurance
- −$460
- − Repairs & maintenance
- −$1,030
- − Management
- −$1,030
- − Depreciation
- −$2,676
- Taxable income
- $1,150
- Est. tax owed @ 24.0%
- −$276
- After-tax cash flow
- $2,270/yr
For passive investors: Depreciation is non-cash, so a rental often shows a tax loss while cash-flowing — sheltering income. Rental losses are passive: they offset passive income freely, and up to $25,000/yr can offset ordinary (W-2) income if you actively participate and your MAGI is under $100k (phasing out to $0 by $150k); unused losses carry forward. On sale, claimed depreciation is recaptured at up to 25%, and gains may owe capital-gains tax (a 1031 exchange can defer both). Figures are a year-1 estimate at your 24.0% rate — not tax advice; consult a CPA.
Schools (NCES district)
- District
- Harrisburg CUSD 3
- NCES district ID
- 1718270
- Math proficiency
- 5% ▼ -5.00%
- Reading proficiency
- 25% ▼ -9.00%
- Median HH income
- $38,717
- Composite
- 12.61/100
- National rank
- #9613
- State rank
- #521 of 620 in IL
Livability — Harrisburg
- Score
- 72/100
- State rank
- #309
- US rank
- #6073
Category grades
Schools grade is shown separately in the Schools card above.
Census & demographics
- Census place
- Harrisburg, IL
- Population (ZIP)
- 11,465
Population outlook (Saline County) Hauer SSP2
- Today (2025)
- 23,915 people
- By 2030
- 23,262 · -2.7%
- By 2040
- 21,775 · -8.9%
- By 2050
- 20,098 · -16.0%
- By 2075
- 15,234 · -36.3%
- By 2100
- 10,302 · -56.9%
Race, ethnicity, and origin ACS 2023
- Neighborhood character
- Predominantly White (93%)
- Race & ethnicity
- White 93% Two or more races 4% Black 3%
- Common ancestry
- Italian 2% Slovak 2% Serbian 2%
- Foreign-born
- 0%
Political lean MEDSL · Saline
- 2024 margin
- Solid R (+49.0) · D 24.8% · R 73.8% · Other 1.3%
- 2008→2024 swing
- -40.1pp toward R · 2008: -8.9pp · 2024: -49.0pp
- All cycles
- 2024: R+49.0 2020: R+47.9 2016: R+50.7 2012: R+29.0 2008: R+8.9
Not yet ingested
- Civics
- —
Market trends
- HPI YoY
- ▼ -61.20%
- Current HPI
- 102.6962
- Rent YoY
- —
- Metro
- —
- State GDP YoY
- ▲ 1.59%
- F500 in state
- 60
Industry mix (Fortune 500 HQ in IL)
| Industry | F500 HQs | Revenue |
|---|---|---|
| Insurance | 4 | $201B |
|
||
| Consumer Goods | 4 | $87B |
|
||
| Industrial Machinery | 3 | $64B |
|
||
| Healthcare | 2 | $55B |
|
||
| Retail / Pharmacy | 1 | $148B |
|
||
| Agriculture / Food | 1 | $86B |
|
||
Cash-flow waterfall
monthlySold comps — $/sqft
last 12 mo · ≤1 miLoading sold comps…