2115 NW Lynn Rd · Huntsville, AL
Flood risk 1/10 · Minimal
- FEMA flood zone
- X (unshaded)
- Chance of flooding over 30 yrs
- 0.0%
- Est. flood insurance / yr
- $507 – $1,088
Fire risk 3/10 · Minor
- Est. fire insurance / yr
- $916 – $1,700
Heat risk 5/10 · Moderate
- Hot days now (above 104°F)
- 7 days/yr
- Hot days in 30 yrs
- 19 days/yr
Wind risk 4/10 · Minor
- Chance of severe wind over 30 yrs
- 18.0%
Air-quality risk 2/10 · Minimal
- Unhealthy air days now
- 1 days/yr
- Unhealthy air days in 30 yrs
- 1 days/yr
Risk factors via First Street. Map © Google.
Why this score? — see what drove the C- grade
The composite is a weighted blend of 9 inputs, each scored 0–100. Each bar is that input's sub-score; the figure is the points it added to the 100-point composite (weight × sub-score).
- Cash flow +16.1/30.0
- ARV discount +13.6/15.0
- DSCR +5.0/10.0
- Livability +4.1/5.0
- 1% rule +3.6/10.0
- Rent growth +3.0/5.0
- Schools +2.9/10.0
- Condition / age +2.5/5.0
- Appreciation +0.0/10.0
$164,998
🖨 Deal sheet (PDF) 📄 Offer letter ✓ Due diligence
Listing remarks MLS
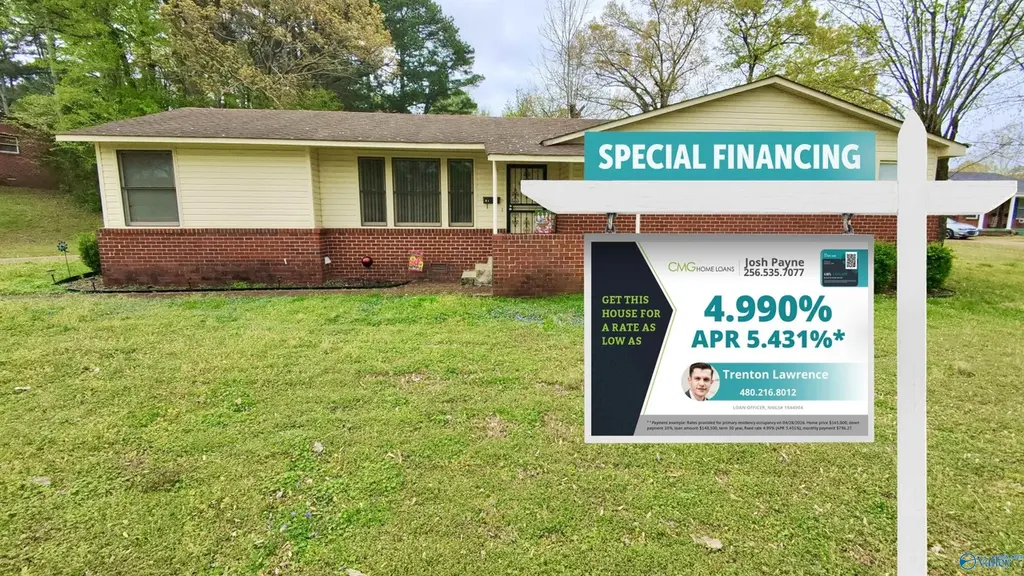
This house comes with a REDUCED RATE as low as 4.99% (APR 5.508%) as of 04/28/2026 through List & Lock™. This is a seller paid rate-buydown that reduces the buyer’s interest rate and monthly payment. Terms apply, see disclosures for more information. This is a well maintained, brick rancher with long term tenants in place. This 3 bed 1.5 bath would be a great addition to your portfolio. The home sits on a huge corner lot, and is walking distance to Alabama A&M. Hardwood floors throughout, one car garage, and a huge shed in the back for extra storage. Sold as is. Please allow 48 hour notice to show the home, tenants are in place.
Key facts
- Brick rancher
- Huge corner lot
- Hardwood floors
Tags
Neighborhood map
What this means for you Summary
Snapshot
- This is a 3-bed/0.5-bath single-family listed at $165k.
Deal economics
- At list price, monthly cash flow is $85 ($1k/yr) — positive.
- The deal already cash-flows at list — no discount required.
- To meet the 1% rule (rent ≥ 1% of price), the offer needs to be $142k (13.7% below list).
- Recommended offer: $142k (13.7% below list) — sets the bar for 1% rule.
- Cap rate 6.9% vs local median 3.8% in Huntsville — top-decile yield for the area; either an underpriced asset or a hidden risk that comps aren't pricing in. Stress-test before assuming the spread holds.
Location & tenants
- Location reads 82/100 on livability (#3 in AL, #1,082 nationally) — a professional / high-income tenant draw. Strengths: commute A+, cost of living A+, housing A+; Watch: crime F.
- Huntsville City (urban): math 21% / reading 46% proficiency, ranked #48 of 129 in AL (top 37%) — families likely to look elsewhere, expect single-tenant / working-renter base with shorter leases.
- Market conditions: Rents rising (+2.1%/yr); 175 active listings in the ZIP; 36 comparable units currently listed for rent nearby; rentals lingering (median 45d on market — plan ~5-8 weeks vacancy on turnover, expect pricing pressure); 53% of comp listings sitting > 30 days — soft ceiling on asking rent; solid renter incomes; 4,709 units permitted in Madison County in 2024 (1,186 in 5+ unit buildings).
- This rent is only 16% of the median local income ($106k/yr) — well below the 30% rent-burden line; pricing power to push rent on renewal without tenant pushback.
Forward outlook
- Local home prices are declining (-3.0%/yr); year-one equity from $1k of loan paydown is wiped out by about $5k of value loss. Plan a longer hold.
- Madison County population projected at +18% by 2050 — long-run rental-demand tailwind backs the buy-and-hold thesis.
Negotiation context
- It's been on market 76 days — a 6% lower offer ($155k) is reasonable based on typical stale-listing flexibility.
- Current owner paid $75k; list at $165k implies a 120% gain — meaningful room to come down on a strong offer.
Risks & watch-outs
- Watch-outs: built in 1957 — expect roof / HVAC / electrical / plumbing capex.
- Climate carrying-cost: extreme-heat days projected 7→19/yr by 2055 (HVAC capex compounding) — expect insurance premiums to compound above CPI over the hold.
Questions for the listing agent
- It's been on market 76 days. Have you received any prior offers? Is the seller open to a 14% concession, seller financing, or rate buy-down credit?
- Built in 1957 — when were the roof, HVAC, electrical panel, plumbing, and water heater last replaced?
- Why hasn't it sold? Are there any deal-killer items the seller is aware of (foundation, flood, title, zoning, code violations)?
- Is there a deadline driving the sale (1031 exchange, divorce, estate, relocation)? That informs how much negotiation room exists.
- Crime grade is F in this area — have there been break-ins, vandalism, or insurance claims at this property in the last 3 years? What carrier currently insures it and at what premium?
- What's the average days-on-market for RENTAL listings here right now (not sales)? A rising rental-DOM trend means longer vacancies and softer asking-rent achievability than the comps imply.
- What's the recent tenant-quality profile in this submarket — average credit score on applications, eviction rate, late-payment / NSF rate, and stable-employment percentage? A property-management company in the area should have these aggregated.
- How much new for-sale + rental construction is in the pipeline within 1–3 miles? Heavy new supply typically softens prices + rents 12–24 months out; constrained supply supports both.
Investment metrics
- 1% rule
- 0.86% ✗
- Cap rate
- 6.91%
- Cash-on-cash
- 2.22%
- DSCR
- 1.10
- GRM
- 9.7
CMA / ARV
- ARV (median comp)
- $190,752
- List price
- $164,998
- Delta
- -13.50%
- Verdict
- UNDERPRICED
- Comps
- 20 within 1.0 mi
Show comp detail 12 sales within ~0.75 mi
| Address | Dist | Beds/Ba | Sqft | Sold | Price | $/sf | Match |
|---|---|---|---|---|---|---|---|
| 4212 NW Lakeview Dr | 0.34mi | 3/1.5 | 1,207 (+1%) | 3mo | $205,000 | $170 | 77 |
| 2118 Medaris Rd NW | 0.37mi | 3/1.0 | 1,237 (+3%) | 1mo | $185,500 | $150 | 74 |
| 2123 Griffith Dr NW | 0.24mi | 3/2.0 | 1,208 (+1%) | 9mo | $180,000 | $149 | 74 |
| 4201 Memorial Parkway North | 0.20mi | 3/2.0 | 1,228 (+3%) | 10mo | $110,000 | $90 | 72 |
| 2419 Tuxedo Dr NW | 0.50mi | 3/1.0 | 1,306 (+9%) | 1mo | $79,000 | $60 | 59 |
| 4604 Rochell Dr | 0.52mi | 3/2.0 | 1,248 (+4%) | 9mo | $210,000 | $168 | 55 |
| 2211 Harris Rd | 0.37mi | 3/1.0 | 1,075 (-10%) | 14mo | $144,643 | $135 | 52 |
| 2240 Kamis Cir NW | 0.37mi | 3/1.0 | 1,021 (-15%) | 9mo | $156,000 | $153 | 48 |
| 2218 Norwood Dr NW | 0.31mi | 3/1.0 | 1,022 (-15%) | 15mo | $165,000 | $161 | 47 |
| 3604 N Memorial Parkway North NE | 0.70mi | 3/1.5 | 1,072 (-10%) | 1mo | $155,000 | $145 | 45 |
| 2436 Shepherd Dr NW | 0.72mi | 3/1.0 | 1,323 (+10%) | 14mo | $90,000 | $68 | 35 |
| 4304 Blue Springs Rd NW | 0.73mi | 3/2.0 | 1,366 (+14%) | 5mo | $150,000 | $110 | 32 |
Match score weights: distance 35% · size 25% · config 20% · recency 20%. Top-matched comps best support the ARV.
Projected returns pro-forma
-3.0% appreciation · 2.06% rent growth · sell at horizon
- IRR
- -13.8%
- Equity multiple
- 0.51×
- Total profit
- $-22,680
- Equity at exit
- $24,602
- IRR
- -6.4%
- Equity multiple
- 0.60×
- Total profit
- $-18,292
- Equity at exit
- $14,266
Cash invested: $46,199 (down + closing). Projections, not guarantees.
Landlord ↔ Tenant lean methodology
- Overall (STATE)
- 90 Strongly Landlord-Friendly
- State Alabama
- 90 Strongly Landlord-Friendly · R+15
- County
- — inherits STATE
- City
- — inherits STATE
ZIP-level market 35801
- Home prices YoY
- -28.0%
- Rents YoY
- 2.1%
- Active inventory
- 175
- Price-to-rent
- 9.7×
Monthly cashflow live
- Estimated rent
- $1,424 high interval (Pro) →
- Mortgage (P&I)
- −$865
- Tax from tax record
- −$106 /mo · $1,271/yr
- Insurance
- −$69
- HOA
- −$0
- Vacancy / Maint / Mgmt
- −$299
- Net cashflow
- $85
Break-even live
Sensitivity live
| Price | -10% $179 | -5% $132 | +0% $85 | +5% $39 | +10% $-8 |
|---|---|---|---|---|---|
| Rent | -10% $-27 | -5% $29 | +0% $85 | +5% $142 | +10% $198 |
| Rate | -1.0pp $168 | -0.5pp $127 | base $85 | +0.5pp $43 | +1.0pp $-1 |
UW: 25.0% down · 7.5% · 30yr · 1.5% tax · 5.0% vac · 8.0% maint · 8.0% mgmt
Financing live
Cash to close
- Down payment
- $41,250
- Closing costs
- $4,950
- Reserves months
- —
- Total cash needed
- —
Loan-product check · same deal, 3 products live
Conventional
25% down · 7.5% · 30yr
- Down + closing
- —
- Monthly P&I
- —
- Monthly cashflow
- —
- DSCR
- —
- Eligible?
- —
Personal DTI + credit; lowest rate.
DSCR
20% down · 8.5% · 30yr
- Down + closing
- —
- Monthly P&I
- —
- Monthly cashflow
- —
- DSCR
- —
- Eligible?
- —
No personal income docs; deal must DSCR.
Hard money
10% down · 12.0% · 12mo
- Down + closing
- —
- Monthly P&I
- —
- Monthly cashflow
- —
- DSCR
- —
- Eligible?
- —
Short-term bridge; refi at stabilization.
Rent comps 36 comps
| Address | Beds | Baths | Sqft | Rent | $/sqft | DOM | Units | Dist |
|---|---|---|---|---|---|---|---|---|
| 2113 Norris Rd NW Huntsville, AL | 3.0 | 1.0 | 1372 | $1,550 | $1.13 | 44d | 1 | 0.10mi |
| 4005 Memorial Pkwy NW Huntsville, AL | 3.0 | 1.0 | 1100 | $1,375 | $1.25 | 44d | 1 | 0.27mi |
| 2206 Harris Rd NW Huntsville, AL | 3.0 | 1.0 | 1354 | $1,400 | $1.03 | 44d | 1 | 0.28mi |
| 2117 Griffith Dr NW Huntsville, AL | 3.0 | 1.0 | 1000 | $1,095 | $1.09 | 24d | 1 | 0.29mi |
| 2207 Norwood Dr NW Huntsville, AL | 3.0 | 1.0 | 1020 | $1,295 | $1.27 | 14d | 1 | 0.32mi |
| 2200 Norwood Dr NW Huntsville, AL | 3.0 | 1.0 | 1060 | $1,150 | $1.08 | 24d | 1 | 0.37mi |
| 2117 Atkins Dr NW Huntsville, AL | 3.0 | 2.0 | 1250 | $1,699 | $1.36 | 24d | 1 | 0.48mi |
| 4802 Proctor Cir NW Huntsville, AL | 3.0 | 1.0 | 1000 | $1,250 | $1.25 | 44d | 1 | 0.53mi |
| 3707 Lakewood Dr NW Huntsville, AL | 3.0 | 1.0 | 1100 | $1,100 | $1.00 | 44d | 1 | 0.60mi |
| 2415 Vining Ave NW Huntsville, AL | 3.0 | 1.0 | 1079 | $1,250 | $1.16 | 14d | 1 | 0.61mi |
| 2433 Shepherd Dr NW Huntsville, AL | 3.0 | 1.0 | 864 | $1,300 | $1.50 | 44d | 1 | 0.71mi |
| 3606 Lakewood Rd NW Huntsville, AL | 3.0 | 1.5 | 1408 | $1,400 | $0.99 | 44d | 1 | 0.73mi |
| 4114 Blue Spring Rd NW Huntsville, AL | 3.0 | 2.0 | 1100 | $1,500 | $1.36 | 24d | 1 | 0.77mi |
| 2519 Birchfield St NW Huntsville, AL | 3.0 | 1.5 | 1125 | $1,195 | $1.06 | 44d | 1 | 0.83mi |
| 3410 Elizabeth St NW Unit 2 Huntsville, AL | 2.0 | 1.0 | 800 | $850 | $1.06 | 44d | 1 | 0.92mi |
| 3410 Elizabeth St NW Apt 7 Huntsville, AL | 2.0 | 1.0 | 800 | $799 | $1.00 | 44d | 1 | 0.92mi |
| 2219 Jonathan Dr NW Apt C Huntsville, AL | 2.0 | 1.5 | 850 | $850 | $1.00 | 44d | 1 | 0.95mi |
| 6022 Belgrade Dr NW Huntsville, AL | 3.0 | 1.5 | 1015 | $1,320 | $1.30 | 24d | 1 | 0.96mi |
| 5025 Blue Spring Rd NW Huntsville, AL | 3.0 | 2.5 | 1273 | $1,195 | $0.94 | 14d | 2 | 1.02mi |
| 2032 Ricky Rd NW Huntsville, AL | 4.0 | 2.0 | 1181 | $1,523 | $1.29 | 21d | 1 | 1.06mi |
| 2506 Jeri St NW Huntsville, AL | 3.0 | 1.5 | 1274 | $1,400 | $1.10 | 24d | 1 | 1.07mi |
| 2401 Mount Vernon Rd NW Huntsville, AL | 3.0 | 1.0 | 950 | $1,045 | $1.10 | 44d | 1 | 1.08mi |
| 102 Winchester Rd NW Huntsville, AL | 2.0 | 1.0 | 850 | $1,110 | $1.31 | 44d | 4 | 1.08mi |
| 6000 Cherokee Hills Dr NW Huntsville, AL | 3.0 | 2.0 | 1086 | $1,600 | $1.47 | 24d | 1 | 1.15mi |
| 3330 Meridian St N Huntsville, AL | 2.0 | 1.0 | 800 | $700 | $0.88 | 14d | 1 | 1.16mi |
| 3328 Meridian St N Apt 114 Huntsville, AL | 2.0 | 1.0 | 800 | $600 | $0.75 | 14d | 1 | 1.18mi |
| 3058 Boswell Dr NW Huntsville, AL | 4.0 | 2.0 | 1450 | $1,398 | $0.96 | 44d | 1 | 1.20mi |
| 611 Ofallon Rd NW Huntsville, AL | 3.0 | 2.0 | 1350 | $3,000 | $2.22 | 24d | 1 | 1.23mi |
| 203 N Plymouth Rd NW Huntsville, AL | 2.0 | 1.0 | 796 | $1,310 | $1.65 | 14d | 1 | 1.25mi |
| 621 Murray Rd NW Huntsville, AL | 3.0 | 1.5 | 1008 | $1,325 | $1.31 | 14d | 1 | 1.28mi |
| 6207 Belgrade Dr NW Huntsville, AL | 3.0 | 1.5 | 1050 | $1,395 | $1.33 | 45d | 1 | 1.33mi |
| 6214 Belgrade Dr NW Huntsville, AL | 3.0 | 1.5 | 1350 | $1,095 | $0.81 | 44d | 1 | 1.37mi |
| 3013 Kirkland Dr NW Huntsville, AL | 3.0 | 1.5 | 1324 | $1,295 | $0.98 | 44d | 1 | 1.43mi |
| 522 Lisa Ln NW Huntsville, AL | 4.0 | 3.0 | 1025 | $1,695 | $1.65 | 44d | 1 | 1.47mi |
| 3205 Lewisburg Dr NW Huntsville, AL | 3.0 | 2.0 | 1408 | $1,600 | $1.14 | 24d | 1 | 1.48mi |
| 3202 Deerfield Rd NW Huntsville, AL | 3.0 | 2.0 | 1234 | $1,425 | $1.15 | 44d | 1 | 1.49mi |
Listing history 17 events
-
2026-06-18days on market $164,998 Active 76 DOM
-
2026-06-17days on market $164,998 Active 75 DOM
-
2026-06-16days on market $164,998 Active 74 DOM
-
2026-06-15days on market $164,998 Active 73 DOM
-
2026-06-14days on market $164,998 Active 71 DOM
-
2026-06-10days on market $164,998 Active 68 DOM
-
2026-06-09days on market $164,998 Active 67 DOM
-
2026-06-08days on market $164,998 Active 66 DOM
-
2026-06-07days on market $164,998 Active 65 DOM
-
2026-06-03days on market $164,998 Active 61 DOM
-
2026-06-02days on market $164,998 Active 60 DOM
-
2026-06-01days on market $164,998 Active 59 DOM
-
2026-05-31days on market $164,998 Active 58 DOM
-
2026-05-30days on market $164,998 Active 57 DOM
-
2026-04-29price $164,999 656-char remark
Show marketing remark (656 chars)
This house comes with a REDUCED RATE as low as 4.99% (APR 5.508%) as of 04/28/2026 through List & Lock™. This is a seller paid rate-buydown that reduces the buyer’s interest rate and monthly payment. Terms apply, see disclosures for more information. This is a well maintained, brick rancher with long term tenants in place. This 3 bed 1.5 bath would be a great addition to your portfolio. The home sits on a huge corner lot, and is walking distance to Alabama A&M. Hardwood floors throughout, one car garage, and a huge shed in the back for extra storage. Sold as is. Please allow 48 hour notice to show the home, tenants are in place.
-
2026-04-03$165,000 Active 656-char remark
Show marketing remark (656 chars)
This house comes with a REDUCED RATE as low as 4.99% (APR 5.508%) as of 04/28/2026 through List & Lock™. This is a seller paid rate-buydown that reduces the buyer’s interest rate and monthly payment. Terms apply, see disclosures for more information. This is a well maintained, brick rancher with long term tenants in place. This 3 bed 1.5 bath would be a great addition to your portfolio. The home sits on a huge corner lot, and is walking distance to Alabama A&M. Hardwood floors throughout, one car garage, and a huge shed in the back for extra storage. Sold as is. Please allow 48 hour notice to show the home, tenants are in place.
-
2020-04-30soldstatus $74,900
ⓘ Source: listings_history table (triggers on properties + properties_extension) + one-shot
backfill from property_details.listing_events for pre-trigger history.
Tax reassessment forecast AL · Resets to sale price
- Current annual tax
- $1,271 · $106/mo
- Projected year-2 tax
- $1,271 · $106/mo
- Expected delta
- $0/yr ($0/mo · 0.0%)
ⓘ Screening estimate from a state-policy table — verify with the county assessor before closing.
Climate risk First Street
- Flood 1/10 Low FEMA zone X (unshaded) · 0% chance over 30 yrs
- Wildfire 3/10 Moderate
- Heat 5/10 Major 7 d/yr ≥104°F today · 19 d/yr by 30 yrs out
- Wind 4/10 Moderate 18% chance of damaging wind over 30 yrs
- Air quality 2/10 Low 1 unhealthy d/yr today · 1 by 30 yrs out
Nearby sold comps map
Loading sold comps map…
Walkable amenities ~0.75 mi
Loading nearby amenities…
Taxation est. · year 1
- Rental income
- $17,092
- − Mortgage interest
- −$9,242
- − Property taxes
- −$1,271
- − Insurance
- −$825
- − Repairs & maintenance
- −$1,367
- − Management
- −$1,367
- − Depreciation
- −$4,800
- Taxable loss
- −$1,781
- Est. tax savings @ 24.0%
- +$427
- After-tax cash flow
- $1,451/yr
For passive investors: Depreciation is non-cash, so a rental often shows a tax loss while cash-flowing — sheltering income. Rental losses are passive: they offset passive income freely, and up to $25,000/yr can offset ordinary (W-2) income if you actively participate and your MAGI is under $100k (phasing out to $0 by $150k); unused losses carry forward. On sale, claimed depreciation is recaptured at up to 25%, and gains may owe capital-gains tax (a 1031 exchange can defer both). Figures are a year-1 estimate at your 24.0% rate — not tax advice; consult a CPA.
Schools (NCES district)
- District
- Huntsville City
- NCES district ID
- 0101800
- Math proficiency
- 21% ▼ -23.00%
- Reading proficiency
- 46% ▬ 0.00%
- Median HH income
- $48,264
- Composite
- 28.84/100
- National rank
- #6647
- State rank
- #48 of 129 in AL
Livability — Huntsville
- Score
- 82/100
- State rank
- #3
- US rank
- #1082
Category grades
Schools grade is shown separately in the Schools card above.
Census & demographics
- Census place
- Huntsville, AL
- County
- Madison County · 380,832 people
- City population
- 220,435
- Metro
- Huntsville, AL
- Population (ZIP)
- 23,357
- Household income
- $105,585
- Rent vs Own
- Severe rent burden
- 547.0
Population outlook (Madison County) Hauer SSP2
- Today (2025)
- 392,086 people
- By 2030
- 409,788 · +4.5%
- By 2040
- 440,557 · +12.4%
- By 2050
- 460,990 · +17.6%
- By 2075
- 502,872 · +28.3%
- By 2100
- 513,623 · +31.0%
Race, ethnicity, and origin ACS 2023
- Neighborhood character
- Predominantly White (81%)
- Race & ethnicity
- White 81% Black 8% Two or more races 8% Hispanic / Latino 4% Asian 1%
- Common ancestry
- Italian 6% Lithuanian 3% Slovak 3%
- Foreign-born
- 4% · Canada, China
- Languages at home
- 96% English-only · Spanish 3% German/W. Germanic 1% Other Indo-European 1%
Political lean MEDSL · Madison
- 2024 margin
- Lean R (+9.0) · D 44.7% · R 53.7% · Other 1.6%
- 2008→2024 swing
- +6.0pp toward D · 2008: -14.9pp · 2024: -9.0pp
- All cycles
- 2024: R+9.0 2020: R+8.0 2016: R+16.8 2012: R+18.7 2008: R+14.9
Not yet ingested
- Civics
- —
Market trends
- HPI YoY
- ▼ -182.95%
- Current HPI
- 471.094
- Rent YoY
- ▲ 2.06%
- Metro
- Huntsville, AL
- State GDP YoY
- ▲ 2.94%
- F500 in state
- 4
Industry mix (Fortune 500 HQ in AL)
| Industry | F500 HQs | Revenue |
|---|---|---|
| Financial Services | 1 | $8B |
|
||
| Healthcare | 1 | $5B |
|
||
Price history
+120.3% since first listed3 events — show timeline
- 2026-04-29 Price Changed $164,999 VMLS
- 2026-04-03 Listed $165,000 VMLS
- 2020-04-30 Sold (Public Records) $74,900 Public Records
Property tax history
+15.4%/yrLatest (2024): $1,271 · +17.0% YoY. Source: county tax records.
Cash-flow waterfall
monthlySold comps — $/sqft
last 12 mo · ≤1 miLoading sold comps…