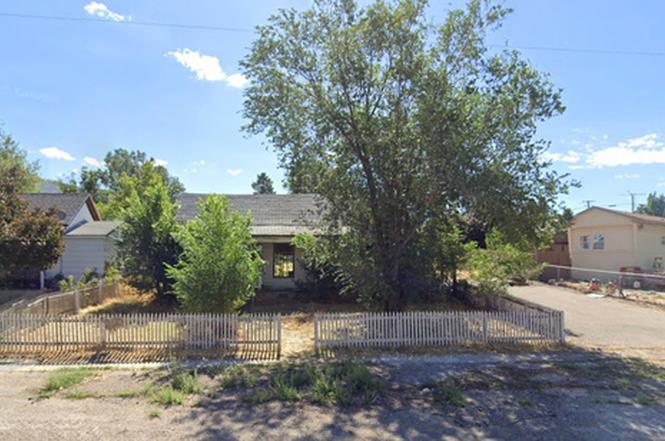
110 N Connor Ave E · Stockton, UT
Flood risk 6/10 · Moderate
- FEMA flood zone
- X (unshaded)
- Chance of flooding over 30 yrs
- 0.72%
- Est. flood insurance / yr
- $473 – $860
Fire risk 10/10 · Severe
- Est. fire insurance / yr
- $453 – $841
Heat risk 4/10 · Minor
- Hot days now (above 93°F)
- 5 days/yr
- Hot days in 30 yrs
- 12 days/yr
Wind risk 1/10 · Minimal
- Chance of severe wind over 30 yrs
- —
Air-quality risk 2/10 · Minimal
- Unhealthy air days now
- 0 days/yr
- Unhealthy air days in 30 yrs
- 1 days/yr
Risk factors via First Street. Map © Google.
Why this score? — see what drove the B+ grade
The composite is a weighted blend of 9 inputs, each scored 0–100. Each bar is that input's sub-score; the figure is the points it added to the 100-point composite (weight × sub-score).
- Cash flow +30.0/30.0
- 1% rule +10.0/10.0
- DSCR +10.0/10.0
- Appreciation +10.0/10.0
- ARV discount +7.5/15.0
- Livability +3.2/5.0
- Schools +3.0/10.0
- Rent growth +2.5/5.0
- Condition / age +2.5/5.0
$130,900
🖨 Deal sheet 📄 Offer letter ✓ Due diligence
Listing remarks MLS
There are no remarks available.
Key facts
- Historic mining town
- Rare opportunity
- New construction
Tags
Property features AI
Exterior
- Parking: 4 total parking spaces (4 open)
- Utilities: Public sewer (connected); Culinary water
- Home design: Bungalow/Cottage style; Single-family residence; Faces west
- Construction: Cedar and frame construction; Asphalt roof; Built and currently standing
- Exterior features: Partially fenced yard; Sidewalks; Gradual slope terrain
Interior
- Bedrooms: 2 main-level bedrooms
- Bathrooms: 1 full bathroom
- Interior features: Partial basement; Fireplace
Neighborhood map
What this means for you Summary
Snapshot
- This is a 2-bed/1.0-bath other listed at $131k.
Deal economics
- At list price, monthly cash flow is $943 ($11k/yr) — positive.
- The deal already cash-flows at list — no discount required.
- Meets the 1% rule at list price ($2k rent vs $131k).
Location & tenants
- Location reads 63/100 on livability (#176 in UT) — a middle-class / working-renter tenant base. Strengths: crime A+, employment A+, housing A+; Watch: amenities F, commute F, health & safety F.
- Tooele District (town): math 32% / reading 34% proficiency, ranked #62 of 80 in UT (top 78%) — families likely to look elsewhere, expect single-tenant / working-renter base with shorter leases.
- Zoned schools: Tooele Jr High (math 33% / reading 28%, grade F, #106 of 138 statewide, top 77%, 733 students, 54% FRL); Tooele High (math 23% / reading 37%, grade F, #119 of 171 statewide, top 71%, 1,768 students, 25% FRL).
- Market conditions: 22 active listings in the ZIP; 867 units permitted in Tooele County in 2024 (87 in 5+ unit buildings).
Forward outlook
- In year one you build about $14k of equity ($905 loan paydown + $13k appreciation (10.0% local appreciation)).
- Tooele County population projected at +33% by 2050 — long-run rental-demand tailwind backs the buy-and-hold thesis.
- At projected returns (10.0% appreciation + 3.0% rent growth), your $37k cash investment doubles in ~2 years — after that, you're playing with house money.
- By year 3, paydown + projected appreciation supports a ~$35k cash-out refi (75% LTV) — recoverable capital for the next deal without selling this one.
Negotiation context
- Only 7 days on market — expect competitive offers; lowballing is unlikely to land.
- 6 sale attempts since 18y ago with the ask held roughly flat each time — persistent listings suggest the price (not the market) is what's stuck; bring a comps-based counter.
Risks & watch-outs
- Watch-outs: built in 1895 — expect roof / HVAC / electrical / plumbing capex.
- Climate carrying-cost: major flood risk; severe wildfire risk — expect insurance premiums to compound above CPI over the hold.
Questions for the listing agent
- Built in 1895 — when were the roof, HVAC, electrical panel, plumbing, and water heater last replaced?
- Is there a deadline driving the sale (1031 exchange, divorce, estate, relocation)? That informs how much negotiation room exists.
- Schools are D-rated, which usually means shorter tenancies and higher turnover. Who's the typical renter profile here, and what's been the actual vacancy rate?
- What's the average days-on-market for RENTAL listings here right now (not sales)? A rising rental-DOM trend means longer vacancies and softer asking-rent achievability than the comps imply.
- What's the recent tenant-quality profile in this submarket — average credit score on applications, eviction rate, late-payment / NSF rate, and stable-employment percentage? A property-management company in the area should have these aggregated.
- How much new for-sale + rental construction is in the pipeline within 1–3 miles? Heavy new supply typically softens prices + rents 12–24 months out; constrained supply supports both.
Investment metrics
- 1% rule
- 1.73% ✓
- Cap rate
- 14.94%
- Cash-on-cash
- 30.87%
- DSCR
- 2.37
- GRM
- 4.8
CMA / ARV
No comps found within radius.
Projected returns pro-forma
10.0% appreciation · 3.0% rent growth · sell at horizon
- IRR
- 47.8%
- Equity multiple
- 4.58×
- Total profit
- $131,336
- Equity at exit
- $117,925
- IRR
- 41.6%
- Equity multiple
- 10.26×
- Total profit
- $339,537
- Equity at exit
- $254,310
Cash invested: $36,652 (down + closing). Projections, not guarantees.
Landlord ↔ Tenant lean methodology
- Overall (STATE)
- 86 Strongly Landlord-Friendly
- State Utah
- 86 Strongly Landlord-Friendly · R+15
- County
- — inherits STATE
- City
- — inherits STATE
ZIP-level market 84071
- Home prices YoY
- 6.5%
- Active inventory
- 22
- Price-to-rent
- 4.8×
Monthly cashflow live
- Estimated rent
- $2,262 medium interval (Pro) →
- Mortgage (P&I)
- −$686
- Tax from tax record
- −$103 /mo · $1,242/yr
- Insurance
- −$55
- HOA
- −$0
- Vacancy / Maint / Mgmt
- −$475
- Net cashflow
- $943
Break-even live
UW: 25.0% down · 7.5% · 30yr · 1.5% tax · 5.0% vac · 8.0% maint · 8.0% mgmt
Financing live
Cash to close
- Down payment
- $32,725
- Closing costs
- $3,927
- Reserves months
- —
- Total cash needed
- —
Loan-product check · same deal, 3 products live
Conventional
25% down · 7.5% · 30yr
- Down + closing
- —
- Monthly P&I
- —
- Monthly cashflow
- —
- DSCR
- —
- Eligible?
- —
Personal DTI + credit; lowest rate.
DSCR
20% down · 8.5% · 30yr
- Down + closing
- —
- Monthly P&I
- —
- Monthly cashflow
- —
- DSCR
- —
- Eligible?
- —
No personal income docs; deal must DSCR.
Hard money
10% down · 12.0% · 12mo
- Down + closing
- —
- Monthly P&I
- —
- Monthly cashflow
- —
- DSCR
- —
- Eligible?
- —
Short-term bridge; refi at stabilization.
Listing history 6 events
-
2026-06-18days on market $130,900 Active 7 DOM
-
2026-06-17days on market $130,900 Active 6 DOM
-
2026-06-16days on market $130,900 Active 5 DOM
-
2026-06-15days on market $130,900 Active 4 DOM
-
2026-06-13remarks 598-char remark
-
2026-06-13$130,900 Active 2 DOM
ⓘ Source: listings_history table (triggers on properties + properties_extension) + one-shot
backfill from property_details.listing_events for pre-trigger history.
Tax reassessment forecast UT · Resets to sale price
- Current annual tax
- $1,242 · $103/mo
- Projected year-2 tax
- $1,242 · $103/mo
- Expected delta
- $0/yr ($0/mo · 0.0%)
ⓘ Screening estimate from a state-policy table — verify with the county assessor before closing.
Climate risk First Street
- Flood 6/10 Major FEMA zone X (unshaded) · 72% chance over 30 yrs
- Wildfire 10/10 Extreme
- Heat 4/10 Moderate 5 d/yr ≥93°F today · 12 d/yr by 30 yrs out
- Wind 1/10 Low
- Air quality 2/10 Low 0 unhealthy d/yr today · 1 by 30 yrs out
Nearby sold comps map
Loading sold comps map…
Walkable amenities ~0.75 mi
Loading nearby amenities…
Taxation est. · year 1
- Rental income
- $27,148
- − Mortgage interest
- −$7,332
- − Property taxes
- −$1,242
- − Insurance
- −$654
- − Repairs & maintenance
- −$2,172
- − Management
- −$2,172
- − Depreciation
- −$3,808
- Taxable income
- $9,768
- Est. tax owed @ 24.0%
- −$2,344
- After-tax cash flow
- $8,969/yr
For passive investors: Depreciation is non-cash, so a rental often shows a tax loss while cash-flowing — sheltering income. Rental losses are passive: they offset passive income freely, and up to $25,000/yr can offset ordinary (W-2) income if you actively participate and your MAGI is under $100k (phasing out to $0 by $150k); unused losses carry forward. On sale, claimed depreciation is recaptured at up to 25%, and gains may owe capital-gains tax (a 1031 exchange can defer both). Figures are a year-1 estimate at your 24.0% rate — not tax advice; consult a CPA.
Schools (NCES district)
- District
- Tooele District
- NCES district ID
- 4901050
- Math proficiency
- 32% ▼ -8.00%
- Reading proficiency
- 34% ▼ -6.00%
- Median HH income
- $63,054
- Composite
- 29.94/100
- National rank
- #6379
- State rank
- #62 of 80 in UT
Livability — Stockton
- Score
- 63/100
- State rank
- #176
- US rank
- #15021
Category grades
Schools grade is shown separately in the Schools card above.
Census & demographics
- Census place
- Stockton, UT
- Population (ZIP)
- 2,339
Population outlook (Tooele County) Hauer SSP2
- Today (2025)
- 73,901 people
- By 2030
- 79,080 · +7.0%
- By 2040
- 89,127 · +20.6%
- By 2050
- 98,460 · +33.2%
- By 2075
- 115,767 · +56.7%
- By 2100
- 122,453 · +65.7%
Race, ethnicity, and origin ACS 2023
- Neighborhood character
- Predominantly White (86%)
- Race & ethnicity
- White 86% Hispanic / Latino 12% Two or more races 1%
- Hispanic origin (detail)
- Mexican 12%
- Common ancestry
- Italian 15% Slovak 4% Iranian 2%
- Languages at home
- 88% English-only · Spanish 11%
Political lean MEDSL · Tooele
- 2024 margin
- Solid R (+41.0) · D 28.1% · R 69.1% · Other 2.8%
- 2008→2024 swing
- -11.2pp toward R · 2008: -29.8pp · 2024: -41.0pp
- All cycles
- 2024: R+41.0 2020: R+38.3 2016: R+30.0 2012: R+51.4 2008: R+29.8
Not yet ingested
- Civics
- —
Market trends
- HPI YoY
- ▲ 21.47%
- Current HPI
- 350.16
- Rent YoY
- —
- Metro
- —
- State GDP YoY
- ▲ 3.54%
- F500 in state
- 2
Industry mix (Fortune 500 HQ in UT)
| Industry | F500 HQs | Revenue |
|---|---|---|
| Financial Services | 1 | $3B |
|
||
Price history
+191.5% since first listed14 events — show timeline
- 2026-06-11 Listed $130,900 WFRMLS
- 2024-12-09 Sold (MLS) — WFRMLS
- 2024-12-06 Listing Removed — WFRMLS
- 2024-12-03 Pending — WFRMLS
- 2024-11-19 Listed $124,900 WFRMLS
- 2024-11-19 Listed $124,900 WFRMLS
- 2021-02-24 Sold (Public Records) — Public Records
- 2021-02-16 Pending — WFRMLS
- 2021-02-08 Relisted — WFRMLS
- 2021-02-03 Pending — WFRMLS
- 2021-01-31 Listed $95,000 WFRMLS
- 2008-10-10 Sold (MLS) — WFRMLS
- 2008-06-06 Listed $44,900 WFRMLS
- 2006-04-04 Sold (Public Records) — Public Records
Property tax history
+6.4%/yrLatest (2025): $1,242 · -17.2% YoY. Source: county tax records.
Cash-flow waterfall
monthlySold comps — $/sqft
last 12 mo · ≤1 miLoading sold comps…