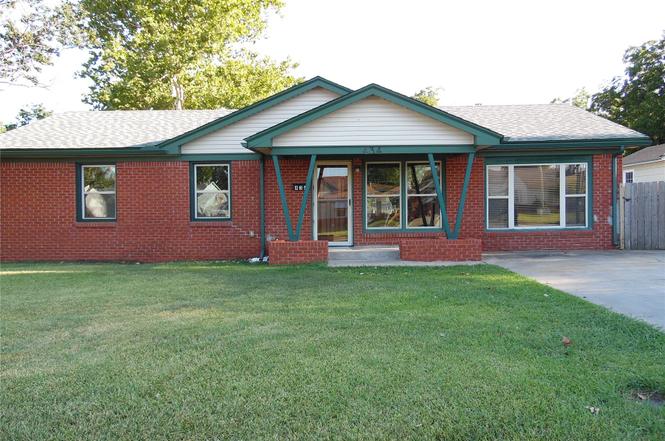
434 Locust St NW · Ardmore, OK
Flood risk 1/10 · Minimal
- FEMA flood zone
- X (unshaded)
- Chance of flooding over 30 yrs
- 0.0%
- Est. flood insurance / yr
- $507 – $1,088
Fire risk 5/10 · Moderate
- Est. fire insurance / yr
- $2,463 – $4,575
Heat risk 6/10 · Moderate
- Hot days now (above 112°F)
- 7 days/yr
- Hot days in 30 yrs
- 20 days/yr
Wind risk 4/10 · Minor
- Chance of severe wind over 30 yrs
- 11.0%
Air-quality risk 3/10 · Minor
- Unhealthy air days now
- 2 days/yr
- Unhealthy air days in 30 yrs
- 3 days/yr
Risk factors via First Street. Map © Google.
Why this score? — see what drove the D- grade
The composite is a weighted blend of 9 inputs, each scored 0–100. Each bar is that input's sub-score; the figure is the points it added to the 100-point composite (weight × sub-score).
- Cash flow +15.5/30.0
- DSCR +4.8/10.0
- Rent growth +4.3/5.0
- 1% rule +3.9/10.0
- Livability +2.9/5.0
- Condition / age +2.5/5.0
- Schools +1.1/10.0
- ARV discount +0.6/15.0
- Appreciation +0.0/10.0
$158,000
🖨 Deal sheet (PDF) 📄 Offer letter ✓ Due diligence
Listing remarks
Step into this cozy, updated 3-bedroom, 1-bath home and instantly feel at ease. Inside, you’ll find a large den and nicely sized bedrooms, along with fresh carpet and numerous interior updates throughout. The modernized living spaces create a warm, move-in–ready feel. Outside, the property features a large backyard—perfect for gatherings, gardening, or play—with two storage buildings providing extra space for tools, hobbies, or seasonal items. Ideally located near the hospital, shopping, schools, and a park, this home combines everyday convenience with a quiet residential atmosphere. A great option for families, first-time buyers, or anyone looking for an updated hom
Key facts
- Large den
- Large backyard
- Updated home
Tags
Property features AI
Finance
- Financial info: $794 annual tax (2024)
Exterior
- Security: Smoke detector(s); No safety shelter
- Utilities: Cable available; Electricity available; Natural gas available; Public water; Public sewer
- Home design: Single-story; Faces north; Slab foundation
- Construction: Brick veneer and wood frame construction; Asphalt/fiberglass roof
- Exterior features: Covered patio; Patio; Fire pit; Shed(s); Workshop; Chain link fencing; Mature trees
Interior
- Kitchen: Oven; Range; Stove
- Flooring: Carpet; Vinyl
- Bathrooms: 1 full bathroom
- Heating & cooling: Central heating (electric); Central air conditioning
- Interior features: High ceilings; Laminate counters; Cable TV connection; Ceiling fan(s); Gas range and oven connections; Vinyl windows
- Laundry & utility: Washer hookup; Electric dryer hookup; Gas water heater
Neighborhood map
What this means for you Summary
Snapshot
- This is a 3-bed/1.0-bath single-family listed at $158k.
Deal economics
- At list price, monthly cash flow is $64 ($765/yr) — positive.
- The deal already cash-flows at list — no discount required.
- To meet the 1% rule (rent ≥ 1% of price), the offer needs to be $141k (11.0% below list).
- Recommended offer: $139k (12.0% below list) — sets the bar for market timing.
- Cap rate 6.8% vs local median 4.6% in Ardmore — top-decile yield for the area; either an underpriced asset or a hidden risk that comps aren't pricing in. Stress-test before assuming the spread holds.
Location & tenants
- Location reads 58/100 on livability (#447 in OK) — a working-class tenant base; expect higher turnover. Strengths: cost of living A+, housing A+; Watch: crime F, amenities F, commute F.
- Ardmore (town): math 12% / reading 15% proficiency, ranked #241 of 270 in OK (top 89%) — low school quality limits family demand, transient renter base, plan for 1-2y turnover; 73% free/reduced lunch — lower-income household profile, screen leases tightly.
- Zoned schools: Charles Evans Es (math 17% / reading 23%, grade F, #469 of 845 statewide, top 56%, 398 students, 0% FRL); Ardmore Ms (math 7% / reading 12%, grade F, #299 of 345 statewide, top 88%, 498 students, 0% FRL); Ardmore Hs (math 12% / reading 17%, grade F, #348 of 447 statewide, top 79%, 751 students, 0% FRL) — zoned schools average 0% FRL vs 73% district-wide (73 pts lower); this property's tenant base skews higher-income than the district average.
- Market conditions: Rents rising fast (+7.4%/yr); 382 active listings in the ZIP; 73 units permitted in Carter County in 2024 (0 in 5+ unit buildings).
Forward outlook
- Local home prices are declining (-3.0%/yr); year-one equity from $1k of loan paydown is wiped out by about $5k of value loss. Plan a longer hold.
- Carter County population projected at +9% by 2050 — modest demand growth; plan on rents tracking national, not racing it.
Negotiation context
- It's been on market 183 days — a 12% lower offer ($139k) is reasonable based on typical stale-listing flexibility.
- 5 sale attempts since 2y ago with the ask held roughly flat each time — persistent listings suggest the price (not the market) is what's stuck; bring a comps-based counter.
Risks & watch-outs
- Watch-outs: built in 1955 — expect roof / HVAC / electrical / plumbing capex.
- Climate carrying-cost: moderate wildfire risk; extreme-heat days projected 7→20/yr by 2055 (HVAC capex compounding) — expect insurance premiums to compound above CPI over the hold.
Questions for the listing agent
- It's been on market 183 days. Have you received any prior offers? Is the seller open to a 12% concession, seller financing, or rate buy-down credit?
- Built in 1955 — when were the roof, HVAC, electrical panel, plumbing, and water heater last replaced?
- Why hasn't it sold? Are there any deal-killer items the seller is aware of (foundation, flood, title, zoning, code violations)?
- Is there a deadline driving the sale (1031 exchange, divorce, estate, relocation)? That informs how much negotiation room exists.
- Schools are F-rated, which usually means shorter tenancies and higher turnover. Who's the typical renter profile here, and what's been the actual vacancy rate?
- Crime grade is F in this area — have there been break-ins, vandalism, or insurance claims at this property in the last 3 years? What carrier currently insures it and at what premium?
- The area grade is low — what's the realistic commute time and amenity access for the typical tenant pool here? Any planned neighborhood developments (good or bad) we should know about?
- What's the average days-on-market for RENTAL listings here right now (not sales)? A rising rental-DOM trend means longer vacancies and softer asking-rent achievability than the comps imply.
- What's the recent tenant-quality profile in this submarket — average credit score on applications, eviction rate, late-payment / NSF rate, and stable-employment percentage? A property-management company in the area should have these aggregated.
- How much new for-sale + rental construction is in the pipeline within 1–3 miles? Heavy new supply typically softens prices + rents 12–24 months out; constrained supply supports both.
Investment metrics
- 1% rule
- 0.89% ✗
- Cap rate
- 6.78%
- Cash-on-cash
- 1.73%
- DSCR
- 1.08
- GRM
- 9.4
CMA / ARV
- ARV (on-the-fly)
- $137,088
- Comps found
- 12
Show comp detail 12 sales within ~0.75 mi
| Address | Dist | Beds/Ba | Sqft | Sold | Price | $/sf | Match |
|---|---|---|---|---|---|---|---|
| 430 Locust | 0.02mi | 3/1.0 | 1,237 (+7%) | 6mo | $141,000 | $114 | 81 |
| 1908 Choctaw Ave | 0.26mi | 3/1.5 | 1,194 (+4%) | 2mo | $142,500 | $119 | 78 |
| 1817 Comanche | 0.22mi | 3/1.0 | 1,224 (+6%) | 2mo | $147,500 | $121 | 78 |
| 426 Elm | 0.31mi | 3/1.5 | 1,128 (-2%) | 7mo | $89,000 | $79 | 74 |
| 703 Campbell | 0.62mi | 3/1.0 | 1,104 (-4%) | 4mo | $139,000 | $126 | 61 |
| 722 NW Maxwell St | 0.63mi | 2/1.0 (-1) | 1,144 (-1%) | 6mo | $135,000 | $118 | 60 |
| 800 Cottonwood | 0.50mi | 3/2.0 | 1,215 (+6%) | 6mo | $145,000 | $119 | 59 |
| 428 Elm | 0.32mi | 3/2.0 | 1,012 (-12%) | 7mo | $139,000 | $137 | 55 |
| 1618 Mount Washington St | 0.52mi | 2/1.0 (-1) | 1,248 (+8%) | 2mo | $120,000 | $96 | 55 |
| 705 Elizabeth | 0.74mi | 3/1.0 | 1,232 (+7%) | 4mo | $165,000 | $134 | 51 |
| 625 Northwest Ave | 0.75mi | 3/1.0 | 1,239 (+8%) | 6mo | $75,000 | $61 | 47 |
| 923 Maxwell St | 0.75mi | 3/1.0 | 1,304 (+13%) | 2mo | $169,900 | $130 | 42 |
Match score weights: distance 35% · size 25% · config 20% · recency 20%. Top-matched comps best support the ARV.
Projected returns pro-forma
-3.0% appreciation · 7.38% rent growth · sell at horizon
- IRR
- -8.9%
- Equity multiple
- 0.66×
- Total profit
- $-15,082
- Equity at exit
- $23,558
- IRR
- 5.4%
- Equity multiple
- 1.48×
- Total profit
- $21,122
- Equity at exit
- $13,661
Cash invested: $44,240 (down + closing). Projections, not guarantees.
Landlord ↔ Tenant lean methodology
- Overall (STATE)
- 83 Strongly Landlord-Friendly
- State Oklahoma
- 83 Strongly Landlord-Friendly · R+20
- County
- — inherits STATE
- City
- — inherits STATE
ZIP-level market 73401
- Home prices YoY
- -21.7%
- Rents YoY
- 7.4%
- Active inventory
- 382
- Price-to-rent
- 9.4×
Monthly cashflow live
- Estimated rent
- $1,406 medium interval (Pro) →
- Mortgage (P&I)
- −$829
- Tax from tax record
- −$152 /mo · $1,827/yr
- Insurance
- −$66
- HOA
- −$0
- Vacancy / Maint / Mgmt
- −$295
- Net cashflow
- $64
Break-even live
Sensitivity live
| Price | -10% $153 | -5% $108 | +0% $64 | +5% $19 | +10% $-26 |
|---|---|---|---|---|---|
| Rent | -10% $-47 | -5% $8 | +0% $64 | +5% $119 | +10% $175 |
| Rate | -1.0pp $143 | -0.5pp $104 | base $64 | +0.5pp $23 | +1.0pp $-19 |
UW: 25.0% down · 7.5% · 30yr · 1.5% tax · 5.0% vac · 8.0% maint · 8.0% mgmt
Financing live
Cash to close
- Down payment
- $39,500
- Closing costs
- $4,740
- Reserves months
- —
- Total cash needed
- —
Loan-product check · same deal, 3 products live
Conventional
25% down · 7.5% · 30yr
- Down + closing
- —
- Monthly P&I
- —
- Monthly cashflow
- —
- DSCR
- —
- Eligible?
- —
Personal DTI + credit; lowest rate.
DSCR
20% down · 8.5% · 30yr
- Down + closing
- —
- Monthly P&I
- —
- Monthly cashflow
- —
- DSCR
- —
- Eligible?
- —
No personal income docs; deal must DSCR.
Hard money
10% down · 12.0% · 12mo
- Down + closing
- —
- Monthly P&I
- —
- Monthly cashflow
- —
- DSCR
- —
- Eligible?
- —
Short-term bridge; refi at stabilization.
Listing history 18 events
-
2026-05-31days on market $158,000 Active 183 DOM
-
2026-05-30days on market $158,000 Active 182 DOM
-
2026-03-10price $158,000
-
2026-01-13price $161,000
-
2025-11-29$162,000 Active
-
2025-11-01historical
-
2025-09-01price $165,000
-
2025-07-30$175,900 Active
-
2025-06-23historical
-
2025-05-31$162,000 Active
-
2025-05-22historical
-
2025-05-08price $155,000
-
2025-04-25price $158,000
-
2025-03-07$159,000 Active
-
2024-10-25soldstatus $152,500 Closed
-
2024-10-14status Pending
-
2024-08-19$152,500 Active
-
2007-10-03soldstatus $72,000
ⓘ Source: listings_history table (triggers on properties + properties_extension) + one-shot
backfill from property_details.listing_events for pre-trigger history.
Tax reassessment forecast OK · Resets to sale price
- Current annual tax
- $1,827 · $152/mo
- Projected year-2 tax
- $1,827 · $152/mo
- Expected delta
- $0/yr ($0/mo · 0.0%)
ⓘ Screening estimate from a state-policy table — verify with the county assessor before closing.
Climate risk First Street
- Flood 1/10 Low FEMA zone X (unshaded) · 0% chance over 30 yrs
- Wildfire 5/10 Major
- Heat 6/10 Major 7 d/yr ≥112°F today · 20 d/yr by 30 yrs out
- Wind 4/10 Moderate 11% chance of damaging wind over 30 yrs
- Air quality 3/10 Moderate 2 unhealthy d/yr today · 3 by 30 yrs out
Nearby sold comps map
Loading sold comps map…
Walkable amenities ~0.75 mi
Loading nearby amenities…
Taxation est. · year 1
- Rental income
- $16,867
- − Mortgage interest
- −$8,850
- − Property taxes
- −$1,827
- − Insurance
- −$790
- − Repairs & maintenance
- −$1,349
- − Management
- −$1,349
- − Depreciation
- −$4,596
- Taxable loss
- −$1,896
- Est. tax savings @ 24.0%
- +$455
- After-tax cash flow
- $1,220/yr
For passive investors: Depreciation is non-cash, so a rental often shows a tax loss while cash-flowing — sheltering income. Rental losses are passive: they offset passive income freely, and up to $25,000/yr can offset ordinary (W-2) income if you actively participate and your MAGI is under $100k (phasing out to $0 by $150k); unused losses carry forward. On sale, claimed depreciation is recaptured at up to 25%, and gains may owe capital-gains tax (a 1031 exchange can defer both). Figures are a year-1 estimate at your 24.0% rate — not tax advice; consult a CPA.
Schools (NCES district)
- District
- Ardmore
- NCES district ID
- 4003180
- Math proficiency
- 12% ▼ -7.00%
- Reading proficiency
- 15% ▼ -6.00%
- Median HH income
- $35,194
- Composite
- 11.1/100
- National rank
- #9733
- State rank
- #241 of 270 in OK
Livability — Ardmore
- Score
- 58/100
- State rank
- #447
- US rank
- #21387
Category grades
Schools grade is shown separately in the Schools card above.
Census & demographics
- Census place
- Ardmore, OK
- County
- Carter County · 36,833 people
- City population
- 36,833
- Metro
- Ardmore, OK
- Population (ZIP)
- 36,833
- Household income
- $61,989
- Rent vs Own
- Severe rent burden
- 1026.0
Population outlook (Carter County) Hauer SSP2
- Today (2025)
- 50,892 people
- By 2030
- 51,913 · +2.0%
- By 2040
- 53,857 · +5.8%
- By 2050
- 55,604 · +9.3%
- By 2075
- 60,670 · +19.2%
- By 2100
- 62,366 · +22.5%
Race, ethnicity, and origin ACS 2023
- Neighborhood character
- Diverse neighborhood (Simpson 0.57)
- Race & ethnicity
- White 65% Two or more races 14% Hispanic / Latino 9% Native American 8% Black 7% Asian 1%
- Hispanic origin (detail)
- Mexican 7%
- Common ancestry
- Slovak 2% Lithuanian 1% Italian 1%
- Foreign-born
- 4% · Canada
- Languages at home
- 92% English-only · Spanish 5%
Political lean MEDSL · Carter
- 2024 margin
- Solid R (+54.7) · D 21.9% · R 76.7% · Other 1.4%
- 2008→2024 swing
- -14.2pp toward R · 2008: -40.5pp · 2024: -54.7pp
- All cycles
- 2024: R+54.7 2020: R+52.5 2016: R+52.6 2012: R+42.7 2008: R+40.5
Not yet ingested
- Civics
- —
Market trends
- HPI YoY
- ▼ -74.93%
- Current HPI
- 269.7381
- Rent YoY
- ▲ 7.38%
- Metro
- Ardmore, OK
- State GDP YoY
- ▲ 1.55%
- F500 in state
- 6
Industry mix (Fortune 500 HQ in OK)
| Industry | F500 HQs | Revenue |
|---|---|---|
| Energy | 3 | $48B |
|
||
Price history
+119.4% since first listed16 events — show timeline
- 2026-03-10 Price Changed $158,000 MLS Technology, Inc.
- 2026-01-13 Price Changed $161,000 MLS Technology, Inc.
- 2025-11-29 Listed $162,000 MLS Technology, Inc.
- 2025-11-01 Listing Removed — MLSOK
- 2025-09-01 Price Changed $165,000 MLSOK
- 2025-07-30 Listed $175,900 MLSOK
- 2025-06-23 Listing Removed — MLSOK
- 2025-05-31 Listed $162,000 MLSOK
- 2025-05-22 Listing Removed — MLSOK
- 2025-05-08 Price Changed $155,000 MLSOK
- 2025-04-25 Price Changed $158,000 MLSOK
- 2025-03-07 Listed $159,000 MLSOK
- 2024-10-25 Sold (MLS) $152,500 MLS Technology, Inc.
- 2024-10-14 Pending — MLS Technology, Inc.
- 2024-08-19 Listed $152,500 MLS Technology, Inc.
- 2007-10-03 Sold (Public Records) $72,000 Public Records
Property tax history
+14.2%/yrLatest (2025): $1,827 · +130.1% YoY. Source: county tax records.
Cash-flow waterfall
monthlySold comps — $/sqft
last 12 mo · ≤1 miLoading sold comps…