210 Correze · Kinder, LA
Flood risk 6/10 · Moderate
- FEMA flood zone
- X (unshaded)
- Chance of flooding over 30 yrs
- 0.72%
- Est. flood insurance / yr
- $507 – $1,088
Fire risk 5/10 · Moderate
- Est. fire insurance / yr
- $1,269 – $2,357
Heat risk 8/10 · Major
- Hot days now (above 110°F)
- 7 days/yr
- Hot days in 30 yrs
- 20 days/yr
Wind risk 9/10 · Severe
- Chance of severe wind over 30 yrs
- 99.0%
Air-quality risk 1/10 · Minimal
- Unhealthy air days now
- 0 days/yr
- Unhealthy air days in 30 yrs
- 0 days/yr
Risk factors via First Street. Map © Google.
Why this score? — see what drove the B+ grade
The composite is a weighted blend of 9 inputs, each scored 0–100. Each bar is that input's sub-score; the figure is the points it added to the 100-point composite (weight × sub-score).
- Cash flow +30.0/30.0
- ARV discount +15.0/15.0
- DSCR +10.0/10.0
- 1% rule +8.6/10.0
- Livability +3.8/5.0
- Schools +2.8/10.0
- Rent growth +2.5/5.0
- Condition / age +2.5/5.0
- Appreciation +0.0/10.0
$90,000
🖨 Deal sheet (PDF) 📄 Offer letter ✓ Due diligence
Listing remarks MLS
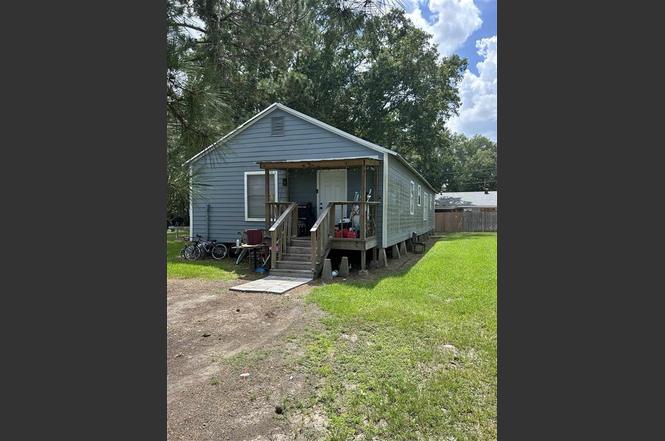
Nice size home with a large kitchen and large master bedroom. Recently rented. Needs some work and would be a great investment property. House next door is also for sale - MLS 171805.
Key facts
- 8,712 sq ft lot
- 4 parking spots
- Built 1955
Property features AI
Exterior
- Parking: Four total parking spaces (all open)
- Utilities: Public water; Public sewer; Electricity connected; Water connected
- Home design: Single-family residence (house); One story; East-facing; Raised foundation
- Exterior features: Back yard; City lot; Paved road access; Has a view; No fencing
Interior
- Bedrooms: Three bedrooms on the main level
- Bathrooms: Two full bathrooms on the main level
- Heating & cooling: Central air conditioning; Electric heating
- Interior features: No fireplace
Neighborhood map
What this means for you Summary
Snapshot
- This is a 3-bed/2.0-bath single-family listed at $90k.
Deal economics
- At list price, monthly cash flow is $404 ($5k/yr) — positive.
- The deal already cash-flows at list — no discount required.
- Meets the 1% rule at list price ($1k rent vs $90k).
- Recommended offer: $82k (9.0% below list) — sets the bar for market timing.
Location & tenants
- Location reads 75/100 on livability (#21 in LA, #4,044 nationally) — a middle-class / working-renter tenant base. Strengths: cost of living A+, housing A+, crime B+; Watch: amenities F, commute F.
- Allen Parish (rural): math 26% / reading 42% proficiency, ranked #36 of 98 in LA (top 37%) — families likely to look elsewhere, expect single-tenant / working-renter base with shorter leases.
- Zoned schools: Kinder Elementary School (math 32% / reading 42%, grade F, #251 of 646 statewide, top 41%, 541 students, 72% FRL); Kinder Middle School (math 31% / reading 56%, grade D, #55 of 218 statewide, top 25%, 374 students, 61% FRL); Kinder High School (math 37% / reading 57%, grade D-, #45 of 265 statewide, top 20%, 426 students, 60% FRL).
- Market conditions: 39 active listings in the ZIP; 46 units permitted in Allen Parish in 2024 (0 in 5+ unit buildings).
Forward outlook
- Local home prices are declining (-3.0%/yr); year-one equity from $622 of loan paydown is wiped out by about $3k of value loss. Plan a longer hold.
- Allen County population projected to shrink 8% by 2050 — rents likely to lag national; underwrite the cash flow, not the appreciation.
- At projected returns (-3.0% appreciation + 3.0% rent growth), your $25k cash investment doubles in ~7 years — after that, you're playing with house money.
Negotiation context
- It's been on market 119 days — a 9% lower offer ($82k) is reasonable based on typical stale-listing flexibility.
- 2 sale attempts since 7y ago with the ask held roughly flat each time — persistent listings suggest the price (not the market) is what's stuck; bring a comps-based counter.
Risks & watch-outs
- Watch-outs: built in 1955 — expect roof / HVAC / electrical / plumbing capex.
- Climate carrying-cost: major flood risk; severe wind risk, 99% chance of damaging wind over 30y; moderate wildfire risk; extreme-heat days projected 7→20/yr by 2055 (HVAC capex compounding) — expect insurance premiums to compound above CPI over the hold.
Questions for the listing agent
- It's been on market 119 days. Have you received any prior offers? Is the seller open to a 9% concession, seller financing, or rate buy-down credit?
- Built in 1955 — when were the roof, HVAC, electrical panel, plumbing, and water heater last replaced?
- Why hasn't it sold? Are there any deal-killer items the seller is aware of (foundation, flood, title, zoning, code violations)?
- Is there a deadline driving the sale (1031 exchange, divorce, estate, relocation)? That informs how much negotiation room exists.
- Schools are A-rated — typically a magnet for longer-tenancy family renters. What's the average tenant stay here, and is there a school-zone premium baked into asking?
- What's the average days-on-market for RENTAL listings here right now (not sales)? A rising rental-DOM trend means longer vacancies and softer asking-rent achievability than the comps imply.
- What's the recent tenant-quality profile in this submarket — average credit score on applications, eviction rate, late-payment / NSF rate, and stable-employment percentage? A property-management company in the area should have these aggregated.
- How much new for-sale + rental construction is in the pipeline within 1–3 miles? Heavy new supply typically softens prices + rents 12–24 months out; constrained supply supports both.
Investment metrics
- 1% rule
- 1.36% ✓
- Cap rate
- 11.68%
- Cash-on-cash
- 19.24%
- DSCR
- 1.86
- GRM
- 6.1
CMA / ARV
- ARV (on-the-fly)
- $174,110
- Comps found
- 4
Show comp detail 4 sales within ~0.75 mi
| Address | Dist | Beds/Ba | Sqft | Sold | Price | $/sf | Match |
|---|---|---|---|---|---|---|---|
| 1105 1st Ave | 0.28mi | 3/2.0 | 1,550 (+2%) | 14mo | $179,000 | $115 | 71 |
| 1513 2nd Ave Ave | 0.27mi | 3/2.0 | 1,720 (+14%) | 9mo | $115,000 | $67 | 57 |
| 202 S 12th St S | 0.19mi | 3/2.0 | 1,320 (-13%) | 20mo | $215,000 | $163 | 53 |
| 118 N 14th St N | 0.25mi | 3/1.0 | 1,634 (+8%) | 22mo | $146,000 | $89 | 53 |
Match score weights: distance 35% · size 25% · config 20% · recency 20%. Top-matched comps best support the ARV.
Projected returns pro-forma
-3.0% appreciation · 3.0% rent growth · sell at horizon
- IRR
- 11.2%
- Equity multiple
- 1.44×
- Total profit
- $11,130
- Equity at exit
- $13,419
- IRR
- 20.2%
- Equity multiple
- 2.70×
- Total profit
- $42,748
- Equity at exit
- $7,782
Cash invested: $25,200 (down + closing). Projections, not guarantees.
Landlord ↔ Tenant lean methodology
- Overall (STATE)
- 90 Strongly Landlord-Friendly
- State Louisiana
- 90 Strongly Landlord-Friendly · R+12
- County
- — inherits STATE
- City
- — inherits STATE
ZIP-level market 70648
- Home prices YoY
- -25.9%
- Active inventory
- 39
- Price-to-rent
- 6.1×
Monthly cashflow live
- Estimated rent
- $1,221 medium interval (Pro) →
- Mortgage (P&I)
- −$472
- Tax from tax record
- −$51 /mo · $610/yr
- Insurance
- −$38
- HOA
- −$0
- Vacancy / Maint / Mgmt
- −$256
- Net cashflow
- $404
Break-even live
Sensitivity live
| Price | -10% $455 | -5% $430 | +0% $404 | +5% $379 | +10% $353 |
|---|---|---|---|---|---|
| Rent | -10% $308 | -5% $356 | +0% $404 | +5% $452 | +10% $500 |
| Rate | -1.0pp $449 | -0.5pp $427 | base $404 | +0.5pp $381 | +1.0pp $357 |
UW: 25.0% down · 7.5% · 30yr · 1.5% tax · 5.0% vac · 8.0% maint · 8.0% mgmt
Financing live
Cash to close
- Down payment
- $22,500
- Closing costs
- $2,700
- Reserves months
- —
- Total cash needed
- —
Loan-product check · same deal, 3 products live
Conventional
25% down · 7.5% · 30yr
- Down + closing
- —
- Monthly P&I
- —
- Monthly cashflow
- —
- DSCR
- —
- Eligible?
- —
Personal DTI + credit; lowest rate.
DSCR
20% down · 8.5% · 30yr
- Down + closing
- —
- Monthly P&I
- —
- Monthly cashflow
- —
- DSCR
- —
- Eligible?
- —
No personal income docs; deal must DSCR.
Hard money
10% down · 12.0% · 12mo
- Down + closing
- —
- Monthly P&I
- —
- Monthly cashflow
- —
- DSCR
- —
- Eligible?
- —
Short-term bridge; refi at stabilization.
Listing history 22 events
-
2026-06-22days on market $90,000 Active 119 DOM
-
2026-06-21days on market $90,000 Active 118 DOM
-
2026-06-21days on market $90,000 Active 117 DOM
-
2026-06-18days on market $90,000 Active 115 DOM
-
2026-06-17days on market $90,000 Active 114 DOM
-
2026-06-16days on market $90,000 Active 113 DOM
-
2026-06-15days on market $90,000 Active 112 DOM
-
2026-06-13days on market $90,000 Active 110 DOM
-
2026-06-12days on market $90,000 Active 109 DOM
-
2026-06-09days on market $90,000 Active 106 DOM
-
2026-06-08days on market $90,000 Active 105 DOM
-
2026-06-07days on market $90,000 Active 104 DOM
-
2026-06-07days on market $90,000 Active 103 DOM
-
2026-06-04days on market $90,000 Active 100 DOM
-
2026-06-02days on market $90,000 Active 99 DOM
-
2026-06-01days on market $90,000 Active 98 DOM
-
2026-05-31days on market $90,000 Active 97 DOM
-
2026-05-31days on market $90,000 Active 96 DOM
-
2026-02-23$90,000 Active
-
2024-06-07soldstatus $1,600,000
-
2019-03-21soldstatus 183-char remark
Show marketing remark (183 chars)
Nice size home with a large kitchen and large master bedroom. Recently rented. Needs some work and would be a great investment property. House next door is also for sale - MLS 171805.
-
2019-01-21$35,000 183-char remark
Show marketing remark (183 chars)
Nice size home with a large kitchen and large master bedroom. Recently rented. Needs some work and would be a great investment property. House next door is also for sale - MLS 171805.
ⓘ Source: listings_history table (triggers on properties + properties_extension) + one-shot
backfill from property_details.listing_events for pre-trigger history.
Tax reassessment forecast LA · Resets to sale price
- Current annual tax
- $610 · $51/mo
- Projected year-2 tax
- $610 · $51/mo
- Expected delta
- $0/yr ($0/mo · 0.0%)
ⓘ Screening estimate from a state-policy table — verify with the county assessor before closing.
Climate risk First Street
- Flood 6/10 Major FEMA zone X (unshaded) · 72% chance over 30 yrs
- Wildfire 5/10 Major
- Heat 8/10 Severe 7 d/yr ≥110°F today · 20 d/yr by 30 yrs out
- Wind 9/10 Extreme 99% chance of damaging wind over 30 yrs
- Air quality 1/10 Low 0 unhealthy d/yr today · 0 by 30 yrs out
Nearby sold comps map
Loading sold comps map…
Walkable amenities ~0.75 mi
Loading nearby amenities…
Taxation est. · year 1
- Rental income
- $14,648
- − Mortgage interest
- −$5,041
- − Property taxes
- −$610
- − Insurance
- −$450
- − Repairs & maintenance
- −$1,172
- − Management
- −$1,172
- − Depreciation
- −$2,618
- Taxable income
- $3,585
- Est. tax owed @ 24.0%
- −$860
- After-tax cash flow
- $3,988/yr
For passive investors: Depreciation is non-cash, so a rental often shows a tax loss while cash-flowing — sheltering income. Rental losses are passive: they offset passive income freely, and up to $25,000/yr can offset ordinary (W-2) income if you actively participate and your MAGI is under $100k (phasing out to $0 by $150k); unused losses carry forward. On sale, claimed depreciation is recaptured at up to 25%, and gains may owe capital-gains tax (a 1031 exchange can defer both). Figures are a year-1 estimate at your 24.0% rate — not tax advice; consult a CPA.
Schools (NCES district)
- District
- Allen Parish
- NCES district ID
- 2200060
- Math proficiency
- 26% ▼ -46.00%
- Reading proficiency
- 42% ▼ -39.00%
- Median HH income
- $39,440
- Composite
- 28.45/100
- National rank
- #6751
- State rank
- #36 of 98 in LA
Livability — Kinder
- Score
- 75/100
- State rank
- #21
- US rank
- #4044
Category grades
Schools grade is shown separately in the Schools card above.
Census & demographics
- Census place
- Kinder, LA
- Population (ZIP)
- 6,994
Population outlook (Allen County) Hauer SSP2
- Today (2025)
- 25,056 people
- By 2030
- 24,668 · -1.5%
- By 2040
- 23,964 · -4.4%
- By 2050
- 23,166 · -7.5%
- By 2075
- 21,285 · -15.1%
- By 2100
- 15,904 · -36.5%
Race, ethnicity, and origin ACS 2023
- Neighborhood character
- Predominantly White (66%)
- Race & ethnicity
- White 66% Black 19% Two or more races 8% Hispanic / Latino 6% Asian 1% Native American 1%
- Hispanic origin (detail)
- Mexican 3%
- Common ancestry
- Lithuanian 10% Serbian 3% Slovak 2%
- Foreign-born
- 6% · Canada, Jamaica
- Languages at home
- 92% English-only · Spanish 5% French/Haitian/Cajun 2% Arabic 1%
Political lean MEDSL · Allen
- 2024 margin
- Solid R (+61.0) · D 19.0% · R 80.0%
- 2008→2024 swing
- -24.7pp toward R · 2008: -36.4pp · 2024: -61.0pp
- All cycles
- 2024: R+61.0 2020: R+55.7 2016: R+51.5 2012: R+41.7 2008: R+36.4
Not yet ingested
- Civics
- —
Market trends
- HPI YoY
- ▼ -42.24%
- Current HPI
- 120.6268
- Rent YoY
- —
- Metro
- —
- State GDP YoY
- ▲ 3.29%
- F500 in state
- 10
Industry mix (Fortune 500 HQ in LA)
| Industry | F500 HQs | Revenue |
|---|---|---|
| Telecommunications | 2 | $23B |
|
||
| Utilities | 1 | $12B |
|
||
| Wholesale / Distribution | 1 | $5B |
|
||
| Advertising | 1 | $2B |
|
||
Price history
+157.1% since first listed4 events — show timeline
- 2026-02-23 Listed $90,000 SWLAR
- 2024-06-07 Sold (Public Records) $1,600,000 Public Records
- 2019-03-21 Sold (MLS) — SWLAR
- 2019-01-21 Listed $35,000 SWLAR
Property tax history
+0.5%/yrLatest (2025): $610 · -0.1% YoY. Source: county tax records.
Cash-flow waterfall
monthlySold comps — $/sqft
last 12 mo · ≤1 miLoading sold comps…