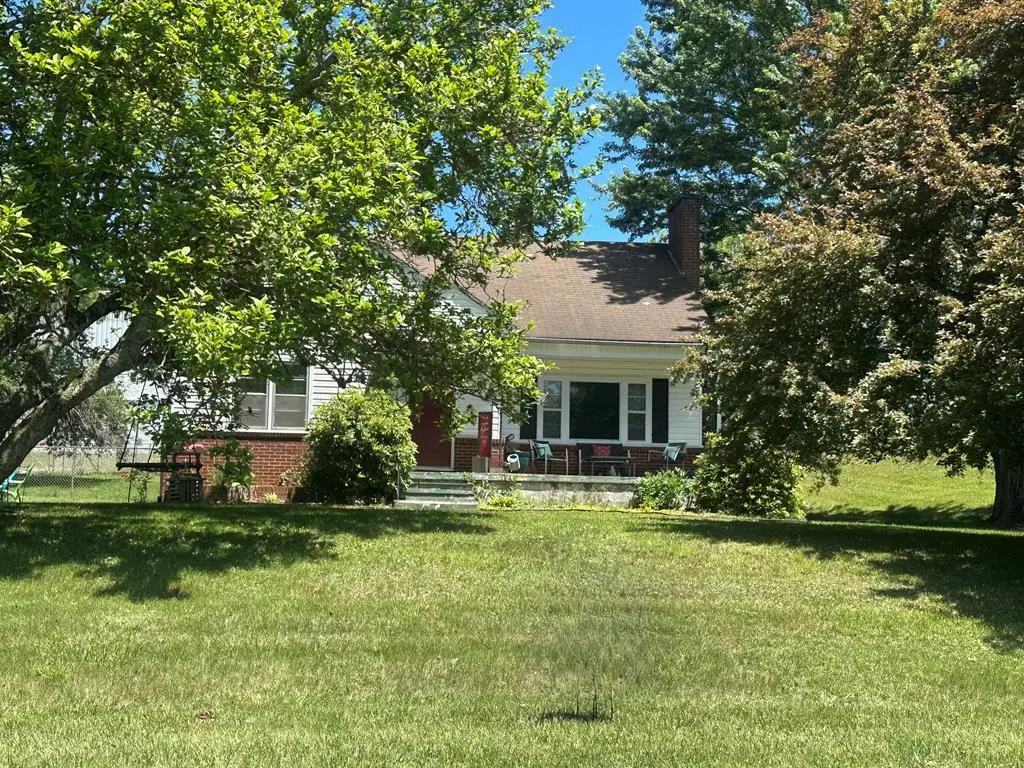
713 Powerhouse Rd · Independence, VA
Flood risk 1/10 · Minimal
- FEMA flood zone
- X (unshaded)
- Chance of flooding over 30 yrs
- 0.0%
- Est. flood insurance / yr
- $507 – $1,088
Fire risk 5/10 · Moderate
- Est. fire insurance / yr
- $666 – $1,236
Heat risk 2/10 · Minimal
- Hot days now (above 92°F)
- 8 days/yr
- Hot days in 30 yrs
- 21 days/yr
Wind risk 2/10 · Minimal
- Chance of severe wind over 30 yrs
- 0.0%
Air-quality risk 1/10 · Minimal
- Unhealthy air days now
- 0 days/yr
- Unhealthy air days in 30 yrs
- 0 days/yr
Risk factors via First Street. Map © Google.
Why this score? — see what drove the D grade
The composite is a weighted blend of 9 inputs, each scored 0–100. Each bar is that input's sub-score; the figure is the points it added to the 100-point composite (weight × sub-score).
- Cash flow +9.4/30.0
- ARV discount +7.5/15.0
- Appreciation +6.9/10.0
- Schools +5.9/10.0
- Livability +3.3/5.0
- DSCR +2.6/10.0
- Rent growth +2.5/5.0
- Condition / age +2.5/5.0
- 1% rule +1.5/10.0
$159,000
🖨 Deal sheet (PDF) 📄 Offer letter ✓ Due diligence
Listing remarks
Charming In-Town Home with Endless Potential! Priced to sell! Don't miss this opportunity to own a spacious home full of character and potential in the heart of Independence! Conveniently located close to town amenities, this approximately 1,900 sq ft home offers plenty of living space, flexible room options and solid investment potential! Built in 1960, this home features 4 bedrooms with flexible space that could easily serve as 5th bedroom, nursery, office or oversized walk-in closet. Whether your looking for a primary residence, rental property, or renovation project, this home offers a fantastic opportunity to build equity and make it your own. Convenient location, generous living space
Key facts
- 0.46 acre lot
- Built 1960
- Listed 18 days
Property features AI
Exterior
- Utilities: Public water; Public sewer; Propane
- Home design: Two-story single-family residence; Residential property; Brick and vinyl siding exterior
- Construction: Shingle roof; Unfinished basement
- Exterior features: Level lot
Interior
- Kitchen: Electric range; Refrigerator; Dishwasher
- Flooring: Vinyl flooring; Wood flooring
- Bathrooms: 1 full bathroom; 1 half bathroom
- Heating & cooling: Baseboard heating; Heat pump; Propane heating; Wall/window cooling units
- Interior features: Insulated windows; Wood-burning fireplace
- Laundry & utility: Washer; Dryer
Neighborhood map
What this means for you Summary
Snapshot
- This is a 2-bed/1.5-bath single-family listed at $159k.
Deal economics
- At list price, monthly cash flow is $-113 ($-1k/yr) — negative.
- To cash-flow at today's rent, offer at most $139k (12.5% below list).
- To meet the 1% rule (rent ≥ 1% of price), the offer needs to be $104k (34.6% below list).
- Recommended offer: $104k (34.6% below list) — sets the bar for 1% rule.
- Cap rate 5.4% vs local median 1.8% in Independence — top-decile yield for the area; either an underpriced asset or a hidden risk that comps aren't pricing in. Stress-test before assuming the spread holds.
Location & tenants
- Location reads 66/100 on livability (#320 in VA) — a middle-class / working-renter tenant base. Strengths: cost of living A+, housing A+, crime B; Watch: health & safety C-, amenities F, commute F.
- Grayson County Public School District (rural): math 68% / reading 76% proficiency, ranked #27 of 131 in VA (top 21%) — strong family-tenant draw, lease renewals of 3-5y typical.
- Zoned schools: Independence Elementary (math 62% / reading 77%, grade A-, #313 of 1,108 statewide, top 32%, 277 students, 89% FRL); Independence Middle (math 60% / reading 73%, grade A-, #107 of 342 statewide, top 33%, 262 students, 88% FRL); Grayson County High (math 82% / reading 82%, grade A, #40 of 319 statewide, top 15%, 465 students, 87% FRL) — zoned schools average 88% FRL vs 53% district-wide (35 pts higher); higher-poverty schools than district average — tighter screening recommended.
- Market conditions: 47 active listings in the ZIP; 38 units permitted in Grayson County in 2024 (0 in 5+ unit buildings).
Forward outlook
- In year one you build about $7k of equity ($1k loan paydown + $6k appreciation (3.7% local appreciation)).
- Grayson County population projected at -24% by 2050 — secular population decline; favor cash flow + early exit over multi-decade hold.
- By year 5, paydown + projected appreciation supports a ~$30k cash-out refi (75% LTV) — recoverable capital for the next deal without selling this one.
Negotiation context
- It's been on market 18 days — a 2% lower offer ($157k) is reasonable based on typical stale-listing flexibility.
- Current owner paid $69k; list at $159k implies a 130% gain — meaningful room to come down on a strong offer.
Risks & watch-outs
- Climate carrying-cost: moderate wildfire risk — expect insurance premiums to compound above CPI over the hold.
Questions for the listing agent
- What do current leases actually rent for vs. the listed asking? Can we see a recent rent roll and the last 12 months of T-12 income?
- Built in 1960 — when were the roof, HVAC, electrical panel, plumbing, and water heater last replaced?
- Is there a deadline driving the sale (1031 exchange, divorce, estate, relocation)? That informs how much negotiation room exists.
- Schools are A-rated — typically a magnet for longer-tenancy family renters. What's the average tenant stay here, and is there a school-zone premium baked into asking?
- The area grade is low — what's the realistic commute time and amenity access for the typical tenant pool here? Any planned neighborhood developments (good or bad) we should know about?
- What's the average days-on-market for RENTAL listings here right now (not sales)? A rising rental-DOM trend means longer vacancies and softer asking-rent achievability than the comps imply.
- What's the recent tenant-quality profile in this submarket — average credit score on applications, eviction rate, late-payment / NSF rate, and stable-employment percentage? A property-management company in the area should have these aggregated.
- How much new for-sale + rental construction is in the pipeline within 1–3 miles? Heavy new supply typically softens prices + rents 12–24 months out; constrained supply supports both.
Investment metrics
- 1% rule
- 0.65% ✗
- Cap rate
- 5.44%
- Cash-on-cash
- -3.04%
- DSCR
- 0.86
- GRM
- 12.8
CMA / ARV
- ARV (on-the-fly)
- $455,760
- Comps found
- 2
Show comp detail 2 sales within ~0.75 mi
| Address | Dist | Beds/Ba | Sqft | Sold | Price | $/sf | Match |
|---|---|---|---|---|---|---|---|
| 1011 South Main St | 0.30mi | 3/1.5 (+1) | 1,665 (-12%) | 11mo | $400,000 | $240 | 52 |
| 217 Bond Ave | 0.56mi | 3/1.5 (+1) | 1,820 (-4%) | 22mo | $165,000 | $91 | 43 |
Match score weights: distance 35% · size 25% · config 20% · recency 20%. Top-matched comps best support the ARV.
Projected returns pro-forma
3.7% appreciation · 3.0% rent growth · sell at horizon
- IRR
- 6.7%
- Equity multiple
- 1.40×
- Total profit
- $17,890
- Equity at exit
- $77,885
- IRR
- 9.2%
- Equity multiple
- 2.49×
- Total profit
- $66,449
- Equity at exit
- $125,256
Cash invested: $44,520 (down + closing). Projections, not guarantees.
Landlord ↔ Tenant lean methodology
- Overall (STATE)
- 55 Moderately Landlord-Leaning
- State Virginia
- 55 Moderately Landlord-Leaning · D+2
- County
- — inherits STATE
- City
- — inherits STATE
ZIP-level market 24348
- Home prices YoY
- 1.8%
- Active inventory
- 47
- Price-to-rent
- 12.8×
Monthly cashflow live
- Estimated rent
- $1,039 medium interval (Pro) →
- Mortgage (P&I)
- −$834
- Tax from tax record
- −$34 /mo · $404/yr
- Insurance
- −$66
- HOA
- −$0
- Vacancy / Maint / Mgmt
- −$218
- Net cashflow
- $-113
Break-even live
Sensitivity live
| Price | -10% $-23 | -5% $-68 | +0% $-113 | +5% $-158 | +10% $-203 |
|---|---|---|---|---|---|
| Rent | -10% $-195 | -5% $-154 | +0% $-113 | +5% $-72 | +10% $-31 |
| Rate | -1.0pp $-33 | -0.5pp $-72 | base $-113 | +0.5pp $-154 | +1.0pp $-196 |
UW: 25.0% down · 7.5% · 30yr · 1.5% tax · 5.0% vac · 8.0% maint · 8.0% mgmt
Financing live
Cash to close
- Down payment
- $39,750
- Closing costs
- $4,770
- Reserves months
- —
- Total cash needed
- —
Loan-product check · same deal, 3 products live
Conventional
25% down · 7.5% · 30yr
- Down + closing
- —
- Monthly P&I
- —
- Monthly cashflow
- —
- DSCR
- —
- Eligible?
- —
Personal DTI + credit; lowest rate.
DSCR
20% down · 8.5% · 30yr
- Down + closing
- —
- Monthly P&I
- —
- Monthly cashflow
- —
- DSCR
- —
- Eligible?
- —
No personal income docs; deal must DSCR.
Hard money
10% down · 12.0% · 12mo
- Down + closing
- —
- Monthly P&I
- —
- Monthly cashflow
- —
- DSCR
- —
- Eligible?
- —
Short-term bridge; refi at stabilization.
Listing history 15 events
-
2026-06-21days on market $159,000 Active 18 DOM
-
2026-06-21days on market $159,000 Active 17 DOM
-
2026-06-18days on market $159,000 Active 15 DOM
-
2026-06-17days on market $159,000 Active 14 DOM
-
2026-06-16days on market $159,000 Active 13 DOM
-
2026-06-15days on market $159,000 Active 12 DOM
-
2026-06-15days on market $159,000 Active 11 DOM
-
2026-06-13days on market $159,000 Active 10 DOM
-
2026-06-12days on market $159,000 Active 9 DOM
-
2026-06-09days on market $159,000 Active 6 DOM
-
2026-06-08days on market $159,000 Active 5 DOM
-
2026-06-08days on market $159,000 Active 4 DOM
-
2026-06-07days on market $159,000 Active 3 DOM
-
2026-06-04remarks 699-char remark
-
2026-06-04$159,000 Active 1 DOM
ⓘ Source: listings_history table (triggers on properties + properties_extension) + one-shot
backfill from property_details.listing_events for pre-trigger history.
Tax reassessment forecast VA · Resets to sale price
- Current annual tax
- $404 · $34/mo
- Projected year-2 tax
- $1,304 · $109/mo
- Expected delta
- +$900/yr (+$75/mo · 222.7%)
ⓘ Screening estimate from a state-policy table — verify with the county assessor before closing.
Climate risk First Street
- Flood 1/10 Low FEMA zone X (unshaded) · 0% chance over 30 yrs
- Wildfire 5/10 Major
- Heat 2/10 Low 8 d/yr ≥92°F today · 21 d/yr by 30 yrs out
- Wind 2/10 Low 0% chance of damaging wind over 30 yrs
- Air quality 1/10 Low 0 unhealthy d/yr today · 0 by 30 yrs out
Nearby sold comps map
Loading sold comps map…
Walkable amenities ~0.75 mi
Loading nearby amenities…
Taxation est. · year 1
- Rental income
- $12,469
- − Mortgage interest
- −$8,906
- − Property taxes
- −$404
- − Insurance
- −$795
- − Repairs & maintenance
- −$998
- − Management
- −$998
- − Depreciation
- −$4,625
- Taxable loss
- −$4,257
- Est. tax savings @ 24.0%
- +$1,022
- After-tax cash flow
- $-332/yr
For passive investors: Depreciation is non-cash, so a rental often shows a tax loss while cash-flowing — sheltering income. Rental losses are passive: they offset passive income freely, and up to $25,000/yr can offset ordinary (W-2) income if you actively participate and your MAGI is under $100k (phasing out to $0 by $150k); unused losses carry forward. On sale, claimed depreciation is recaptured at up to 25%, and gains may owe capital-gains tax (a 1031 exchange can defer both). Figures are a year-1 estimate at your 24.0% rate — not tax advice; consult a CPA.
Schools (NCES district)
- District
- Grayson County Public School District
- NCES district ID
- 5101690
- Math proficiency
- 68% ▼ -20.00%
- Reading proficiency
- 76% ▼ -7.00%
- Median HH income
- $31,429
- Composite
- 59.22/100
- National rank
- #942
- State rank
- #27 of 131 in VA
Livability — Independence
- Score
- 66/100
- State rank
- #320
- US rank
- #11693
Category grades
Schools grade is shown separately in the Schools card above.
Census & demographics
- Census place
- Independence, VA
- Population (ZIP)
- 5,095
Population outlook (Grayson County) Hauer SSP2
- Today (2025)
- 14,252 people
- By 2030
- 13,634 · -4.3%
- By 2040
- 12,202 · -14.4%
- By 2050
- 10,811 · -24.1%
- By 2075
- 8,069 · -43.4%
- By 2100
- 5,647 · -60.4%
Race, ethnicity, and origin ACS 2023
- Neighborhood character
- Predominantly White (80%)
- Race & ethnicity
- White 80% Black 13% Two or more races 4% Hispanic / Latino 3% Asian 2%
- Common ancestry
- Serbian 1% Italian 1% Slovak 1%
- Foreign-born
- 1% · Canada
- Languages at home
- 96% English-only · Spanish 3% French/Haitian/Cajun 1%
Political lean MEDSL · Grayson
- 2024 margin
- Solid R (+62.2) · D 18.6% · R 80.8%
- 2008→2024 swing
- -33.7pp toward R · 2008: -28.5pp · 2024: -62.2pp
- All cycles
- 2024: R+62.2 2020: R+61.4 2016: R+57.7 2012: R+37.9 2008: R+28.5
Not yet ingested
- Civics
- —
Market trends
- HPI YoY
- ▲ 3.70%
- Current HPI
- 210.8969
- Rent YoY
- —
- Metro
- —
- State GDP YoY
- ▲ 2.40%
- F500 in state
- 50
Industry mix (Fortune 500 HQ in VA)
| Industry | F500 HQs | Revenue |
|---|---|---|
| Aerospace / Defense | 4 | $236B |
|
||
| Technology / Defense | 3 | $32B |
|
||
| Financial Services | 2 | $176B |
|
||
| Utilities | 2 | $27B |
|
||
| Insurance | 2 | $25B |
|
||
| Technology | 2 | $15B |
|
||
Price history
+130.4% since first listed2 events — show timeline
- 2026-06-03 Listed $159,000 SWVAR
- 2015-09-11 Sold (Public Records) $69,000 Public Records
Property tax history
+0.3%/yrLatest (2025): $404 · -25.9% YoY. Source: county tax records.
Cash-flow waterfall
monthlySold comps — $/sqft
last 12 mo · ≤1 miLoading sold comps…