306 N North 8th Ave · Lanett, AL
Flood risk 1/10 · Minimal
- FEMA flood zone
- X (unshaded)
- Chance of flooding over 30 yrs
- 0.0%
- Est. flood insurance / yr
- $507 – $1,088
Fire risk 3/10 · Minor
- Est. fire insurance / yr
- $916 – $1,700
Heat risk 6/10 · Moderate
- Hot days now (above 106°F)
- 7 days/yr
- Hot days in 30 yrs
- 20 days/yr
Wind risk 6/10 · Moderate
- Chance of severe wind over 30 yrs
- 60.0%
Air-quality risk 3/10 · Minor
- Unhealthy air days now
- 3 days/yr
- Unhealthy air days in 30 yrs
- 4 days/yr
Risk factors via First Street. Map © Google.
Why this score? — see what drove the C+ grade
The composite is a weighted blend of 9 inputs, each scored 0–100. Each bar is that input's sub-score; the figure is the points it added to the 100-point composite (weight × sub-score).
- Cash flow +30.0/30.0
- DSCR +10.0/10.0
- 1% rule +8.2/10.0
- ARV discount +7.5/15.0
- Livability +3.0/5.0
- Rent growth +2.5/5.0
- Condition / age +2.5/5.0
- Schools +0.9/10.0
- Appreciation +0.0/10.0
$102,000
🖨 Deal sheet (PDF) 📄 Offer letter ✓ Due diligence
Listing remarks
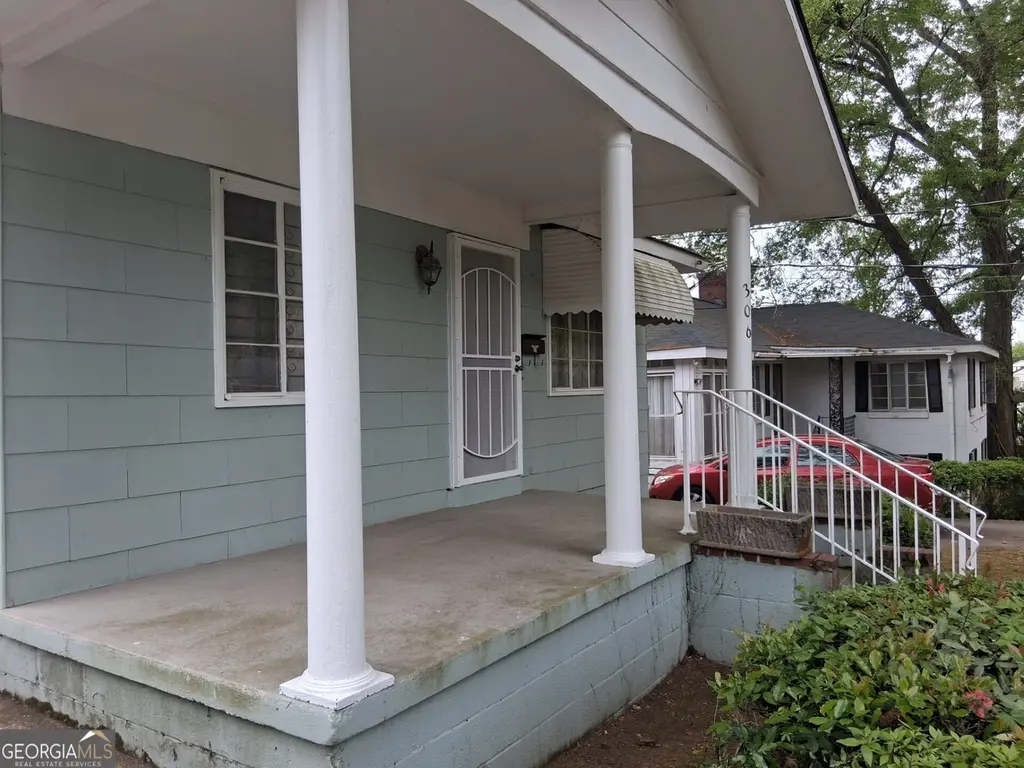
Home ready for you to move in. Three bedrooms, Large den and living room. Central heat and air. Hardwood under carpet
Key facts
- 0.25 acre lot
- Built 1950
- Listed 37 days
Property features AI
Finance
- HOA & community: No HOA
Exterior
- Parking: Carport
- Utilities: Public water; Public sewer; Cable available; Natural gas available
- Home design: Single-family residence (house); Resale property; One story
- Construction: Built in 1950; Aluminum siding; Metal roof; Slab foundation
- Exterior features: City lot
Interior
- Kitchen: Oven; Refrigerator
- Bedrooms: Three bedrooms on the main level
- Flooring: Carpet; Hardwood
- Bathrooms: One full bathroom on the main level
- Heating & cooling: Central heating; Central air conditioning
- Interior features: One-level living; Den and family room; Breakfast area
- Laundry & utility: Laundry closet
Neighborhood map
What this means for you Summary
Snapshot
- This is a 3-bed/1.0-bath single-family listed at $102k.
Deal economics
- At list price, monthly cash flow is $443 ($5k/yr) — positive.
- The deal already cash-flows at list — no discount required.
- Meets the 1% rule at list price ($1k rent vs $102k).
- Recommended offer: $99k (3.0% below list) — sets the bar for market timing.
- Cap rate 11.5% vs local median 5.8% in Lanett — top-decile yield for the area; either an underpriced asset or a hidden risk that comps aren't pricing in. Stress-test before assuming the spread holds.
Location & tenants
- Location reads 60/100 on livability (#301 in AL) — a middle-class / working-renter tenant base. Strengths: cost of living A+, housing A+; Watch: crime F, amenities F, commute F.
- Lanett City (town): math 5% / reading 19% proficiency, ranked #117 of 129 in AL (top 91%) — low school quality limits family demand, transient renter base, plan for 1-2y turnover; 87% free/reduced lunch — lower-income household profile, screen leases tightly.
- Zoned schools: Lanett Junior High School (math 2% / reading 17%, grade F, #227 of 257 statewide, top 90%, 155 students, 96% FRL).
- Market conditions: 95 active listings in the ZIP; 4 comparable units currently listed for rent nearby; rentals at typical pace (median 22d on market — plan ~3-4 weeks tenant-placement turnaround); 43 units permitted in Chambers County in 2024 (0 in 5+ unit buildings).
Forward outlook
- Local home prices are declining (-3.0%/yr); year-one equity from $705 of loan paydown is wiped out by about $3k of value loss. Plan a longer hold.
- Chambers County population projected to shrink 7% by 2050 — rents likely to lag national; underwrite the cash flow, not the appreciation.
- At projected returns (-3.0% appreciation + 3.0% rent growth), your $29k cash investment doubles in ~7 years — after that, you're playing with house money.
Negotiation context
- It's been on market 37 days — a 3% lower offer ($99k) is reasonable based on typical stale-listing flexibility.
- 2 sale attempts with the ask held roughly flat each time — persistent listings suggest the price (not the market) is what's stuck; bring a comps-based counter.
- Current owner paid $48k; list at $102k implies a 112% gain — meaningful room to come down on a strong offer.
Risks & watch-outs
- Watch-outs: built in 1950 — expect roof / HVAC / electrical / plumbing capex.
- Climate carrying-cost: major wind risk, 60% chance of damaging wind over 30y; extreme-heat days projected 7→20/yr by 2055 (HVAC capex compounding) — expect insurance premiums to compound above CPI over the hold.
Questions for the listing agent
- It's been on market 37 days. Have you received any prior offers? Is the seller open to a 3% concession, seller financing, or rate buy-down credit?
- Built in 1950 — when were the roof, HVAC, electrical panel, plumbing, and water heater last replaced?
- Is there a deadline driving the sale (1031 exchange, divorce, estate, relocation)? That informs how much negotiation room exists.
- Schools are F-rated, which usually means shorter tenancies and higher turnover. Who's the typical renter profile here, and what's been the actual vacancy rate?
- Crime grade is F in this area — have there been break-ins, vandalism, or insurance claims at this property in the last 3 years? What carrier currently insures it and at what premium?
- What's the average days-on-market for RENTAL listings here right now (not sales)? A rising rental-DOM trend means longer vacancies and softer asking-rent achievability than the comps imply.
- What's the recent tenant-quality profile in this submarket — average credit score on applications, eviction rate, late-payment / NSF rate, and stable-employment percentage? A property-management company in the area should have these aggregated.
- How much new for-sale + rental construction is in the pipeline within 1–3 miles? Heavy new supply typically softens prices + rents 12–24 months out; constrained supply supports both.
Investment metrics
- 1% rule
- 1.32% ✓
- Cap rate
- 11.50%
- Cash-on-cash
- 18.61%
- DSCR
- 1.83
- GRM
- 6.3
CMA / ARV
- ARV (on-the-fly)
- $49,434
- Comps found
- 12
Show comp detail 12 sales within ~0.75 mi
| Address | Dist | Beds/Ba | Sqft | Sold | Price | $/sf | Match |
|---|---|---|---|---|---|---|---|
| 811 Cherry Dr | 0.21mi | 3/2.0 | 1,144 (-3%) | 1mo | $208,000 | $182 | 81 |
| 503 S 6th | 0.37mi | 3/1.0 | 1,168 (-1%) | 11mo | $70,000 | $60 | 72 |
| 902 S Jennings | 0.59mi | 2/1.0 (-1) | 1,204 (+2%) | 6mo | $21,000 | $17 | 58 |
| 909 N 13th St | 0.51mi | 3/1.0 | 1,075 (-9%) | 4mo | $167,000 | $155 | 58 |
| 1110 N 3rd St | 0.28mi | 2/2.0 (-1) | 1,064 (-10%) | 5mo | $45,000 | $42 | 57 |
| 403 N 15th St | 0.66mi | 3/1.0 | 1,084 (-8%) | 2mo | $32,500 | $30 | 55 |
| 1412 S 7th St | 0.73mi | 3/1.0 | 1,144 (-3%) | 12mo | $32,000 | $28 | 52 |
| 1006 South 5th St | 0.40mi | 3/2.0 | 1,000 (-15%) | 4mo | $185,000 | $185 | 49 |
| 307 S 11th St | 0.73mi | 2/1.0 (-1) | 1,216 (+3%) | 12mo | $31,000 | $25 | 46 |
| 1501 1st Street St | 0.61mi | 3/2.0 | 1,294 (+10%) | 7mo | $84,900 | $66 | 45 |
| 609 S 11th Ave | 0.54mi | 2/1.0 (-1) | 1,352 (+15%) | 6mo | $50,000 | $37 | 40 |
| 911 South 8th St | 0.57mi | 2/2.0 (-1) | 1,344 (+14%) | 5mo | $42,500 | $32 | 36 |
Match score weights: distance 35% · size 25% · config 20% · recency 20%. Top-matched comps best support the ARV.
Projected returns pro-forma
-3.0% appreciation · 3.0% rent growth · sell at horizon
- IRR
- 10.3%
- Equity multiple
- 1.41×
- Total profit
- $11,642
- Equity at exit
- $15,209
- IRR
- 19.4%
- Equity multiple
- 2.62×
- Total profit
- $46,323
- Equity at exit
- $8,819
Cash invested: $28,560 (down + closing). Projections, not guarantees.
Landlord ↔ Tenant lean methodology
- Overall (STATE)
- 90 Strongly Landlord-Friendly
- State Alabama
- 90 Strongly Landlord-Friendly · R+15
- County
- — inherits STATE
- City
- — inherits STATE
ZIP-level market 36863
- Home prices YoY
- -29.1%
- Active inventory
- 95
- Price-to-rent
- 6.3×
Monthly cashflow live
- Estimated rent
- $1,345 medium interval (Pro) →
- Mortgage (P&I)
- −$535
- Tax from tax record
- −$42 /mo · $506/yr
- Insurance
- −$42
- HOA
- −$0
- Vacancy / Maint / Mgmt
- −$282
- Net cashflow
- $443
Break-even live
Sensitivity live
| Price | -10% $501 | -5% $472 | +0% $443 | +5% $414 | +10% $385 |
|---|---|---|---|---|---|
| Rent | -10% $337 | -5% $390 | +0% $443 | +5% $496 | +10% $549 |
| Rate | -1.0pp $494 | -0.5pp $469 | base $443 | +0.5pp $416 | +1.0pp $389 |
UW: 25.0% down · 7.5% · 30yr · 1.5% tax · 5.0% vac · 8.0% maint · 8.0% mgmt
Financing live
Cash to close
- Down payment
- $25,500
- Closing costs
- $3,060
- Reserves months
- —
- Total cash needed
- —
Loan-product check · same deal, 3 products live
Conventional
25% down · 7.5% · 30yr
- Down + closing
- —
- Monthly P&I
- —
- Monthly cashflow
- —
- DSCR
- —
- Eligible?
- —
Personal DTI + credit; lowest rate.
DSCR
20% down · 8.5% · 30yr
- Down + closing
- —
- Monthly P&I
- —
- Monthly cashflow
- —
- DSCR
- —
- Eligible?
- —
No personal income docs; deal must DSCR.
Hard money
10% down · 12.0% · 12mo
- Down + closing
- —
- Monthly P&I
- —
- Monthly cashflow
- —
- DSCR
- —
- Eligible?
- —
Short-term bridge; refi at stabilization.
Rent comps 4 comps
| Address | Beds | Baths | Sqft | Rent | $/sqft | DOM | Units | Dist |
|---|---|---|---|---|---|---|---|---|
| 808 S 10th St Lanett, AL | 3.0 | 2.0 | 1340 | $1,350 | $1.01 | 14d | 1 | 0.72mi |
| 813 3rd Ave Unit K West Point, GA | 2.0 | 2.5 | 1100 | $1,200 | $1.09 | 22d | 1 | 0.75mi |
| 500 E 7th St West Point, GA | 3.0 | 2.0 | 1308 | $1,600 | $1.22 | 22d | 1 | 1.08mi |
| 505 E 5th St West Point, GA | 3.0 | 1.0 | 1354 | $1,295 | $0.96 | 22d | 1 | 1.09mi |
Listing history 19 events
-
2026-06-17status $102,000 Under Contract 37 DOM
-
2026-06-17days on market $102,000 Active 37 DOM
-
2026-06-16days on market $102,000 Active 36 DOM
-
2026-06-15days on market $102,000 Active 35 DOM
-
2026-06-14days on market $102,000 Active 33 DOM
-
2026-06-12days on market $102,000 Active 32 DOM
-
2026-06-09days on market $102,000 Active 29 DOM
-
2026-06-08days on market $102,000 Active 28 DOM
-
2026-06-07days on market $102,000 Active 27 DOM
-
2026-06-07days on market $102,000 Active 26 DOM
-
2026-06-04days on market $102,000 Active 23 DOM
-
2026-06-02days on market $102,000 Active 22 DOM
-
2026-06-01days on market $102,000 Active 21 DOM
-
2026-05-31days on market $102,000 Active 20 DOM
-
2026-05-31days on market $102,000 Active 19 DOM
-
2026-05-21status Back On Market
-
2026-04-16status Under Contract
-
2026-04-02$102,000 New
-
2024-07-10soldstatus $48,000
ⓘ Source: listings_history table (triggers on properties + properties_extension) + one-shot
backfill from property_details.listing_events for pre-trigger history.
Tax reassessment forecast AL · Resets to sale price
- Current annual tax
- $506 · $42/mo
- Projected year-2 tax
- $506 · $42/mo
- Expected delta
- $0/yr ($0/mo · 0.0%)
ⓘ Screening estimate from a state-policy table — verify with the county assessor before closing.
Climate risk First Street
- Flood 1/10 Low FEMA zone X (unshaded) · 0% chance over 30 yrs
- Wildfire 3/10 Moderate
- Heat 6/10 Major 7 d/yr ≥106°F today · 20 d/yr by 30 yrs out
- Wind 6/10 Major 60% chance of damaging wind over 30 yrs
- Air quality 3/10 Moderate 3 unhealthy d/yr today · 4 by 30 yrs out
Nearby sold comps map
Loading sold comps map…
Walkable amenities ~0.75 mi
Loading nearby amenities…
Taxation est. · year 1
- Rental income
- $16,137
- − Mortgage interest
- −$5,714
- − Property taxes
- −$506
- − Insurance
- −$510
- − Repairs & maintenance
- −$1,291
- − Management
- −$1,291
- − Depreciation
- −$2,967
- Taxable income
- $3,859
- Est. tax owed @ 24.0%
- −$926
- After-tax cash flow
- $4,388/yr
For passive investors: Depreciation is non-cash, so a rental often shows a tax loss while cash-flowing — sheltering income. Rental losses are passive: they offset passive income freely, and up to $25,000/yr can offset ordinary (W-2) income if you actively participate and your MAGI is under $100k (phasing out to $0 by $150k); unused losses carry forward. On sale, claimed depreciation is recaptured at up to 25%, and gains may owe capital-gains tax (a 1031 exchange can defer both). Figures are a year-1 estimate at your 24.0% rate — not tax advice; consult a CPA.
Schools (NCES district)
- District
- Lanett City
- NCES district ID
- 0101980
- Math proficiency
- 5% ▼ -19.00%
- Reading proficiency
- 19% ▼ -4.00%
- Median HH income
- $27,834
- Composite
- 9.11/100
- National rank
- #9866
- State rank
- #117 of 129 in AL
Livability — Lanett
- Score
- 60/100
- State rank
- #301
- US rank
- #19159
Category grades
Schools grade is shown separately in the Schools card above.
Census & demographics
- Census place
- Lanett, AL
- Population (ZIP)
- 12,335
Population outlook (Chambers County) Hauer SSP2
- Today (2025)
- 33,868 people
- By 2030
- 33,504 · -1.1%
- By 2040
- 32,594 · -3.8%
- By 2050
- 31,422 · -7.2%
- By 2075
- 29,054 · -14.2%
- By 2100
- 25,431 · -24.9%
Race, ethnicity, and origin ACS 2023
- Neighborhood character
- Diverse neighborhood (Simpson 0.58)
- Race & ethnicity
- White 46% Black 45% Hispanic / Latino 6% Two or more races 3%
- Hispanic origin (detail)
- Mexican 3%
- Common ancestry
- Serbian 1%
- Foreign-born
- 5% · Canada, South Korea
- Languages at home
- 95% English-only · Spanish 4% Other Indo-European 1%
Political lean MEDSL · Chambers
- 2024 margin
- Strong R (+23.2) · D 38.0% · R 61.2%
- 2008→2024 swing
- -14.8pp toward R · 2008: -8.5pp · 2024: -23.2pp
- All cycles
- 2024: R+23.2 2020: R+15.6 2016: R+14.8 2012: R+5.1 2008: R+8.5
Not yet ingested
- Civics
- —
Market trends
- HPI YoY
- ▼ -63.32%
- Current HPI
- 154.4174
- Rent YoY
- —
- Metro
- —
- State GDP YoY
- ▲ 2.94%
- F500 in state
- 4
Industry mix (Fortune 500 HQ in AL)
| Industry | F500 HQs | Revenue |
|---|---|---|
| Financial Services | 1 | $8B |
|
||
| Healthcare | 1 | $5B |
|
||
Price history
+112.5% since first listed4 events — show timeline
- 2026-05-21 Relisted — GAMLS
- 2026-04-16 Pending — GAMLS
- 2026-04-02 Listed $102,000 GAMLS
- 2024-07-10 Sold (Public Records) $48,000 Public Records
Property tax history
+15.3%/yrLatest (2025): $506 · +211.6% YoY. Source: county tax records.
Cash-flow waterfall
monthlySold comps — $/sqft
last 12 mo · ≤1 miLoading sold comps…