 Multi-family
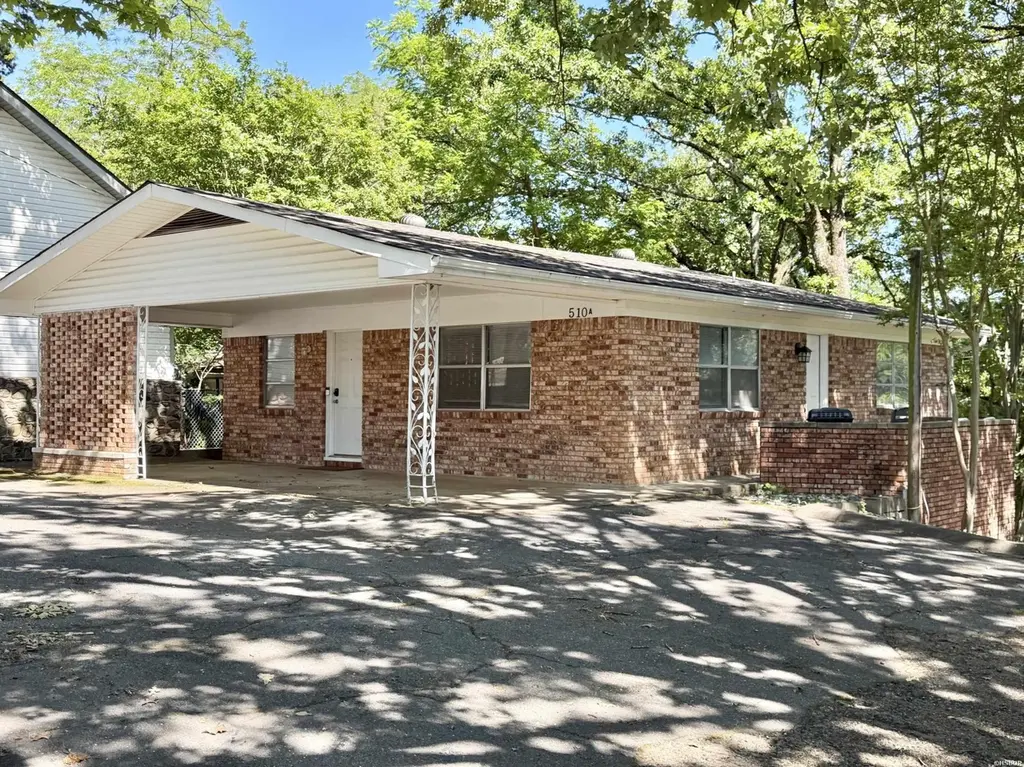
500 Burchwood Bay Rd · Hot Springs, AR
Flood risk 1/10 · Minimal
- FEMA flood zone
- X (unshaded)
- Chance of flooding over 30 yrs
- 0.0%
- Est. flood insurance / yr
- $507 – $1,088
Fire risk 2/10 · Minimal
- Est. fire insurance / yr
- $1,499 – $2,785
Heat risk 6/10 · Moderate
- Hot days now (above 111°F)
- 7 days/yr
- Hot days in 30 yrs
- 21 days/yr
Wind risk 4/10 · Minor
- Chance of severe wind over 30 yrs
- 10.0%
Air-quality risk 1/10 · Minimal
- Unhealthy air days now
- 0 days/yr
- Unhealthy air days in 30 yrs
- 0 days/yr
Risk factors via First Street. Map © Google.
Why this score? — see what drove the D- grade
The composite is a weighted blend of 9 inputs, each scored 0–100. Each bar is that input's sub-score; the figure is the points it added to the 100-point composite (weight × sub-score).
- Cash flow +12.0/30.0
- ARV discount +7.5/15.0
- Rent growth +4.1/5.0
- DSCR +3.5/10.0
- Livability +3.2/5.0
- Condition / age +2.5/5.0
- 1% rule +2.2/10.0
- Schools +2.0/10.0
- Appreciation +0.0/10.0
$495,000
🖨 Deal sheet (PDF) 📄 Offer letter ✓ Due diligence
Multi-family units
County records classify this as Multi-Family (2-4 Unit). Listing-text estimate: 1 unit. estimate disagrees with records
Listing remarks MLS
Fully renovated and fully furnished four-unit investment property located in a well known area across from Sam’s Pizza and within eyeshot of Lake Hamilton. Property includes a renovated 2BR/1BA unit, updated 1BR/1BA unit and two remodeled efficiency units, all featuring modern interiors and separate short-term rental licenses. One long-term tenant currently in place provides immediate income, while the remaining units offer flexibility for STR, mid-term or traditional rentals. Turnkey opportunity with strong income potential in a prime Hot Springs location.
Key facts
- Fully renovated
- Investment property
- Updated unit
Tags
Property features AI
Finance
- Other: Lot is approximately 0.4 acre; Lot in a subdivision; Will not subdivide
- Financial info: Annual taxes reported
Exterior
- Parking: Carport
- Utilities: Municipal electric; Public sewer; Public water
- Home design: Multifamily property (4 units); Residential zoning
- Construction: Architectural shingle roof; Slab and crawlspace foundation
- Exterior features: Gazebo; Paved road access; Brick and frame combination exterior
Interior
- Kitchen: Free-standing stove; Dishwasher; Refrigerator stays
- Bedrooms: Four 1-bedroom units; One 2-bedroom unit
- Flooring: Other (see remarks)
- Bathrooms: Four 1-bath units
- Heating & cooling: Central electric heat; Central electric cooling
- Interior features: Washer stays; Dryer stays; Ceiling fan; Furnished
- Laundry & utility: Washer included; Dryer included
Neighborhood map
What this means for you Summary
Snapshot
- This is a 2-bed/2.0-bath multifamily listed at $495k.
Deal economics
- At list price, monthly cash flow is $-118 ($-1k/yr) — negative.
- To cash-flow at today's rent, offer at most $474k (4.2% below list).
- To meet the 1% rule (rent ≥ 1% of price), the offer needs to be $356k (28.2% below list).
- Recommended offer: $356k (28.2% below list) — sets the bar for 1% rule.
- Cap rate 6.0% vs local median 2.8% in Hot Springs — top-decile yield for the area; either an underpriced asset or a hidden risk that comps aren't pricing in. Stress-test before assuming the spread holds.
Location & tenants
- Location reads 65/100 on livability (#140 in AR) — a middle-class / working-renter tenant base. Strengths: cost of living A+, housing A+, health & safety A-; Watch: crime F, amenities F, commute F.
- Hot Springs School District (urban): math 24% / reading 25% proficiency, ranked #195 of 238 in AR (top 82%) — low school quality limits family demand, transient renter base, plan for 1-2y turnover; 72% free/reduced lunch — lower-income household profile, screen leases tightly.
- Zoned schools: Hot Springs Junior Academy (math 20% / reading 29%, grade F, #166 of 201 statewide, top 84%, 815 students, 100% FRL, charter); Hot Springs World Class High School (math 12% / reading 24%, grade F, #252 of 292 statewide, top 87%, 739 students, 100% FRL, charter) — zoned schools average 100% FRL vs 72% district-wide (28 pts higher); higher-poverty schools than district average — tighter screening recommended.
- Market conditions: Rents rising fast (+6.4%/yr); 981 active listings in the ZIP; 2 comparable units currently listed for rent nearby; 117 units permitted in Garland County in 2024 (24 in 5+ unit buildings).
- At $3,556/mo this rent would consume 76% of the median local household income ($56k/yr) (locally 1442% of renters already pay >50% of income on rent) — very limited rent-growth headroom before tenants either downsize or default.
Forward outlook
- Local home prices are declining (-3.0%/yr); year-one equity from $3k of loan paydown is wiped out by about $15k of value loss. Plan a longer hold.
- Garland County population projected at +7% by 2050 — modest demand growth; plan on rents tracking national, not racing it.
Negotiation context
- It's been on market 32 days — a 3% lower offer ($480k) is reasonable based on typical stale-listing flexibility.
- 7 sale attempts since 13y ago with the ask held roughly flat each time — persistent listings suggest the price (not the market) is what's stuck; bring a comps-based counter.
- Current owner paid $180k; list at $495k implies a 175% gain — meaningful room to come down on a strong offer.
Risks & watch-outs
- Climate carrying-cost: extreme-heat days projected 7→21/yr by 2055 (HVAC capex compounding) — expect insurance premiums to compound above CPI over the hold.
Questions for the listing agent
- What do current leases actually rent for vs. the listed asking? Can we see a recent rent roll and the last 12 months of T-12 income?
- It's been on market 32 days. Have you received any prior offers? Is the seller open to a 28% concession, seller financing, or rate buy-down credit?
- Built in 1960 — when were the roof, HVAC, electrical panel, plumbing, and water heater last replaced?
- Is there a deadline driving the sale (1031 exchange, divorce, estate, relocation)? That informs how much negotiation room exists.
- Schools are D-rated, which usually means shorter tenancies and higher turnover. Who's the typical renter profile here, and what's been the actual vacancy rate?
- Crime grade is F in this area — have there been break-ins, vandalism, or insurance claims at this property in the last 3 years? What carrier currently insures it and at what premium?
- The area grade is low — what's the realistic commute time and amenity access for the typical tenant pool here? Any planned neighborhood developments (good or bad) we should know about?
- What's the average days-on-market for RENTAL listings here right now (not sales)? A rising rental-DOM trend means longer vacancies and softer asking-rent achievability than the comps imply.
- What's the recent tenant-quality profile in this submarket — average credit score on applications, eviction rate, late-payment / NSF rate, and stable-employment percentage? A property-management company in the area should have these aggregated.
- How much new apartment / multifamily construction is in the pipeline within 1–3 miles? Heavy new supply (>2% of stock underway) typically softens rents 12–24 months out; light construction supports rent growth.
Investment metrics
- 1% rule
- 0.72% ✗
- Cap rate
- 6.01%
- Cash-on-cash
- -1.02%
- DSCR
- 0.95
- GRM
- 11.6
CMA / ARV
No comps found within radius.
Projected returns pro-forma
-3.0% appreciation · 6.43% rent growth · sell at horizon
- IRR
- -14.8%
- Equity multiple
- 0.46×
- Total profit
- $-75,278
- Equity at exit
- $73,806
- IRR
- -1.9%
- Equity multiple
- 0.85×
- Total profit
- $-20,337
- Equity at exit
- $42,799
Cash invested: $138,600 (down + closing). Projections, not guarantees.
Landlord ↔ Tenant lean methodology
- Overall (STATE)
- 92 Strongly Landlord-Friendly
- State Arkansas
- 92 Strongly Landlord-Friendly · R+14
- County
- — inherits STATE
- City
- — inherits STATE
ZIP-level market 71913
- Home prices YoY
- -33.9%
- Rents YoY
- 6.4%
- Active inventory
- 981
- Price-to-rent
- 44.5×
Monthly cashflow live
- Estimated rent
- $3,556 medium interval (Pro) →
- Mortgage (P&I)
- −$2,596
- Tax from tax record
- −$125 /mo · $1,501/yr
- Insurance
- −$206
- HOA
- −$0
- Vacancy / Maint / Mgmt
- −$747
- Net cashflow
- $-118
Break-even live
Sensitivity live
| Price | -10% $162 | -5% $22 | +0% $-118 | +5% $-258 | +10% $-398 |
|---|---|---|---|---|---|
| Rent | -10% $-399 | -5% $-258 | +0% $-118 | +5% $23 | +10% $163 |
| Rate | -1.0pp $131 | -0.5pp $8 | base $-118 | +0.5pp $-246 | +1.0pp $-377 |
4-unit breakdown (identical units grouped — click to expand)
| Units | Beds | Baths | Est. rent |
|---|---|---|---|
| 1× unit | 2 | 1 | $927 |
| 3× units | 1 | 1 | $2,628 |
| #2 | 1 | 1 | $876 |
| #3 | 1 | 1 | $876 |
| #4 | 1 | 1 | $876 |
| Total (4 units) | $3,556 | ||
UW: 25.0% down · 7.5% · 30yr · 1.5% tax · 5.0% vac · 8.0% maint · 8.0% mgmt
Financing live
Cash to close
- Down payment
- $123,750
- Closing costs
- $14,850
- Reserves months
- —
- Total cash needed
- —
Loan-product check · same deal, 3 products live
Conventional
25% down · 7.5% · 30yr
- Down + closing
- —
- Monthly P&I
- —
- Monthly cashflow
- —
- DSCR
- —
- Eligible?
- —
Personal DTI + credit; lowest rate.
DSCR
20% down · 8.5% · 30yr
- Down + closing
- —
- Monthly P&I
- —
- Monthly cashflow
- —
- DSCR
- —
- Eligible?
- —
No personal income docs; deal must DSCR.
Hard money
10% down · 12.0% · 12mo
- Down + closing
- —
- Monthly P&I
- —
- Monthly cashflow
- —
- DSCR
- —
- Eligible?
- —
Short-term bridge; refi at stabilization.
Rent comps 2 comps
| Address | Beds | Baths | Sqft | Rent | $/sqft | DOM | Units | Dist |
|---|---|---|---|---|---|---|---|---|
| 114 Jennison Sq Hot Springs National Park, AR | 3.0 | 2.0 | 2000 | $2,200 | $1.10 | 45d | 1 | 0.95mi |
| 389 Lake Hamilton Dr Hot Springs National Park, AR | 1.0–3.0 | 1.0–2.5 | 1137 | $1,475 | $1.30 | 45d | 16 | 1.35mi |
Listing history 37 events
-
2026-06-22days on market $495,000 Active 32 DOM
-
2026-06-19days on market $495,000 Active 30 DOM
-
2026-06-18days on market $495,000 Active 29 DOM
-
2026-06-17days on market $495,000 Active 28 DOM
-
2026-06-16days on market $495,000 Active 27 DOM
-
2026-06-15days on market $495,000 Active 26 DOM
-
2026-06-14days on market $495,000 Active 24 DOM
-
2026-06-13days on market $495,000 Active 23 DOM
-
2026-06-10days on market $495,000 Active 21 DOM
-
2026-06-09days on market $495,000 Active 20 DOM
-
2026-06-08days on market $495,000 Active 19 DOM
-
2026-06-07days on market $495,000 Active 18 DOM
-
2026-06-05days on market $495,000 Active 15 DOM
-
2026-06-02days on market $495,000 Active 13 DOM
-
2026-06-01days on market $495,000 Active 12 DOM
-
2026-05-31days on market $495,000 Active 11 DOM
-
2026-05-30days on market $495,000 Active 10 DOM
-
2026-05-16$495,000 Active 569-char remark
Show marketing remark (569 chars)
Fully renovated and fully furnished four-unit investment property located in a well known area across from Sam’s Pizza and within eyeshot of Lake Hamilton. Property includes a renovated 2BR/1BA unit, updated 1BR/1BA unit and two remodeled efficiency units, all featuring modern interiors and separate short-term rental licenses. One long-term tenant currently in place provides immediate income, while the remaining units offer flexibility for STR, mid-term or traditional rentals. Turnkey opportunity with strong income potential in a prime Hot Springs location.
-
2026-05-07historical
-
2026-04-10price $499,000
-
2026-04-10price $499,000
-
2026-02-17$549,000 New Listing
-
2025-07-01historical
-
2025-03-21$499,500 New Listing
-
2025-03-06historical
-
2024-04-12price $469,500
-
2024-04-09$459,000 New Listing
-
2024-04-09price $469,500
-
2021-05-03soldstatus $180,000 Sold
-
2021-03-17historical
-
2021-03-17historical Take Backups
-
2020-09-15$200,000 New Listing
-
2013-03-14historical
-
2013-01-14$155,000
-
2010-08-31soldstatus $145,000
-
2008-04-28soldstatus $143,000
-
1991-02-15soldstatus $70,000
ⓘ Source: listings_history table (triggers on properties + properties_extension) + one-shot
backfill from property_details.listing_events for pre-trigger history.
Tax reassessment forecast AR · Resets to sale price
- Current annual tax
- $1,501 · $125/mo
- Projected year-2 tax
- $3,168 · $264/mo
- Expected delta
- +$1,667/yr (+$139/mo · 111.0%)
ⓘ Screening estimate from a state-policy table — verify with the county assessor before closing.
Climate risk First Street
- Flood 1/10 Low FEMA zone X (unshaded) · 0% chance over 30 yrs
- Wildfire 2/10 Low
- Heat 6/10 Major 7 d/yr ≥111°F today · 21 d/yr by 30 yrs out
- Wind 4/10 Moderate 10% chance of damaging wind over 30 yrs
- Air quality 1/10 Low 0 unhealthy d/yr today · 0 by 30 yrs out
Nearby sold comps map
Loading sold comps map…
Walkable amenities ~0.75 mi
Loading nearby amenities…
Taxation est. · year 1
- Rental income
- $42,672
- − Mortgage interest
- −$27,728
- − Property taxes
- −$1,501
- − Insurance
- −$2,475
- − Repairs & maintenance
- −$3,414
- − Management
- −$3,414
- − Depreciation
- −$14,400
- Taxable loss
- −$10,259
- Est. tax savings @ 24.0%
- +$2,462
- After-tax cash flow
- $1,047/yr
For passive investors: Depreciation is non-cash, so a rental often shows a tax loss while cash-flowing — sheltering income. Rental losses are passive: they offset passive income freely, and up to $25,000/yr can offset ordinary (W-2) income if you actively participate and your MAGI is under $100k (phasing out to $0 by $150k); unused losses carry forward. On sale, claimed depreciation is recaptured at up to 25%, and gains may owe capital-gains tax (a 1031 exchange can defer both). Figures are a year-1 estimate at your 24.0% rate — not tax advice; consult a CPA.
Schools (NCES district)
- District
- Hot Springs School District
- NCES district ID
- 0507890
- Math proficiency
- 24% ▼ -15.00%
- Reading proficiency
- 25% ▼ -12.00%
- Median HH income
- $28,817
- Composite
- 19.62/100
- National rank
- #8746
- State rank
- #195 of 238 in AR
Livability — Hot Springs
- Score
- 65/100
- State rank
- #140
- US rank
- #12498
Category grades
Schools grade is shown separately in the Schools card above.
Census & demographics
- Census place
- Hot Springs, AR
- County
- Garland County · 76,414 people
- City population
- 76,414
- Metro
- Hot Springs, AR
- Population (ZIP)
- 47,477
- Household income
- $56,010
- Rent vs Own
- Severe rent burden
- 1442.0
Population outlook (Garland County) Hauer SSP2
- Today (2025)
- 100,343 people
- By 2030
- 101,880 · +1.5%
- By 2040
- 104,804 · +4.4%
- By 2050
- 107,292 · +6.9%
- By 2075
- 113,182 · +12.8%
- By 2100
- 112,247 · +11.9%
Race, ethnicity, and origin ACS 2023
- Neighborhood character
- Predominantly White (79%)
- Race & ethnicity
- White 79% Hispanic / Latino 8% Black 8% Two or more races 6% Asian 1%
- Hispanic origin (detail)
- Mexican 6%
- Common ancestry
- Italian 3% Lithuanian 2% Slovak 2%
- Foreign-born
- 5% · Canada
- Languages at home
- 91% English-only · Spanish 7% Other Indo-European 1%
Political lean MEDSL · Garland
- 2024 margin
- Solid R (+36.2) · D 30.8% · R 67.0% · Other 2.2%
- 2008→2024 swing
- -11.3pp toward R · 2008: -25.0pp · 2024: -36.2pp
- All cycles
- 2024: R+36.2 2020: R+34.0 2016: R+34.1 2012: R+29.9 2008: R+25.0
Not yet ingested
- Civics
- —
Market trends
- HPI YoY
- ▼ -137.67%
- Current HPI
- 268.5228
- Rent YoY
- ▲ 6.43%
- Metro
- Hot Springs, AR
- State GDP YoY
- ▲ 3.80%
- F500 in state
- 10
Industry mix (Fortune 500 HQ in AR)
| Industry | F500 HQs | Revenue |
|---|---|---|
| Retail | 1 | $681B |
|
||
| Food / Agriculture | 1 | $53B |
|
||
| Retail / Energy | 1 | $22B |
|
||
| Transportation / Logistics | 1 | $12B |
|
||
| Energy | 1 | $4B |
|
||
Price history
+607.1% since first listed21 events — show timeline
- 2026-05-16 Listed $495,000 HSBOR
- 2026-05-13 Listed $495,000 CARMLS
- 2026-05-07 Listing Removed — CARMLS
- 2026-04-10 Price Changed $499,000 CARMLS
- 2026-04-10 Price Changed $499,000 HSBOR
- 2026-02-17 Listed $549,000 CARMLS
- 2025-07-01 Listing Removed — CARMLS
- 2025-03-21 Listed $499,500 CARMLS
- 2025-03-06 Listing Removed — CARMLS
- 2024-04-12 Price Changed $469,500 CARMLS
- 2024-04-09 Listed $459,000 CARMLS
- 2024-04-09 Price Changed $469,500 HSBOR
- 2021-05-03 Sold (MLS) $180,000 CARMLS
- 2021-03-17 Listing Removed — CARMLS
- 2021-03-17 Contingent — CARMLS
- 2020-09-15 Listed $200,000 CARMLS
- 2013-03-14 Listing Removed — CARMLS
- 2013-01-14 Listed $155,000 CARMLS
- 2010-08-31 Sold (Public Records) $145,000 Public Records
- 2008-04-28 Sold (Public Records) $143,000 Public Records
- 1991-02-15 Sold (Public Records) $70,000 Public Records
Property tax history
+3.7%/yrLatest (2025): $1,501 · -1.3% YoY. Source: county tax records.
Cash-flow waterfall
monthlySold comps — $/sqft
last 12 mo · ≤1 miLoading sold comps…