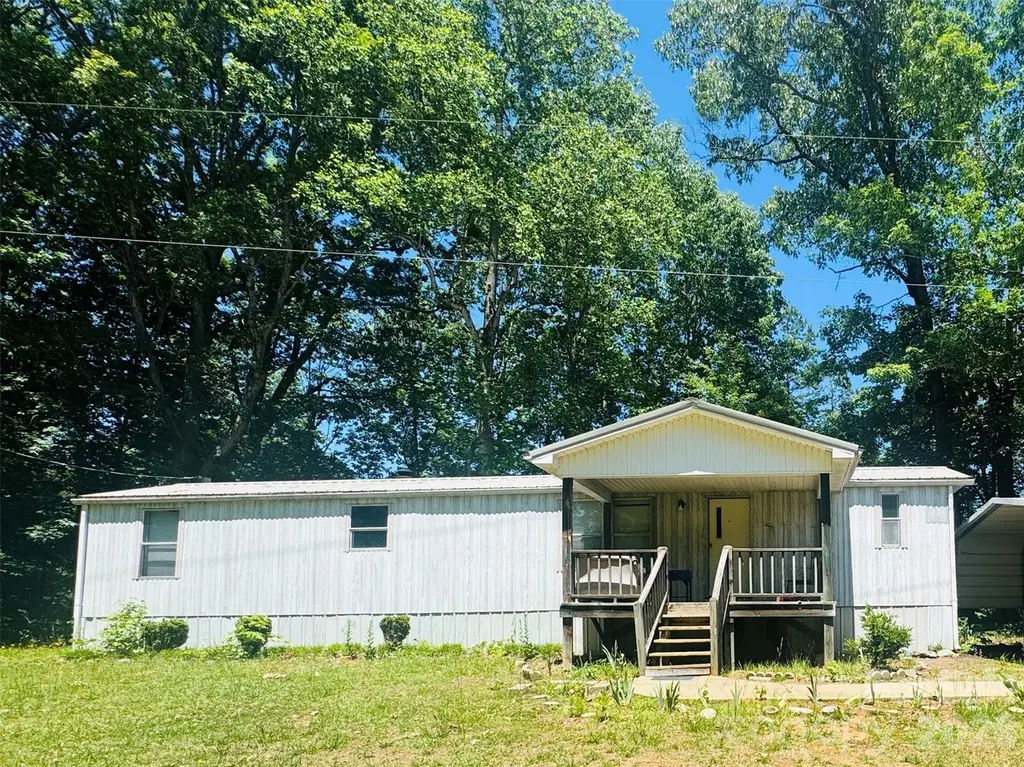
1178 Pierce Dr · Rockwell, NC
Flood risk 1/10 · Minimal
- FEMA flood zone
- X (unshaded)
- Chance of flooding over 30 yrs
- 0.0%
- Est. flood insurance / yr
- $507 – $1,088
Fire risk 4/10 · Minor
- Est. fire insurance / yr
- $906 – $1,684
Heat risk 5/10 · Moderate
- Hot days now (above 105°F)
- 7 days/yr
- Hot days in 30 yrs
- 17 days/yr
Wind risk 4/10 · Minor
- Chance of severe wind over 30 yrs
- 17.0%
Air-quality risk 3/10 · Minor
- Unhealthy air days now
- 2 days/yr
- Unhealthy air days in 30 yrs
- 3 days/yr
Risk factors via First Street. Map © Google.
Why this score? — see what drove the B- grade
The composite is a weighted blend of 9 inputs, each scored 0–100. Each bar is that input's sub-score; the figure is the points it added to the 100-point composite (weight × sub-score).
- Cash flow +30.0/30.0
- DSCR +10.0/10.0
- 1% rule +9.0/10.0
- ARV discount +7.5/15.0
- Livability +3.8/5.0
- Schools +2.6/10.0
- Rent growth +2.5/5.0
- Condition / age +2.5/5.0
- Appreciation +0.0/10.0
$89,500
🖨 Deal sheet (PDF) 📄 Offer letter ✓ Due diligence
Listing remarks
If you’re searching for an affordable starter home or investment opportunity with plenty of potential, this property could be the perfect fit! Nestled on 1.5 acres in a rural setting in Salisbury, this home offers privacy, and room to make it your own. Features include a spacious built-on front porch, perfect for relaxing and enjoying the country atmosphere. With some TLC, the possibilities are endless. The roof was replaced in 2025 per homeowner. This is an "As Is, Where Is" sale.
Key facts
- Privacy
- Built-on front porch
- 1.5 acres
Tags
Property features AI
Finance
- HOA & community: No HOA
Exterior
- Parking: Detached carport; Main level garage not present
- Utilities: Well water; Septic system
- Home design: Manufactured single-family home; One story; Crawl space foundation
- Construction: Aluminum and vinyl exterior; Crawl space foundation
- Exterior features: Private maintained road; Gravel road surface; Lot about 1.5 acres
Interior
- Kitchen: Electric range; Refrigerator
- Bedrooms: Two bedrooms on the main level
- Bathrooms: Two full bathrooms (both on the main level)
- Heating & cooling: Oil heating; Central air conditioning
- Interior features: 6 total rooms; Central air
- Laundry & utility: Washer hookup; Electric dryer hookup; Laundry located in hall
Neighborhood map
What this means for you Summary
Snapshot
- This is a 2-bed/2.0-bath other listed at $90k.
Deal economics
- At list price, monthly cash flow is $461 ($6k/yr) — positive.
- The deal already cash-flows at list — no discount required.
- Meets the 1% rule at list price ($1k rent vs $90k).
- Recommended offer: $87k (3.0% below list) — sets the bar for market timing.
- Cap rate 12.5% vs local median 4.1% in Rockwell — top-decile yield for the area; either an underpriced asset or a hidden risk that comps aren't pricing in. Stress-test before assuming the spread holds.
Location & tenants
- Location reads 76/100 on livability (#37 in NC, #3,505 nationally) — a middle-class / working-renter tenant base. Strengths: cost of living A+, housing A+, health & safety A+; Watch: amenities F, commute F.
- Rowan-Salisbury Schools (rural): math 26% / reading 35% proficiency, ranked #142 of 178 in NC (top 80%) — families likely to look elsewhere, expect single-tenant / working-renter base with shorter leases.
- Zoned schools: Rockwell Elementary (math 46% / reading 44%, grade D-, #568 of 1,410 statewide, top 41%, 519 students, 49% FRL); Erwin Middle (math 22% / reading 32%, grade F, #374 of 475 statewide, top 80%, 759 students, 56% FRL); East Rowan High (math 27% / reading 50%, grade F, #403 of 535 statewide, top 76%, 1,032 students, 51% FRL) — zoned schools at 52% FRL track the district average.
- Market conditions: 230 active listings in the ZIP; 592 units permitted in Rowan County in 2024 (5 in 5+ unit buildings).
Forward outlook
- Local home prices are declining (-3.0%/yr); year-one equity from $619 of loan paydown is wiped out by about $3k of value loss. Plan a longer hold.
- Rowan County population projected to shrink 6% by 2050 — rents likely to lag national; underwrite the cash flow, not the appreciation.
- At projected returns (-3.0% appreciation + 3.0% rent growth), your $25k cash investment doubles in ~6 years — after that, you're playing with house money.
Negotiation context
- It's been on market 39 days — a 3% lower offer ($87k) is reasonable based on typical stale-listing flexibility.
Risks & watch-outs
- Climate carrying-cost: extreme-heat days projected 7→17/yr by 2055 (HVAC capex compounding) — expect insurance premiums to compound above CPI over the hold.
Questions for the listing agent
- It's been on market 39 days. Have you received any prior offers? Is the seller open to a 3% concession, seller financing, or rate buy-down credit?
- Is there a deadline driving the sale (1031 exchange, divorce, estate, relocation)? That informs how much negotiation room exists.
- Schools are F-rated, which usually means shorter tenancies and higher turnover. Who's the typical renter profile here, and what's been the actual vacancy rate?
- What's the average days-on-market for RENTAL listings here right now (not sales)? A rising rental-DOM trend means longer vacancies and softer asking-rent achievability than the comps imply.
- What's the recent tenant-quality profile in this submarket — average credit score on applications, eviction rate, late-payment / NSF rate, and stable-employment percentage? A property-management company in the area should have these aggregated.
- How much new for-sale + rental construction is in the pipeline within 1–3 miles? Heavy new supply typically softens prices + rents 12–24 months out; constrained supply supports both.
Investment metrics
- 1% rule
- 1.40% ✓
- Cap rate
- 12.47%
- Cash-on-cash
- 22.06%
- DSCR
- 1.98
- GRM
- 6.0
CMA / ARV
No comps found within radius.
Projected returns pro-forma
-3.0% appreciation · 3.0% rent growth · sell at horizon
- IRR
- 14.7%
- Equity multiple
- 1.59×
- Total profit
- $14,802
- Equity at exit
- $13,345
- IRR
- 23.4%
- Equity multiple
- 3.02×
- Total profit
- $50,520
- Equity at exit
- $7,738
Cash invested: $25,060 (down + closing). Projections, not guarantees.
Landlord ↔ Tenant lean methodology
- Overall (STATE)
- 85 Strongly Landlord-Friendly
- State North Carolina
- 85 Strongly Landlord-Friendly · R+3
- County
- — inherits STATE
- City
- — inherits STATE
ZIP-level market 28146
- Home prices YoY
- -23.3%
- Active inventory
- 230
- Price-to-rent
- 6.0×
Monthly cashflow live
- Estimated rent
- $1,250 medium interval (Pro) →
- Mortgage (P&I)
- −$469
- Tax from tax record
- −$20 /mo · $242/yr
- Insurance
- −$37
- HOA
- −$0
- Vacancy / Maint / Mgmt
- −$263
- Net cashflow
- $461
Break-even live
Sensitivity live
| Price | -10% $511 | -5% $486 | +0% $461 | +5% $435 | +10% $410 |
|---|---|---|---|---|---|
| Rent | -10% $362 | -5% $411 | +0% $461 | +5% $510 | +10% $559 |
| Rate | -1.0pp $506 | -0.5pp $483 | base $461 | +0.5pp $438 | +1.0pp $414 |
UW: 25.0% down · 7.5% · 30yr · 1.5% tax · 5.0% vac · 8.0% maint · 8.0% mgmt
Financing live
Cash to close
- Down payment
- $22,375
- Closing costs
- $2,685
- Reserves months
- —
- Total cash needed
- —
Loan-product check · same deal, 3 products live
Conventional
25% down · 7.5% · 30yr
- Down + closing
- —
- Monthly P&I
- —
- Monthly cashflow
- —
- DSCR
- —
- Eligible?
- —
Personal DTI + credit; lowest rate.
DSCR
20% down · 8.5% · 30yr
- Down + closing
- —
- Monthly P&I
- —
- Monthly cashflow
- —
- DSCR
- —
- Eligible?
- —
No personal income docs; deal must DSCR.
Hard money
10% down · 12.0% · 12mo
- Down + closing
- —
- Monthly P&I
- —
- Monthly cashflow
- —
- DSCR
- —
- Eligible?
- —
Short-term bridge; refi at stabilization.
Listing history 15 events
-
2026-06-21days on market $89,500 Active 39 DOM
-
2026-06-18days on market $89,500 Active 36 DOM
-
2026-06-17days on market $89,500 Active 35 DOM
-
2026-06-16days on market $89,500 Active 34 DOM
-
2026-06-15days on market $89,500 Active 33 DOM
-
2026-06-13days on market $89,500 Active 31 DOM
-
2026-06-09pricedays on market $89,500 Active 27 DOM
-
2026-06-08days on market $95,000 Active 26 DOM
-
2026-06-07days on market $95,000 Active 25 DOM
-
2026-06-04days on market $95,000 Active 22 DOM
-
2026-06-03days on market $95,000 Active 21 DOM
-
2026-06-02days on market $95,000 Active 20 DOM
-
2026-06-01days on market $95,000 Active 19 DOM
-
2026-05-31days on market $95,000 Active 18 DOM
-
2026-05-13$95,000 Active
ⓘ Source: listings_history table (triggers on properties + properties_extension) + one-shot
backfill from property_details.listing_events for pre-trigger history.
Tax reassessment forecast NC · Resets to sale price
- Current annual tax
- $242 · $20/mo
- Projected year-2 tax
- $734 · $61/mo
- Expected delta
- +$492/yr (+$41/mo · 203.0%)
ⓘ Screening estimate from a state-policy table — verify with the county assessor before closing.
Climate risk First Street
- Flood 1/10 Low FEMA zone X (unshaded) · 0% chance over 30 yrs
- Wildfire 4/10 Moderate
- Heat 5/10 Major 7 d/yr ≥105°F today · 17 d/yr by 30 yrs out
- Wind 4/10 Moderate 17% chance of damaging wind over 30 yrs
- Air quality 3/10 Moderate 2 unhealthy d/yr today · 3 by 30 yrs out
Nearby sold comps map
Loading sold comps map…
Walkable amenities ~0.75 mi
Loading nearby amenities…
Taxation est. · year 1
- Rental income
- $15,000
- − Mortgage interest
- −$5,013
- − Property taxes
- −$242
- − Insurance
- −$448
- − Repairs & maintenance
- −$1,200
- − Management
- −$1,200
- − Depreciation
- −$2,604
- Taxable income
- $4,294
- Est. tax owed @ 24.0%
- −$1,030
- After-tax cash flow
- $4,498/yr
For passive investors: Depreciation is non-cash, so a rental often shows a tax loss while cash-flowing — sheltering income. Rental losses are passive: they offset passive income freely, and up to $25,000/yr can offset ordinary (W-2) income if you actively participate and your MAGI is under $100k (phasing out to $0 by $150k); unused losses carry forward. On sale, claimed depreciation is recaptured at up to 25%, and gains may owe capital-gains tax (a 1031 exchange can defer both). Figures are a year-1 estimate at your 24.0% rate — not tax advice; consult a CPA.
Schools (NCES district)
- District
- Rowan-Salisbury Schools
- NCES district ID
- 3704050
- Math proficiency
- 26% ▲ 2.00%
- Reading proficiency
- 35% ▲ 1.00%
- Median HH income
- $43,953
- Composite
- 26.01/100
- National rank
- #7317
- State rank
- #142 of 178 in NC
Livability — Rockwell
- Score
- 76/100
- State rank
- #37
- US rank
- #3505
Category grades
Schools grade is shown separately in the Schools card above.
Census & demographics
- County
- Rowan County · 103,630 people
- Metro
- Charlotte-Concord-Gastonia, NC-SC
- Population (ZIP)
- 31,292
- Household income
- $69,279
- Rent vs Own
- Severe rent burden
- 299.0
Population outlook (Rowan County) Hauer SSP2
- Today (2025)
- 140,430 people
- By 2030
- 140,193 · -0.2%
- By 2040
- 137,617 · -2.0%
- By 2050
- 131,826 · -6.1%
- By 2075
- 115,123 · -18.0%
- By 2100
- 92,774 · -33.9%
Race, ethnicity, and origin ACS 2023
- Neighborhood character
- Predominantly White (84%)
- Race & ethnicity
- White 84% Black 7% Two or more races 6% Hispanic / Latino 6% Asian 1%
- Hispanic origin (detail)
- Mexican 4%
- Common ancestry
- Slovak 3% Italian 3% Serbian 3%
- Foreign-born
- 3% · Canada
- Languages at home
- 94% English-only · Spanish 4% Russian/Polish/Slavic 1% Other Asian/Pacific 1%
Political lean MEDSL · Rowan
- 2024 margin
- Solid R (+35.9) · D 31.6% · R 67.5%
- 2008→2024 swing
- -13.1pp toward R · 2008: -22.8pp · 2024: -35.9pp
- All cycles
- 2024: R+35.9 2020: R+35.7 2016: R+36.8 2012: R+26.0 2008: R+22.8
Not yet ingested
- Civics
- —
Market trends
- HPI YoY
- ▼ -83.32%
- Current HPI
- 273.7508
- Rent YoY
- —
- Metro
- Charlotte-Concord-Gastonia, NC-SC
- State GDP YoY
- ▲ 3.28%
- F500 in state
- 26
Industry mix (Fortune 500 HQ in NC)
| Industry | F500 HQs | Revenue |
|---|---|---|
| Financial Services | 2 | $213B |
|
||
| Retail | 2 | $95B |
|
||
| Industrial Conglomerate | 1 | $38B |
|
||
| Metals / Steel | 1 | $35B |
|
||
| Utilities | 1 | $30B |
|
||
| Industrial Machinery | 1 | $19B |
|
||
Price history
1 event — show timeline
- 2026-05-13 Listed $95,000 CANOPYMLS as Distributed by MLS Grid
Property tax history
+3.3%/yrLatest (2025): $242 · +4.5% YoY. Source: county tax records.
Cash-flow waterfall
monthlySold comps — $/sqft
last 12 mo · ≤1 miLoading sold comps…