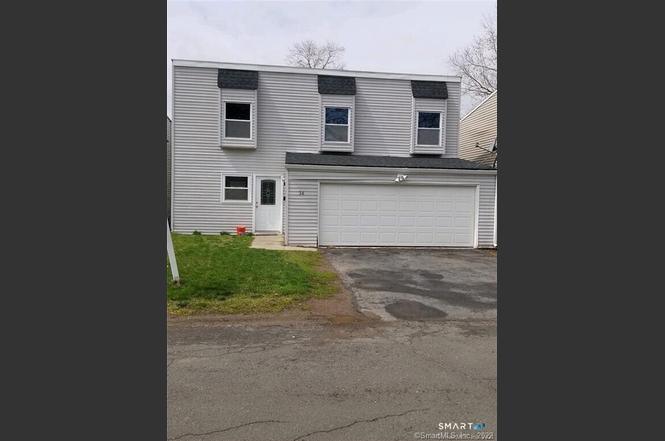
34 Inverness Ln · Middletown, CT
Flood risk 4/10 · Minor
- FEMA flood zone
- X (unshaded)
- Chance of flooding over 30 yrs
- 0.13%
- Est. flood insurance / yr
- $507 – $1,088
Fire risk 1/10 · Minimal
- Est. fire insurance / yr
- $829 – $1,539
Heat risk 5/10 · Moderate
- Hot days now (above 98°F)
- 7 days/yr
- Hot days in 30 yrs
- 15 days/yr
Wind risk 6/10 · Moderate
- Chance of severe wind over 30 yrs
- 27.0%
Air-quality risk 3/10 · Minor
- Unhealthy air days now
- 2 days/yr
- Unhealthy air days in 30 yrs
- 3 days/yr
Risk factors via First Street. Map © Google.
Why this score? — see what drove the C- grade
The composite is a weighted blend of 9 inputs, each scored 0–100. Each bar is that input's sub-score; the figure is the points it added to the 100-point composite (weight × sub-score).
- Cash flow +22.6/30.0
- DSCR +7.2/10.0
- 1% rule +5.7/10.0
- ARV discount +5.3/15.0
- Livability +4.0/5.0
- Schools +3.0/10.0
- Rent growth +2.6/5.0
- Condition / age +2.5/5.0
- Appreciation +0.0/10.0
$299,609
🖨 Deal sheet 📄 Offer letter ✓ Due diligence
Listing remarks
Welcome to this inviting contemporary home in Middletown offering the perfect blend of comfort, style, and convenience. This well maintained 4 bedroom, 2 bath residence features 1,328 square feet of thoughtfully designed living space ideal for today's lifestyle. Step inside to discover an updated kitchen with modern finishes, providing a functional and attractive space for everyday living and entertaining. Both bathrooms have been tastefully updated, adding a fresh, move in ready feel throughout the home. The flexible floor plan offers four bedrooms, giving plenty of room for family, guests, or a home office. One of the home's most convenient features is the second floor laundry, making dai
Key facts
- Flexible floor plan
- Updated kitchen
- Convenient location
Tags
Property features AI
Finance
- Financial info: Property managed by a professional off-site management company
- HOA & community: Homeowners association with $500 annual fee; HOA covers grounds maintenance, property management, and insurance; Community amenities include basketball court, park, and playground/tot lot
Exterior
- Parking: Attached garage; Driveway parking; Two garage spaces (total 2 parking spaces)
- Utilities: Public water connected; Public sewer connected; Electric service for heat and hot water
- Home design: Single-family home
- Construction: Frame construction; Vinyl siding; Concrete foundation; Asphalt shingle roof; Gray exterior color
- Exterior features: Level lot; Paved driveway
Interior
- Kitchen: Oven/Range; Microwave; Refrigerator; Dishwasher
- Bedrooms: Four bedrooms
- Bathrooms: Two full bathrooms
- Heating & cooling: Electric baseboard heat; 30-gallon electric hot water tank
- Interior features: Six total rooms; No basement
- Laundry & utility: Laundry on upper level
Neighborhood map
What this means for you Summary
Snapshot
- This is a 4-bed/2.0-bath single-family listed at $300k.
Deal economics
- At list price, monthly cash flow is $509 ($6k/yr) — positive.
- The deal already cash-flows at list — no discount required.
- Meets the 1% rule at list price ($3k rent vs $300k).
- Recommended offer: $295k (1.5% below list) — sets the bar for market timing.
- Cap rate 8.3% vs local median 3.7% in Middletown — top-decile yield for the area; either an underpriced asset or a hidden risk that comps aren't pricing in. Stress-test before assuming the spread holds.
Location & tenants
- Location reads 81/100 on livability (#17 in CT, #1,390 nationally) — a professional / high-income tenant draw. Strengths: crime A+, amenities A+, health & safety A+; Watch: commute F.
- Middletown School District (urban): math 24% / reading 44% proficiency, ranked #113 of 153 in CT (top 74%) — families likely to look elsewhere, expect single-tenant / working-renter base with shorter leases.
- Zoned schools: Middletown High School (math 25% / reading 52%, grade F, #111 of 194 statewide, top 57%, 1,214 students, 49% FRL).
- Market conditions: Rents flat; 143 active listings in the ZIP; 4 comparable units currently listed for rent nearby; rentals at typical pace (median 20d on market — plan ~3-4 weeks tenant-placement turnaround); solid renter incomes; 278 units permitted in Lower Connecticut River Valley Planning Region in 2024 (89 in 5+ unit buildings).
- At $3,209/mo this rent would consume 48% of the median local household income ($79k/yr) (locally 2196% of renters already pay >50% of income on rent) — very limited rent-growth headroom before tenants either downsize or default.
Forward outlook
- Local home prices are declining (-3.0%/yr); year-one equity from $2k of loan paydown is wiped out by about $9k of value loss. Plan a longer hold.
Negotiation context
- It's been on market 27 days — a 2% lower offer ($295k) is reasonable based on typical stale-listing flexibility.
- 11 sale attempts since 23y ago; this cycle's ask is 10997% above the opening price — seller raised mid-cycle; expect resistance to lowballs.
- Current owner paid $54k; list at $300k implies a 455% gain — meaningful room to come down on a strong offer.
Risks & watch-outs
- Climate carrying-cost: major wind risk, 27% chance of damaging wind over 30y; extreme-heat days projected 7→15/yr by 2055 (HVAC capex compounding) — expect insurance premiums to compound above CPI over the hold.
Questions for the listing agent
- Built in 1971 — when were the roof, HVAC, electrical panel, plumbing, and water heater last replaced?
- What does the HOA fee cover, when was the last increase, and are there any pending special assessments or reserve-fund shortfalls?
- Is there a deadline driving the sale (1031 exchange, divorce, estate, relocation)? That informs how much negotiation room exists.
- What's the average days-on-market for RENTAL listings here right now (not sales)? A rising rental-DOM trend means longer vacancies and softer asking-rent achievability than the comps imply.
- What's the recent tenant-quality profile in this submarket — average credit score on applications, eviction rate, late-payment / NSF rate, and stable-employment percentage? A property-management company in the area should have these aggregated.
- How much new for-sale + rental construction is in the pipeline within 1–3 miles? Heavy new supply typically softens prices + rents 12–24 months out; constrained supply supports both.
Investment metrics
- 1% rule
- 1.07% ✓
- Cap rate
- 8.33%
- Cash-on-cash
- 7.27%
- DSCR
- 1.32
- GRM
- 7.8
CMA / ARV
- ARV (on-the-fly)
- $285,520
- Comps found
- 12
Show comp detail 12 sales within ~0.75 mi
| Address | Dist | Beds/Ba | Sqft | Sold | Price | $/sf | Match |
|---|---|---|---|---|---|---|---|
| 7 Inverness Sq | 0.07mi | 3/1.0 (-1) | 1,328 (0%) | 5mo | $245,000 | $184 | 84 |
| 12 Inverness Ln | 0.06mi | 3/1.0 (-1) | 1,328 (0%) | 6mo | $195,609 | $147 | 83 |
| 67 Braeburn Ln | 0.13mi | 3/1.0 (-1) | 1,328 (0%) | 5mo | $245,000 | $184 | 81 |
| 4 Inverness Sq | 0.09mi | 4/1.0 | 1,328 (0%) | 19mo | $220,000 | $166 | 76 |
| 59 Fieldbrook Rd | 0.23mi | 3/1.0 (-1) | 1,352 (+2%) | 6mo | $390,000 | $288 | 73 |
| 6 Stirling Ct | 0.09mi | 3/1.0 (-1) | 1,370 (+3%) | 11mo | $240,000 | $175 | 72 |
| 833 East St | 0.24mi | 4/1.0 | 1,260 (-5%) | 6mo | $353,000 | $280 | 71 |
| 21 Afton Ter | 0.24mi | 3/1.0 (-1) | 1,328 (0%) | 13mo | $286,000 | $215 | 69 |
| 3 Braeburn Ln | 0.17mi | 3/1.0 (-1) | 1,209 (-9%) | 1mo | $190,000 | $157 | 67 |
| 72 Glendale Ave | 0.26mi | 3/1.0 (-1) | 1,462 (+10%) | 4mo | $321,700 | $220 | 59 |
| 69 Glenwood Ter | 0.36mi | 3/2.0 (-1) | 1,239 (-7%) | 21mo | $370,000 | $299 | 50 |
| 574 East St | 0.64mi | 3/2.5 (-1) | 1,525 (+15%) | 16mo | $405,000 | $266 | 25 |
Match score weights: distance 35% · size 25% · config 20% · recency 20%. Top-matched comps best support the ARV.
Projected returns pro-forma
-3.0% appreciation · 0.22% rent growth · sell at horizon
- IRR
- -8.3%
- Equity multiple
- 0.70×
- Total profit
- $-24,870
- Equity at exit
- $44,673
- IRR
- -2.8%
- Equity multiple
- 0.84×
- Total profit
- $-13,757
- Equity at exit
- $25,905
Cash invested: $83,891 (down + closing). Projections, not guarantees.
Landlord ↔ Tenant lean methodology
- Overall (STATE)
- 27 Tenant-Leaning
- State Connecticut
- 27 Tenant-Leaning · D+7
- County
- — inherits STATE
- City
- — inherits STATE
ZIP-level market 06457
- Rents YoY
- 0.2%
- Active inventory
- 143
- Price-to-rent
- 7.8×
Monthly cashflow live
- Estimated rent
- $3,209 medium interval (Pro) →
- Mortgage (P&I)
- −$1,571
- Tax from tax record
- −$288 /mo · $3,459/yr
- Insurance
- −$125
- HOA
- −$42
- Vacancy / Maint / Mgmt
- −$674
- Net cashflow
- $509
Break-even live
UW: 25.0% down · 7.5% · 30yr · 1.5% tax · 5.0% vac · 8.0% maint · 8.0% mgmt
Financing live
Cash to close
- Down payment
- $74,902
- Closing costs
- $8,988
- Reserves months
- —
- Total cash needed
- —
Loan-product check · same deal, 3 products live
Conventional
25% down · 7.5% · 30yr
- Down + closing
- —
- Monthly P&I
- —
- Monthly cashflow
- —
- DSCR
- —
- Eligible?
- —
Personal DTI + credit; lowest rate.
DSCR
20% down · 8.5% · 30yr
- Down + closing
- —
- Monthly P&I
- —
- Monthly cashflow
- —
- DSCR
- —
- Eligible?
- —
No personal income docs; deal must DSCR.
Hard money
10% down · 12.0% · 12mo
- Down + closing
- —
- Monthly P&I
- —
- Monthly cashflow
- —
- DSCR
- —
- Eligible?
- —
Short-term bridge; refi at stabilization.
Rent comps 4 comps
| Address | Beds | Baths | Sqft | Rent | $/sqft | DOM | Units | Dist |
|---|---|---|---|---|---|---|---|---|
| 53 Braeburn Ln Middletown, CT | 4.0 | 2.0 | 1580 | $3,650 | $2.31 | 19d | 1 | 0.13mi |
| 100 Town Rdg Middletown, CT | 1.0–3.0 | 1.0–2.0 | 1017 | $2,878 | $2.83 | 1d | 16 | 0.21mi |
| 5 Town Colony Dr Middletown, CT | 1.0–3.0 | 1.0–2.0 | 1135 | $2,964 | $2.61 | 1d | 15 | 0.37mi |
| 5 Midway Dr #5 Cromwell, CT | 3.0 | 1.5 | 1744 | $2,500 | $1.43 | 43d | 1 | 1.45mi |
HOA detail
- Monthly dues
- $42 · $504/yr
Listing history 38 events
-
2026-06-18days on market $299,609 Active 27 DOM
-
2026-06-17days on market $299,609 Active 26 DOM
-
2026-06-16days on market $299,609 Active 25 DOM
-
2026-06-15days on market $299,609 Active 24 DOM
-
2026-06-13days on market $299,609 Active 22 DOM
-
2026-06-13days on market $299,609 Active 21 DOM
-
2026-06-10days on market $299,609 Active 19 DOM
-
2026-06-09days on market $299,609 Active 18 DOM
-
2026-06-08days on market $299,609 Active 17 DOM
-
2026-06-07days on market $299,609 Active 16 DOM
-
2026-06-03days on market $299,609 Active 12 DOM
-
2026-06-02days on market $299,609 Active 11 DOM
-
2026-06-01days on market $299,609 Active 10 DOM
-
2026-05-31days on market $299,609 Active 9 DOM
-
2026-05-28status Active
-
2026-03-17historical $2,700
-
2026-03-17historical
-
2026-03-13$2,700
-
2026-03-11$299,609 Active
-
2021-12-06historical
-
2021-10-14price $199,609
-
2021-09-05$224,609 Active
-
2020-04-28historical
-
2020-04-10$164,609 Active
-
2016-04-29historical
-
2016-02-04$150,000
-
2015-07-02historical
-
2015-05-04$154,900
-
2012-08-06historical
-
2012-02-06$159,900
-
2011-11-08soldstatus $54,000
-
2011-11-01soldstatus $54,000
-
2011-06-08$69,900
-
2010-04-27historical
-
2009-07-28$124,900
-
2003-09-05soldstatus $105,000
-
2003-09-04soldstatus $105,000
-
2003-05-06$112,000
ⓘ Source: listings_history table (triggers on properties + properties_extension) + one-shot
backfill from property_details.listing_events for pre-trigger history.
Tax reassessment forecast CT · Partial reset (capped growth)
- Current annual tax
- $3,459 · $288/mo
- Projected year-2 tax
- $4,935 · $411/mo
- Expected delta
- +$1,476/yr (+$123/mo · 42.7%)
ⓘ Screening estimate from a state-policy table — verify with the county assessor before closing.
Climate risk First Street
- Flood 4/10 Moderate FEMA zone X (unshaded) · 13% chance over 30 yrs
- Wildfire 1/10 Low
- Heat 5/10 Major 7 d/yr ≥98°F today · 15 d/yr by 30 yrs out
- Wind 6/10 Major 27% chance of damaging wind over 30 yrs
- Air quality 3/10 Moderate 2 unhealthy d/yr today · 3 by 30 yrs out
Nearby sold comps map
Loading sold comps map…
Walkable amenities ~0.75 mi
Loading nearby amenities…
Taxation est. · year 1
- Rental income
- $38,504
- − Mortgage interest
- −$16,783
- − Property taxes
- −$3,459
- − Insurance
- −$1,498
- − Repairs & maintenance
- −$3,080
- − Management
- −$3,080
- − HOA
- −$504
- − Depreciation
- −$8,716
- Taxable income
- $1,383
- Est. tax owed @ 24.0%
- −$332
- After-tax cash flow
- $5,771/yr
For passive investors: Depreciation is non-cash, so a rental often shows a tax loss while cash-flowing — sheltering income. Rental losses are passive: they offset passive income freely, and up to $25,000/yr can offset ordinary (W-2) income if you actively participate and your MAGI is under $100k (phasing out to $0 by $150k); unused losses carry forward. On sale, claimed depreciation is recaptured at up to 25%, and gains may owe capital-gains tax (a 1031 exchange can defer both). Figures are a year-1 estimate at your 24.0% rate — not tax advice; consult a CPA.
Schools (NCES district)
- District
- Middletown School District
- NCES district ID
- 0902490
- Math proficiency
- 24% ▼ -15.00%
- Reading proficiency
- 44% ▼ -8.00%
- Median HH income
- $60,733
- Composite
- 30.47/100
- National rank
- #6224
- State rank
- #113 of 153 in CT
Livability — Middletown
- Score
- 81/100
- State rank
- #17
- US rank
- #1390
Category grades
Schools grade is shown separately in the Schools card above.
Census & demographics
- Census place
- Middletown, CT
- County
- Middlesex County · 63,941 people
- City population
- 46,720
- Metro
- Hartford-East Hartford-Middletown, CT
- Population (ZIP)
- 46,720
- Household income
- $79,463
- Rent vs Own
- Severe rent burden
- 2196.0
Population outlook (Lower Connecticut River Valley County) Hauer SSP2
- By 2040
- 188,651
Race, ethnicity, and origin ACS 2023
- Neighborhood character
- Majority White (65%)
- Race & ethnicity
- White 65% Black 13% Hispanic / Latino 12% Two or more races 9% Asian 5%
- Hispanic origin (detail)
- Mexican 1% Puerto Rican 7%
- Common ancestry
- Romanian 9% Lithuanian 5% Slovak 2%
- Foreign-born
- 12% · Canada, China
- Languages at home
- 82% English-only · Spanish 6% Other Indo-European 4% Russian/Polish/Slavic 2%
Political lean MEDSL · Lower Connecticut River Valley
- 2024 margin
- D (+13.4) · D 55.9% · R 42.4% · Other 1.7%
- All cycles
- 2024: D+13.4
Not yet ingested
- Civics
- —
Market trends
- HPI YoY
- ▼ -470.20%
- Current HPI
- 255.1597
- Rent YoY
- ▲ 0.22%
- Metro
- Hartford-East Hartford-Middletown, CT
- State GDP YoY
- ▲ 1.06%
- F500 in state
- 38
Industry mix (Fortune 500 HQ in CT)
| Industry | F500 HQs | Revenue |
|---|---|---|
| Industrial Machinery | 4 | $38B |
|
||
| Insurance | 3 | $71B |
|
||
| Financial Services | 2 | $25B |
|
||
| Transportation / Logistics | 2 | $18B |
|
||
| Healthcare | 1 | $247B |
|
||
| Telecommunications | 1 | $55B |
|
||
Price history
-97.6% since first listed24 events — show timeline
- 2026-05-28 Relisted — Smart MLS
- 2026-03-17 Rental Removed $2,700 SMARTMLS
- 2026-03-17 Listing Removed — Smart MLS
- 2026-03-13 Listed for Rent $2,700 SMARTMLS
- 2026-03-11 Listed $299,609 Smart MLS
- 2021-12-06 Listing Removed — Smart MLS
- 2021-10-14 Price Changed $199,609 Smart MLS
- 2021-09-05 Listed $224,609 Smart MLS
- 2020-04-28 Listing Removed — Smart MLS
- 2020-04-10 Listed $164,609 Smart MLS
- 2016-04-29 Listing Removed — Smart MLS
- 2016-02-04 Listed $150,000 Smart MLS
- 2015-07-02 Listing Removed — Smart MLS
- 2015-05-04 Listed $154,900 Smart MLS
- 2012-08-06 Listing Removed — Smart MLS
- 2012-02-06 Listed $159,900 Smart MLS
- 2011-11-08 Sold (Public Records) $54,000 Public Records
- 2011-11-01 Sold (MLS) $54,000 Smart MLS
- 2011-06-08 Listed $69,900 Smart MLS
- 2010-04-27 Listing Removed — Smart MLS
- 2009-07-28 Listed $124,900 Smart MLS
- 2003-09-05 Sold (Public Records) $105,000 Public Records
- 2003-09-04 Sold (MLS) $105,000 Smart MLS
- 2003-05-06 Listed $112,000 Smart MLS
Property tax history
+1.9%/yrLatest (2022): $3,459 · +0.2% YoY. Source: county tax records.
Cash-flow waterfall
monthlySold comps — $/sqft
last 12 mo · ≤1 miLoading sold comps…