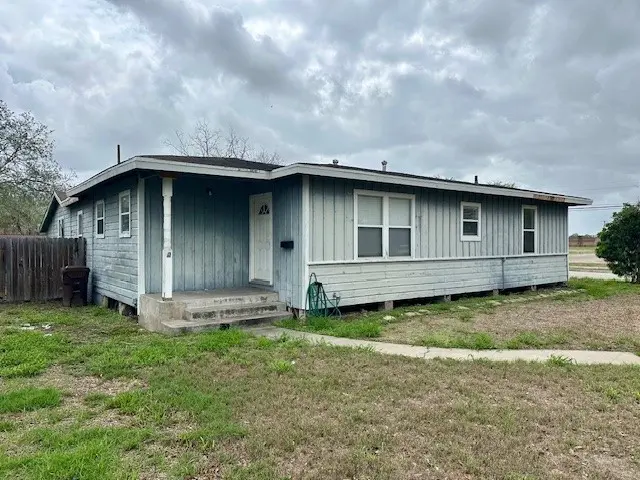
630 Williams St · Kingsville, TX
Flood risk 3/10 · Minor
- FEMA flood zone
- X (unshaded)
- Chance of flooding over 30 yrs
- 0.2%
- Est. flood insurance / yr
- $507 – $1,088
Fire risk 5/10 · Moderate
- Est. fire insurance / yr
- $1,222 – $2,270
Heat risk 9/10 · Severe
- Hot days now (above 111°F)
- 7 days/yr
- Hot days in 30 yrs
- 22 days/yr
Wind risk 8/10 · Major
- Chance of severe wind over 30 yrs
- 99.0%
Air-quality risk 1/10 · Minimal
- Unhealthy air days now
- 0 days/yr
- Unhealthy air days in 30 yrs
- 0 days/yr
Risk factors via First Street. Map © Google.
Why this score? — see what drove the B+ grade
The composite is a weighted blend of 9 inputs, each scored 0–100. Each bar is that input's sub-score; the figure is the points it added to the 100-point composite (weight × sub-score).
- Cash flow +30.0/30.0
- ARV discount +15.0/15.0
- 1% rule +10.0/10.0
- DSCR +10.0/10.0
- Rent growth +4.3/5.0
- Livability +3.5/5.0
- Condition / age +2.5/5.0
- Schools +1.5/10.0
- Appreciation +0.0/10.0
$79,900
🖨 Deal sheet (PDF) 📄 Offer letter ✓ Due diligence
Listing remarks MLS
Located on a corner lot, this 3-bedroom, 2-bath home offers a prime opportunity for investors ready to bring their vision to life. This property is ideal for those looking to rehab and flip or create a solid long-term rental investment. Inside, you’ll find a sun-filled open living and dining area with generous space that flows into the kitchen—providing a great foundation for a functional layout. The split bedroom arrangement offers added privacy, a feature today’s buyers and tenants appreciate. An added bonus is the indoor laundry area, enhancing everyday convenience. This home is ready for its next chapter—bring the paint, the plans, and a little elbow grease to unlock its full potential. With its location, layout, and investment potential, this property is a smart addition to any portfolio.
Key facts
- Indoor laundry area
- Corner lot
- 8,451 sq ft lot
Tags
Neighborhood map
What this means for you Summary
Snapshot
- This is a 3-bed/2.0-bath single-family listed at $80k.
Deal economics
- At list price, monthly cash flow is $711 ($9k/yr) — positive.
- The deal already cash-flows at list — no discount required.
- Meets the 1% rule at list price ($2k rent vs $80k).
- Recommended offer: $75k (6.0% below list) — sets the bar for market timing.
- Cap rate 17.0% vs local median 5.4% in Kingsville — top-decile yield for the area; either an underpriced asset or a hidden risk that comps aren't pricing in. Stress-test before assuming the spread holds.
Location & tenants
- Location reads 70/100 on livability (#364 in TX) — a middle-class / working-renter tenant base. Strengths: cost of living A+, housing A+, health & safety A+; Watch: schools D+, employment D, amenities F.
- Kingsville ISD (town): math 13% / reading 22% proficiency, ranked #800 of 826 in TX (top 97%) — low school quality limits family demand, transient renter base, plan for 1-2y turnover; 71% free/reduced lunch — lower-income household profile, screen leases tightly.
- Market conditions: Rents rising fast (+7.2%/yr); 227 active listings in the ZIP; 6 comparable units currently listed for rent nearby; rentals lingering (median 45d on market — plan ~5-8 weeks vacancy on turnover, expect pricing pressure); 83% of comp listings sitting > 30 days — soft ceiling on asking rent; 24 units permitted in Kleberg County in 2024 (0 in 5+ unit buildings).
- This rent runs 32% of the median local income ($61k/yr) — at the standard rent-burdened threshold; future hikes will face affordability resistance.
Forward outlook
- Local home prices are declining (-3.0%/yr); year-one equity from $552 of loan paydown is wiped out by about $2k of value loss. Plan a longer hold.
- Kleberg County population projected at +9% by 2050 — modest demand growth; plan on rents tracking national, not racing it.
- At projected returns (-3.0% appreciation + 7.2% rent growth), your $22k cash investment doubles in ~3 years — after that, you're playing with house money.
Negotiation context
- It's been on market 64 days — a 6% lower offer ($75k) is reasonable based on typical stale-listing flexibility.
- 2 sale attempts; this cycle's ask has dropped $9k (10%) from the opening price — seller is motivated, your offer sets the floor, not the list.
Risks & watch-outs
- Climate carrying-cost: severe wind risk, 99% chance of damaging wind over 30y; moderate wildfire risk; extreme-heat days projected 7→22/yr by 2055 (HVAC capex compounding) — expect insurance premiums to compound above CPI over the hold.
Questions for the listing agent
- It's been on market 64 days. Have you received any prior offers? Is the seller open to a 6% concession, seller financing, or rate buy-down credit?
- Built in 1967 — when were the roof, HVAC, electrical panel, plumbing, and water heater last replaced?
- Why hasn't it sold? Are there any deal-killer items the seller is aware of (foundation, flood, title, zoning, code violations)?
- Is there a deadline driving the sale (1031 exchange, divorce, estate, relocation)? That informs how much negotiation room exists.
- Schools are D-rated, which usually means shorter tenancies and higher turnover. Who's the typical renter profile here, and what's been the actual vacancy rate?
- What's the average days-on-market for RENTAL listings here right now (not sales)? A rising rental-DOM trend means longer vacancies and softer asking-rent achievability than the comps imply.
- What's the recent tenant-quality profile in this submarket — average credit score on applications, eviction rate, late-payment / NSF rate, and stable-employment percentage? A property-management company in the area should have these aggregated.
- How much new for-sale + rental construction is in the pipeline within 1–3 miles? Heavy new supply typically softens prices + rents 12–24 months out; constrained supply supports both.
Investment metrics
- 1% rule
- 2.00% ✓
- Cap rate
- 16.97%
- Cash-on-cash
- 38.14%
- DSCR
- 2.70
- GRM
- 4.2
CMA / ARV
- ARV (median comp)
- $142,636
- List price
- $79,900
- Delta
- -43.98%
- Verdict
- UNDERPRICED
- Comps
- 20 within 1.0 mi
Show comp detail 5 sales within ~0.75 mi
| Address | Dist | Beds/Ba | Sqft | Sold | Price | $/sf | Match |
|---|---|---|---|---|---|---|---|
| 521 W Fordyce Ave | 0.36mi | 4/3.0 (+1) | 1,513 (-1%) | 9mo | $168,000 | $111 | 65 |
| 609 S Lantana Dr | 0.10mi | 3/2.0 | 1,380 (-10%) | 22mo | $38,000 | $28 | 60 |
| 415 W King Ave | 0.54mi | 4/2.0 (+1) | 1,496 (-2%) | 10mo | $179,000 | $120 | 57 |
| 409 W King Ave | 0.55mi | 3/1.5 | 1,565 (+2%) | 14mo | $149,900 | $96 | 57 |
| 425 W King Ave W | 0.53mi | 3/1.0 | 1,456 (-5%) | 16mo | $59,000 | $41 | 50 |
Match score weights: distance 35% · size 25% · config 20% · recency 20%. Top-matched comps best support the ARV.
Projected returns pro-forma
-3.0% appreciation · 7.18% rent growth · sell at horizon
- IRR
- 38.9%
- Equity multiple
- 2.76×
- Total profit
- $39,378
- Equity at exit
- $11,913
- IRR
- 47.4%
- Equity multiple
- 6.55×
- Total profit
- $124,061
- Equity at exit
- $6,908
Cash invested: $22,372 (down + closing). Projections, not guarantees.
Landlord ↔ Tenant lean methodology
- Overall (STATE)
- 87 Strongly Landlord-Friendly
- State Texas
- 87 Strongly Landlord-Friendly · R+5
- County
- — inherits STATE
- City
- — inherits STATE
ZIP-level market 78363
- Rents YoY
- 7.2%
- Active inventory
- 227
- Price-to-rent
- 4.2×
Monthly cashflow live
- Estimated rent
- $1,599 high interval (Pro) →
- Mortgage (P&I)
- −$419
- Tax est. 1.5%
- −$100 /mo · $1,198/yr
- Insurance
- −$33
- HOA
- −$0
- Vacancy / Maint / Mgmt
- −$336
- Net cashflow
- $711
Break-even live
Sensitivity live
| Price | -10% $766 | -5% $739 | +0% $711 | +5% $684 | +10% $656 |
|---|---|---|---|---|---|
| Rent | -10% $585 | -5% $648 | +0% $711 | +5% $774 | +10% $837 |
| Rate | -1.0pp $751 | -0.5pp $731 | base $711 | +0.5pp $690 | +1.0pp $669 |
UW: 25.0% down · 7.5% · 30yr · 1.5% tax · 5.0% vac · 8.0% maint · 8.0% mgmt
Financing live
Cash to close
- Down payment
- $19,975
- Closing costs
- $2,397
- Reserves months
- —
- Total cash needed
- —
Loan-product check · same deal, 3 products live
Conventional
25% down · 7.5% · 30yr
- Down + closing
- —
- Monthly P&I
- —
- Monthly cashflow
- —
- DSCR
- —
- Eligible?
- —
Personal DTI + credit; lowest rate.
DSCR
20% down · 8.5% · 30yr
- Down + closing
- —
- Monthly P&I
- —
- Monthly cashflow
- —
- DSCR
- —
- Eligible?
- —
No personal income docs; deal must DSCR.
Hard money
10% down · 12.0% · 12mo
- Down + closing
- —
- Monthly P&I
- —
- Monthly cashflow
- —
- DSCR
- —
- Eligible?
- —
Short-term bridge; refi at stabilization.
Rent comps 6 comps
| Address | Beds | Baths | Sqft | Rent | $/sqft | DOM | Units | Dist |
|---|---|---|---|---|---|---|---|---|
| 1204 W Lee Ave Kingsville, TX | 4.0 | 2.5 | 1970 | $1,825 | $0.93 | 44d | 1 | 0.68mi |
| 614 W Alice Ave Kingsville, TX | 3.0 | 2.0 | 1713 | $1,599 | $0.93 | 44d | 1 | 0.73mi |
| 307 W Alice Ave Kingsville, TX | 3.0 | 2.0 | 1600 | $1,500 | $0.94 | 44d | 1 | 0.85mi |
| 629 W Nettie Ave Kingsville, TX | 3.0 | 2.0 | 1762 | $1,495 | $0.85 | 44d | 1 | 0.95mi |
| 503 W Mesquite Ave Kingsville, TX | 3.0 | 2.0 | 1400 | $1,500 | $1.07 | 14d | 1 | 1.31mi |
| 908 E Doddridge Ave Kingsville, TX | 3.0 | 1.0 | 1100 | $850 | $0.77 | 44d | 1 | 1.41mi |
Listing history 23 events
-
2026-06-21days on market $79,900 Active 64 DOM
-
2026-06-19days on market $79,900 Active 62 DOM
-
2026-06-18days on market $79,900 Active 61 DOM
-
2026-06-17days on market $79,900 Active 60 DOM
-
2026-06-16days on market $79,900 Active 59 DOM
-
2026-06-15days on market $79,900 Active 58 DOM
-
2026-06-14days on market $79,900 Active 56 DOM
-
2026-06-12days on market $79,900 Active 55 DOM
-
2026-06-09days on market $79,900 Active 52 DOM
-
2026-06-08days on market $79,900 Active 51 DOM
-
2026-06-07days on market $79,900 Active 50 DOM
-
2026-06-05days on market $79,900 Active 47 DOM
-
2026-06-03days on market $79,900 Active 46 DOM
-
2026-06-03price $79,900 Active 45 DOM
-
2026-06-02days on market $89,000 Active 45 DOM
-
2026-06-01days on market $89,000 Active 44 DOM
-
2026-05-31days on market $89,000 Active 43 DOM
-
2026-05-30days on market $89,000 Active 42 DOM
-
2026-04-22$89,000 Active 828-char remark
Show marketing remark (828 chars)
Located on a corner lot, this 3-bedroom, 2-bath home offers a prime opportunity for investors ready to bring their vision to life. This property is ideal for those looking to rehab and flip or create a solid long-term rental investment. Inside, you’ll find a sun-filled open living and dining area with generous space that flows into the kitchen—providing a great foundation for a functional layout. The split bedroom arrangement offers added privacy, a feature today’s buyers and tenants appreciate. An added bonus is the indoor laundry area, enhancing everyday convenience. This home is ready for its next chapter—bring the paint, the plans, and a little elbow grease to unlock its full potential. With its location, layout, and investment potential, this property is a smart addition to any portfolio.
-
2026-04-18historical 828-char remark
Show marketing remark (828 chars)
Located on a corner lot, this 3-bedroom, 2-bath home offers a prime opportunity for investors ready to bring their vision to life. This property is ideal for those looking to rehab and flip or create a solid long-term rental investment. Inside, you’ll find a sun-filled open living and dining area with generous space that flows into the kitchen—providing a great foundation for a functional layout. The split bedroom arrangement offers added privacy, a feature today’s buyers and tenants appreciate. An added bonus is the indoor laundry area, enhancing everyday convenience. This home is ready for its next chapter—bring the paint, the plans, and a little elbow grease to unlock its full potential. With its location, layout, and investment potential, this property is a smart addition to any portfolio.
-
2026-04-14$89,000 Active 828-char remark
Show marketing remark (828 chars)
Located on a corner lot, this 3-bedroom, 2-bath home offers a prime opportunity for investors ready to bring their vision to life. This property is ideal for those looking to rehab and flip or create a solid long-term rental investment. Inside, you’ll find a sun-filled open living and dining area with generous space that flows into the kitchen—providing a great foundation for a functional layout. The split bedroom arrangement offers added privacy, a feature today’s buyers and tenants appreciate. An added bonus is the indoor laundry area, enhancing everyday convenience. This home is ready for its next chapter—bring the paint, the plans, and a little elbow grease to unlock its full potential. With its location, layout, and investment potential, this property is a smart addition to any portfolio.
-
2012-11-20soldstatus
-
1995-05-18soldstatus
ⓘ Source: listings_history table (triggers on properties + properties_extension) + one-shot
backfill from property_details.listing_events for pre-trigger history.
Climate risk First Street
- Flood 3/10 Moderate FEMA zone X (unshaded) · 20% chance over 30 yrs
- Wildfire 5/10 Major
- Heat 9/10 Extreme 7 d/yr ≥111°F today · 22 d/yr by 30 yrs out
- Wind 8/10 Severe 99% chance of damaging wind over 30 yrs
- Air quality 1/10 Low 0 unhealthy d/yr today · 0 by 30 yrs out
Nearby sold comps map
Loading sold comps map…
Walkable amenities ~0.75 mi
Loading nearby amenities…
Taxation est. · year 1
- Rental income
- $19,190
- − Mortgage interest
- −$4,476
- − Property taxes
- −$1,198
- − Insurance
- −$400
- − Repairs & maintenance
- −$1,535
- − Management
- −$1,535
- − Depreciation
- −$2,324
- Taxable income
- $7,721
- Est. tax owed @ 24.0%
- −$1,853
- After-tax cash flow
- $6,681/yr
For passive investors: Depreciation is non-cash, so a rental often shows a tax loss while cash-flowing — sheltering income. Rental losses are passive: they offset passive income freely, and up to $25,000/yr can offset ordinary (W-2) income if you actively participate and your MAGI is under $100k (phasing out to $0 by $150k); unused losses carry forward. On sale, claimed depreciation is recaptured at up to 25%, and gains may owe capital-gains tax (a 1031 exchange can defer both). Figures are a year-1 estimate at your 24.0% rate — not tax advice; consult a CPA.
Schools (NCES district)
- District
- Kingsville ISD
- NCES district ID
- 4825680
- Math proficiency
- 13% ▼ -22.00%
- Reading proficiency
- 22% ▼ -7.00%
- Median HH income
- $36,308
- Composite
- 14.5/100
- National rank
- #9425
- State rank
- #800 of 826 in TX
Livability — Kingsville
- Score
- 70/100
- State rank
- #364
- US rank
- #7787
Category grades
Schools grade is shown separately in the Schools card above.
Census & demographics
- Census place
- Kingsville, TX
- County
- Kleberg County · 28,920 people
- City population
- 28,920
- Metro
- Kingsville, TX
- Population (ZIP)
- 28,920
- Household income
- $60,574
- Rent vs Own
- Severe rent burden
- 1663.0
Population outlook (Kleberg County) Hauer SSP2
- Today (2025)
- 31,615 people
- By 2030
- 32,054 · +1.4%
- By 2040
- 33,008 · +4.4%
- By 2050
- 34,536 · +9.2%
- By 2075
- 40,931 · +29.5%
- By 2100
- 46,001 · +45.5%
Race, ethnicity, and origin ACS 2023
- Neighborhood character
- Predominantly Hispanic (72%)
- Race & ethnicity
- Hispanic / Latino 72% Two or more races 36% White 20% Black 3% Asian 1% Native American 1%
- Hispanic origin (detail)
- Mexican 67%
- Common ancestry
- Italian 2% Slovak 1% Portuguese 1%
- Foreign-born
- 7% · Canada, China
- Languages at home
- 65% English-only · Spanish 32% Other Indo-European 1%
Political lean MEDSL · Kleberg
- 2024 margin
- R (+12.7) · D 43.3% · R 56.1%
- 2008→2024 swing
- -20.0pp toward R · 2008: 7.2pp · 2024: -12.7pp
- All cycles
- 2024: R+12.7 2020: R+1.7 2016: D+3.7 2012: D+7.8 2008: D+7.2
Not yet ingested
- Civics
- —
Market trends
- HPI YoY
- ▼ -87.12%
- Current HPI
- 147.6473
- Rent YoY
- ▲ 7.18%
- Metro
- Kingsville, TX
- State GDP YoY
- ▲ 3.95%
- F500 in state
- 110
Industry mix (Fortune 500 HQ in TX)
| Industry | F500 HQs | Revenue |
|---|---|---|
| Energy | 16 | $1,198B |
|
||
| Technology | 5 | $198B |
|
||
| Engineering / Construction | 4 | $72B |
|
||
| Energy Services | 3 | $60B |
|
||
| Utilities | 3 | $41B |
|
||
| Healthcare | 2 | $330B |
|
||
Price history
+0.0% since first listed5 events — show timeline
- 2026-04-22 Listed $89,000 CBMLS
- 2026-04-18 Delisted — CBMLS
- 2026-04-14 Listed $89,000 CBMLS
- 2012-11-20 Sold (Public Records) — Public Records
- 1995-05-18 Sold (Public Records) — Public Records
Property tax history
+5.1%/yrLatest (2025): $4,314 · +15.6% YoY. Source: county tax records.
Cash-flow waterfall
monthlySold comps — $/sqft
last 12 mo · ≤1 miLoading sold comps…