 Multi-family
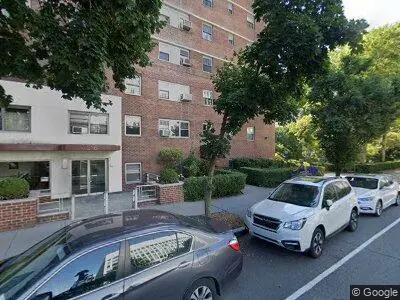
215 Adams St · New York, NY
Flood risk 1/10 · Minimal
- FEMA flood zone
- X (unshaded)
- Chance of flooding over 30 yrs
- 0.0%
- Est. flood insurance / yr
- $507 – $1,088
Fire risk 1/10 · Minimal
- Est. fire insurance / yr
- $691 – $1,283
Heat risk 6/10 · Moderate
- Hot days now (above 99°F)
- 7 days/yr
- Hot days in 30 yrs
- 15 days/yr
Wind risk 6/10 · Moderate
- Chance of severe wind over 30 yrs
- 27.0%
Air-quality risk 4/10 · Minor
- Unhealthy air days now
- 5 days/yr
- Unhealthy air days in 30 yrs
- 7 days/yr
Risk factors via First Street. Map © Google.
Why this score? — see what drove the D grade
The composite is a weighted blend of 9 inputs, each scored 0–100. Each bar is that input's sub-score; the figure is the points it added to the 100-point composite (weight × sub-score).
- Appreciation +8.0/10.0
- Cash flow +7.9/30.0
- ARV discount +7.5/15.0
- Schools +5.0/10.0
- Rent growth +3.8/5.0
- Livability +3.8/5.0
- 1% rule +2.4/10.0
- Condition / age +2.2/5.0
- DSCR +1.9/10.0
$995,000
🖨 Deal sheet (PDF) 📄 Offer letter ✓ Due diligence
Multi-family units
County records classify this as Multi-Family (5+ Unit). Listing-text estimate: 1 unit. estimate disagrees with records
5+ unit building — per-unit beds/baths from public records are typically unavailable; the breakdown below (if shown) is an estimate from the listing text.
Listing remarks
Prime Brooklyn Heights location! This incredible 850 sqft. two bedroom coop is an amazing find! The unit boasts hardwood and tile floors, breathtaking views of the NYC skyline, 2 spacious bedrooms with plenty of closet and storage space, a laundry area, exercise room, storage room, full time doorman, elevator, secure lobby, rooftop deck, a wait-list for parking, and is pet friendly. Amenities include quick and easy access to the multitude of establishments along Jay St. & amp; Atlantic Ave. , P. S. 8, P. S. 32, P. S. 261, New York City College of Technology, Whitman Park, Cadman Plaza Park, Trinity Park, McLaughlin Park, and much more! Transportation options include immediate access to
Key facts
- Storage room
- Laundry area
- Exercise room
Tags
Property features AI
Exterior
- Home design: Built in 1950
- Construction: Living area approximately 834 square feet
- Exterior features: Street address: 215 Adams St, Brooklyn, NY 11201
Interior
- Interior features: Located in Downtown Brooklyn
Neighborhood map
What this means for you Summary
Snapshot
- This is a 2-bed/1.0-bath multifamily listed at $995k. Condition is rated fair.
Deal economics
- At list price, monthly cash flow is $-1k ($-13k/yr) — negative.
- To cash-flow at today's rent, offer at most $840k (15.6% below list).
- To meet the 1% rule (rent ≥ 1% of price), the offer needs to be $735k (26.1% below list).
- Recommended offer: $735k (26.1% below list) — sets the bar for 1% rule.
- Cap rate 5.0% vs local median 2.6% in New York — top-decile yield for the area; either an underpriced asset or a hidden risk that comps aren't pricing in. Stress-test before assuming the spread holds.
Location & tenants
- Location reads 75/100 on livability (#268 in NY, #4,188 nationally) — a middle-class / working-renter tenant base. Strengths: amenities A+, commute A+, health & safety A; Watch: crime F, cost of living F.
- Zoned schools: Elm Tree Elementary School (math 27% / reading 52%, grade F, #1,444 of 2,108 statewide, top 71%, 806 students, 94% FRL); Jhs 383 Philippa Schuyler (math 32% / reading 67%, grade C, #280 of 729 statewide, top 40%, 822 students, 85% FRL); Midwood High School (math 94% / reading 96%, grade A+, #83 of 1,100 statewide, top 8%, 4,062 students, 73% FRL).
- Market conditions: Rents rising fast (+5.4%/yr); 405 active listings in the ZIP; 37 comparable units currently listed for rent nearby; rentals leasing fast (median 5d on market — plan ~1-2 weeks tenant-placement turnaround); high-income renter base; 10,063 units permitted in Kings County in 2024 (9,789 in 5+ unit buildings).
- At $7,349/mo this rent would consume 51% of the median local household income ($173k/yr) (locally 4080% of renters already pay >50% of income on rent) — very limited rent-growth headroom before tenants either downsize or default.
Forward outlook
- In year one you build about $66k of equity ($7k loan paydown + $59k appreciation (6.0% local appreciation)).
- Kings County population projected at +13% by 2050 — modest demand growth; plan on rents tracking national, not racing it.
- By year 2, paydown + projected appreciation supports a ~$106k cash-out refi (75% LTV) — recoverable capital for the next deal without selling this one.
Negotiation context
- It's been on market 35 days — a 3% lower offer ($965k) is reasonable based on typical stale-listing flexibility.
- 2 sale attempts with the ask held roughly flat each time — persistent listings suggest the price (not the market) is what's stuck; bring a comps-based counter.
Risks & watch-outs
- Watch-outs: built in 1950 — expect roof / HVAC / electrical / plumbing capex.
- Climate carrying-cost: major wind risk, 27% chance of damaging wind over 30y; extreme-heat days projected 7→15/yr by 2055 (HVAC capex compounding) — expect insurance premiums to compound above CPI over the hold.
Questions for the listing agent
- What do current leases actually rent for vs. the listed asking? Can we see a recent rent roll and the last 12 months of T-12 income?
- It's been on market 35 days. Have you received any prior offers? Is the seller open to a 26% concession, seller financing, or rate buy-down credit?
- Have any recent inspections been done? Can we get a copy of the seller's disclosures and any deferred-maintenance estimates?
- Built in 1950 — when were the roof, HVAC, electrical panel, plumbing, and water heater last replaced?
- Is there a deadline driving the sale (1031 exchange, divorce, estate, relocation)? That informs how much negotiation room exists.
- Schools are B-rated — typically a magnet for longer-tenancy family renters. What's the average tenant stay here, and is there a school-zone premium baked into asking?
- Crime grade is F in this area — have there been break-ins, vandalism, or insurance claims at this property in the last 3 years? What carrier currently insures it and at what premium?
- The area grade is low — what's the realistic commute time and amenity access for the typical tenant pool here? Any planned neighborhood developments (good or bad) we should know about?
- What's the average days-on-market for RENTAL listings here right now (not sales)? A rising rental-DOM trend means longer vacancies and softer asking-rent achievability than the comps imply.
- What's the recent tenant-quality profile in this submarket — average credit score on applications, eviction rate, late-payment / NSF rate, and stable-employment percentage? A property-management company in the area should have these aggregated.
- How much new apartment / multifamily construction is in the pipeline within 1–3 miles? Heavy new supply (>2% of stock underway) typically softens rents 12–24 months out; light construction supports rent growth.
Investment metrics
- 1% rule
- 0.74% ✗
- Cap rate
- 5.00%
- Cash-on-cash
- -4.61%
- DSCR
- 0.79
- GRM
- 11.3
CMA / ARV
No comps found within radius.
Projected returns pro-forma
5.97% appreciation · 5.39% rent growth · sell at horizon
- IRR
- 12.4%
- Equity multiple
- 1.84×
- Total profit
- $235,270
- Equity at exit
- $623,337
- IRR
- 13.9%
- Equity multiple
- 3.82×
- Total profit
- $786,661
- Equity at exit
- $1,128,529
Cash invested: $278,600 (down + closing). Projections, not guarantees.
Landlord ↔ Tenant lean methodology
- Overall (CITY)
- 0 Strongly Tenant-Friendly
- State New York
- 15 Strongly Tenant-Friendly · D+10
- County
- — inherits STATE
- City New York
- 0 Strongly Tenant-Friendly · D+34
ZIP-level market 11201
- Home prices YoY
- 1.9%
- Rents YoY
- 5.4%
- Active inventory
- 405
- Price-to-rent
- 22.6×
Monthly cashflow live
- Estimated rent
- $7,349 medium interval (Pro) →
- Mortgage (P&I)
- −$5,218
- Tax est. 1.5%
- −$1,244 /mo · $14,925/yr
- Insurance
- −$415
- HOA
- −$0
- Vacancy / Maint / Mgmt
- −$1,543
- Net cashflow
- $-1,071
Break-even live
Sensitivity live
| Price | -10% $-383 | -5% $-727 | +0% $-1,071 | +5% $-1,414 | +10% $-1,758 |
|---|---|---|---|---|---|
| Rent | -10% $-1,651 | -5% $-1,361 | +0% $-1,071 | +5% $-780 | +10% $-490 |
| Rate | -1.0pp $-569 | -0.5pp $-817 | base $-1,071 | +0.5pp $-1,328 | +1.0pp $-1,591 |
2-unit breakdown (identical units grouped — click to expand)
| Units | Beds | Baths | Est. rent |
|---|---|---|---|
| 2× units | 2 | 1 | $7,348 |
| #1 | 2 | 1 | $3,674 |
| #2 | 2 | 1 | $3,674 |
| Total (2 units) | $7,349 | ||
UW: 25.0% down · 7.5% · 30yr · 1.5% tax · 5.0% vac · 8.0% maint · 8.0% mgmt
Financing live
Cash to close
- Down payment
- $248,750
- Closing costs
- $29,850
- Reserves months
- —
- Total cash needed
- —
Loan-product check · same deal, 3 products live
Conventional
25% down · 7.5% · 30yr
- Down + closing
- —
- Monthly P&I
- —
- Monthly cashflow
- —
- DSCR
- —
- Eligible?
- —
Personal DTI + credit; lowest rate.
DSCR
20% down · 8.5% · 30yr
- Down + closing
- —
- Monthly P&I
- —
- Monthly cashflow
- —
- DSCR
- —
- Eligible?
- —
No personal income docs; deal must DSCR.
Hard money
10% down · 12.0% · 12mo
- Down + closing
- —
- Monthly P&I
- —
- Monthly cashflow
- —
- DSCR
- —
- Eligible?
- —
Short-term bridge; refi at stabilization.
Rent comps 37 comps
| Address | Beds | Baths | Sqft | Rent | $/sqft | DOM | Units | Dist |
|---|---|---|---|---|---|---|---|---|
| 200 Montague St #1516 Brooklyn, NY | 1.0 | 1.0 | 600 | $7,500 | $12.50 | 22d | 1 | 0.28mi |
| 180 Montague St Brooklyn, NY | 3.0 | 1.0–2.0 | 901 | $6,389 | $7.09 | 1d | 12 | 0.30mi |
| 111 Lawrence St Brooklyn, NY | 3.0 | 1.0–2.0 | 950 | $5,503 | $5.79 | 0d | 22 | 0.30mi |
| 343 Gold St Brooklyn, NY | 3.0 | 1.0–2.0 | 903 | $6,719 | $7.44 | 6d | 1 | 0.34mi |
| 100 Jay St Unit 6B Brooklyn, NY | 1.0 | 1.0 | 800 | $4,600 | $5.75 | 26d | 1 | 0.35mi |
| 150 Lawrence St Brooklyn, NY | 1.0–2.0 | 1.0–2.0 | 700 | $5,340 | $7.63 | 1d | 2 | 0.38mi |
| 100 Willoughby St Brooklyn, NY | 3.0 | 1.0–2.0 | 892 | $7,100 | $7.96 | 9d | 1 | 0.38mi |
| 141 Joralemon St #819 Brooklyn, NY | 1.0–3.0 | 1.0–2.0 | 750 | $6,730 | $8.97 | 1d | 3 | 0.40mi |
| 214 Duffield St Brooklyn, NY | 3.0 | 1.0–2.0 | 956 | $6,427 | $6.72 | 0d | 1 | 0.40mi |
| 107 Columbia Hts #1757 Brooklyn, NY | 1.0–2.0 | 1.0–2.0 | 708 | $8,270 | $11.68 | 1d | 2 | 0.42mi |
| 241 Atlantic Ave #879 Brooklyn, NY | 1.0–3.0 | 1.0–2.0 | 1098 | $8,100 | $7.37 | 1d | 3 | 0.54mi |
| 196 Willoughby St Brooklyn, NY | 2.0 | 1.0–2.0 | 717 | $7,921 | $11.05 | 0d | 7 | 0.55mi |
| 68 Gold St New York, NY | 1.0–2.0 | 1.0 | 700 | $7,050 | $10.07 | 26d | 2 | 0.59mi |
| 540 Fulton St #1729 Brooklyn, NY | 3.0 | 1.0–2.0 | 750 | $7,563 | $10.08 | 26d | 4 | 0.66mi |
| 333 Schermerhorn St Brooklyn, NY | 1.0 | 1.0 | 585 | $6,782 | $11.58 | 0d | 15 | 0.77mi |
| 252 South St Unit 74B New York, NY | 2.0 | 2.0 | 1034 | $8,995 | $8.70 | 19d | 1 | 0.98mi |
| 211 Front St Unit 1255364P New York, NY | 1.0 | 1.0 | 990 | $11,206 | $11.32 | 26d | 1 | 1.04mi |
| 151 S Elliott Pl Brooklyn, NY | 1.0–2.0 | 1.0–2.0 | 655 | $6,380 | $9.74 | 3d | 2 | 1.09mi |
| 180 Water St #537 New York, NY | 1.0–2.0 | 1.0–2.0 | 728 | $9,400 | $12.91 | 4d | 2 | 1.15mi |
| 95 Wall St New York, NY | 2.0 | 1.0–2.0 | 881 | $8,263 | $9.37 | 1d | 33 | 1.16mi |
| 75 Wall St Unit 251 New York, NY | 1.0 | 1.5 | 653 | $6,580 | $10.08 | 26d | 1 | 1.19mi |
| 10 Hanover Sq New York, NY | 2.0 | 1.0–2.0 | 790 | $7,713 | $9.76 | 1d | 25 | 1.21mi |
| 461 Dean St Brooklyn, NY | 1.0 | 1.0 | 781 | $5,320 | $6.81 | 7d | 5 | 1.22mi |
| 67 Wall St #13 New York, NY | 1.0–2.0 | 1.0 | 636 | $7,380 | $11.59 | 4d | 2 | 1.22mi |
| 478 Kent Ave Brooklyn, NY | 2.0 | 1.0–2.0 | 775 | $7,530 | $9.72 | 4d | 3 | 1.23mi |
| 482 Kent Ave Brooklyn, NY | 2.0 | 1.0–2.0 | 750 | $8,290 | $11.05 | 1d | 3 | 1.23mi |
| 63 Wall St #1971 New York, NY | 1.0 | 1.0 | 489 | $5,120 | $10.46 | 1d | 2 | 1.24mi |
| 3 Hanover Sq New York, NY | 3.0 | 1.0–2.0 | 600 | $6,072 | $10.12 | 26d | 5 | 1.26mi |
| 11 Wharf Way Brooklyn, NY | 1.0 | 1.0 | 610 | $4,870 | $7.98 | 1d | 2 | 1.26mi |
| 15 William St New York, NY | 1.0–2.0 | 1.0–2.0 | 822 | $6,550 | $7.96 | 9d | 10 | 1.31mi |
| 8 Spruce St Unit 31S New York, NY | 3.0 | 2.0 | 1100 | $8,000 | $7.27 | 9d | 1 | 1.32mi |
| 655 Union St #1846 Brooklyn, NY | 1.0–2.0 | 1.0–2.0 | 727 | $7,810 | $10.74 | 4d | 2 | 1.36mi |
| 180 Broome St #1521 New York, NY | 1.0–2.0 | 1.0–2.0 | 850 | $10,630 | $12.51 | 3d | 2 | 1.39mi |
| 475 Clermont Ave Brooklyn, NY | 2.0 | 1.0–2.0 | 807 | $6,596 | $8.17 | 0d | 6 | 1.41mi |
| 140 Broadway Unit 1298277P New York, NY | 1.0 | 1.0 | 699 | $9,406 | $13.46 | 24d | 1 | 1.43mi |
| 125 Delancey St #1523 New York, NY | 1.0–2.0 | 1.0–2.0 | 850 | $9,670 | $11.38 | 3d | 2 | 1.47mi |
| 545 Vanderbilt Ave Brooklyn, NY | 2.0 | 1.0 | 600 | $6,280 | $10.47 | 4d | 3 | 1.48mi |
Listing history 13 events
-
2026-06-21days on market $995,000 Active 35 DOM
-
2026-06-18days on market $995,000 Active 32 DOM
-
2026-06-17days on market $995,000 Active 31 DOM
-
2026-06-15days on market $995,000 Active 29 DOM
-
2026-06-13days on market $995,000 Active 27 DOM
-
2026-06-10days on market $995,000 Active 23 DOM
-
2026-06-08days on market $995,000 Active 22 DOM
-
2026-06-03days on market $995,000 Active 17 DOM
-
2026-06-01days on market $995,000 Active 15 DOM
-
2026-05-31days on market $995,000 Active 14 DOM
-
2026-05-17$995,000 Active
-
2025-02-22historical $2,500
-
2025-01-15$2,500
ⓘ Source: listings_history table (triggers on properties + properties_extension) + one-shot
backfill from property_details.listing_events for pre-trigger history.
Climate risk First Street
- Flood 1/10 Low FEMA zone X (unshaded) · 0% chance over 30 yrs
- Wildfire 1/10 Low
- Heat 6/10 Major 7 d/yr ≥99°F today · 15 d/yr by 30 yrs out
- Wind 6/10 Major 27% chance of damaging wind over 30 yrs
- Air quality 4/10 Moderate 5 unhealthy d/yr today · 7 by 30 yrs out
Nearby sold comps map
Loading sold comps map…
Walkable amenities ~0.75 mi
Loading nearby amenities…
Taxation est. · year 1
- Rental income
- $88,188
- − Mortgage interest
- −$55,735
- − Property taxes
- −$14,925
- − Insurance
- −$4,975
- − Repairs & maintenance
- −$7,055
- − Management
- −$7,055
- − Depreciation
- −$28,945
- Taxable loss
- −$30,503
- Est. tax savings @ 24.0%
- +$7,321
- After-tax cash flow
- $-5,525/yr
For passive investors: Depreciation is non-cash, so a rental often shows a tax loss while cash-flowing — sheltering income. Rental losses are passive: they offset passive income freely, and up to $25,000/yr can offset ordinary (W-2) income if you actively participate and your MAGI is under $100k (phasing out to $0 by $150k); unused losses carry forward. On sale, claimed depreciation is recaptured at up to 25%, and gains may owe capital-gains tax (a 1031 exchange can defer both). Figures are a year-1 estimate at your 24.0% rate — not tax advice; consult a CPA.
Condition & rehab AI · 2 photos
A fair condition multi-family property in Brooklyn Heights with some cosmetic repairs and maintenance needed. Potential for significant value increase with exterior painting and landscaping improvements.
Repairs flagged
- Minor Exterior paint — Some discoloration visible on the brick building
- Minor Landscaping — Needs trimming and better maintenance
Value-add opportunities
- Both Paint exterior — Enhances curb appeal and property value
- Both Landscaping — Improves curb appeal and enhances property value
Renovation cost estimate screening
| Repair item | Severity | Est. cost |
|---|---|---|
| Exterior paint · Some discoloration visible on the brick building | Minor | $500–3,000 |
| Landscaping · Needs trimming and better maintenance | Minor | $500–3,000 |
| Total estimated repair cost · 2 items | $1,000–6,000 |
Value-add ROI direction
- Both Paint exterior — Enhances curb appeal and property value ↑
- Both Landscaping — Improves curb appeal and enhances property value ↑
ⓘ Cost ranges are severity-bucket heuristics (US national rule-of-thumb). Get contractor quotes + a written scope before underwriting a rehab budget.
Schools (NCES district)
No district data.
Livability — New York
- Score
- 75/100
- State rank
- #268
- US rank
- #4188
Category grades
Schools grade is shown separately in the Schools card above.
Census & demographics
- Census place
- New York, NY
- County
- Kings County · 2,614,986 people
- City population
- 7,731,280
- Metro
- New York-Newark-Jersey City, NY-NJ-PA
- Population (ZIP)
- 70,674
- Household income
- $173,136
- Rent vs Own
- Severe rent burden
- 4080.0
Population outlook (Kings County) Hauer SSP2
- Today (2025)
- 2,847,441 people
- By 2030
- 2,937,006 · +3.1%
- By 2040
- 3,095,491 · +8.7%
- By 2050
- 3,228,968 · +13.4%
- By 2075
- 3,321,723 · +16.7%
- By 2100
- 3,111,387 · +9.3%
Race, ethnicity, and origin ACS 2023
- Neighborhood character
- Diverse neighborhood (Simpson 0.62)
- Race & ethnicity
- White 58% Asian 14% Black 12% Hispanic / Latino 11% Two or more races 10%
- Hispanic origin (detail)
- Mexican 1% Puerto Rican 3% Dominican 2%
- Common ancestry
- Romanian 4% Scotch-Irish 3% Lithuanian 3%
- Foreign-born
- 21% · Canada, China, South Korea
- Languages at home
- 75% English-only · Spanish 7% Chinese 6% Other Indo-European 3%
Political lean MEDSL · Kings
- 2024 margin
- Solid D (+44.0) · D 72.0% · R 28.0%
- 2008→2024 swing
- -15.5pp toward R · 2008: 59.4pp · 2024: 44.0pp
- All cycles
- 2024: D+44.0 2020: D+54.8 2016: D+61.8 2012: D+63.9 2008: D+59.4
Not yet ingested
- Civics
- —
Market trends
- HPI YoY
- ▲ 5.97%
- Current HPI
- 321.3623
- Rent YoY
- ▲ 5.39%
- Metro
- New York-Newark-Jersey City, NY-NJ-PA
- State GDP YoY
- ▲ 2.60%
- F500 in state
- 92
Industry mix (Fortune 500 HQ in NY)
| Industry | F500 HQs | Revenue |
|---|---|---|
| Financial Services | 10 | $950B |
|
||
| Consumer Goods | 9 | $162B |
|
||
| Insurance | 4 | $225B |
|
||
| Telecommunications | 2 | $144B |
|
||
| Pharmaceuticals | 2 | $112B |
|
||
| Media / Entertainment | 2 | $69B |
|
||
Price history
+39700.0% since first listed3 events — show timeline
- 2026-05-17 Listed $995,000 FSBO.com
- 2025-02-22 Rental Removed $2,500 PROPERTYWARE
- 2025-01-15 Listed for Rent $2,500 PROPERTYWARE
Cash-flow waterfall
monthlySold comps — $/sqft
last 12 mo · ≤1 miLoading sold comps…