333 Childs Ave Unit C5 · Ogden, UT
Flood risk No data
- FEMA flood zone
- —
- Chance of flooding over 30 yrs
- —
- Est. flood insurance / yr
- —
Fire risk No data
- Est. fire insurance / yr
- —
Heat risk No data
- Hot days now (above threshold)
- —
- Hot days in 30 yrs
- —
Wind risk No data
- Chance of severe wind over 30 yrs
- —
Air-quality risk No data
- Unhealthy air days now
- —
- Unhealthy air days in 30 yrs
- —
Risk factors via First Street. Map © Google.
Why this score? — see what drove the B grade
The composite is a weighted blend of 9 inputs, each scored 0–100. Each bar is that input's sub-score; the figure is the points it added to the 100-point composite (weight × sub-score).
- Cash flow +30.0/30.0
- DSCR +10.0/10.0
- 1% rule +9.2/10.0
- ARV discount +7.5/15.0
- Condition / age +4.8/5.0
- Livability +4.2/5.0
- Rent growth +3.1/5.0
- Schools +2.4/10.0
- Appreciation +0.0/10.0
$104,900
🖨 Deal sheet 📄 Offer letter ✓ Due diligence
Listing remarks
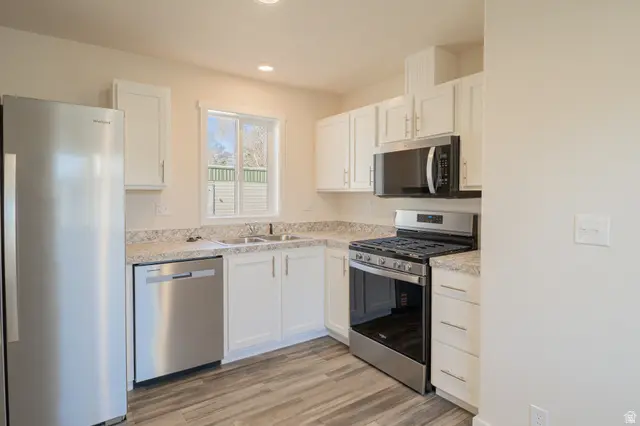
Welcome to this brand new 2-bedroom, 2-bath mobile home located in a desirable 55+ community with affordable lot rent. This home offers a comfortable and functional layout filled with natural light, creating a warm and inviting space to relax or entertain. Conveniently located just minutes from shopping, dining, parks, and easy access to downtown Ogden, you'll love the balance of quiet community living with nearby amenities. Don't miss this opportunity for affordable, low-maintenance living in a great location-schedule your showing today! Buyer is advised to obtain an independent measurement.
Key facts
- Natural light
- Comfortable layout
- Built 2025
Tags
Property features AI
Finance
- HOA & community: Clubhouse
Exterior
- Utilities: Natural gas available; Electricity available; Water connected; Sewer connected
- Home design: Mobile home; Residential use; Single-family zoning; 840 above-grade finished area
- Construction: Asphalt and clapboard/masonite siding; Built/standing construction
- Exterior features: Double pane windows; Asphalt roof
Interior
- Kitchen: Refrigerator
- Bedrooms: 2 main-level bedrooms
- Bathrooms: 2 full bathrooms
- Heating & cooling: Forced air heating; Central air conditioning
- Interior features: Refrigerator; Double pane windows
Neighborhood map
What this means for you Summary
Snapshot
- This is a 2-bed/2.0-bath manufactured listed at $105k. Condition is rated excellent.
Deal economics
- At list price, monthly cash flow is $448 ($5k/yr) — positive.
- The deal already cash-flows at list — no discount required.
- Meets the 1% rule at list price ($1k rent vs $105k).
- Recommended offer: $99k (6.0% below list) — sets the bar for market timing.
Location & tenants
- Location reads 84/100 on livability (#19 in UT, #810 nationally) — a professional / high-income tenant draw. Strengths: amenities A+, commute A+, cost of living A+; Watch: crime F.
- Ogden City District (urban): math 25% / reading 31% proficiency, ranked #72 of 80 in UT (top 90%) — low school quality limits family demand, transient renter base, plan for 1-2y turnover; 75% free/reduced lunch — lower-income household profile, screen leases tightly.
- Zoned schools: Heritage School (math 21% / reading 25%, grade F, #501 of 585 statewide, top 86%, 638 students, 100% FRL); Highland Junior High (math 12% / reading 18%, grade F, #135 of 138 statewide, top 98%, 715 students, 0% FRL); Ben Lomond High (math 11% / reading 28%, grade F, #158 of 171 statewide, top 94%, 1,169 students, 44% FRL) — zoned schools average 48% FRL vs 75% district-wide (27 pts lower); this property's tenant base skews higher-income than the district average.
- Market conditions: Rents rising (+2.3%/yr); 611 active listings in the ZIP; 15 comparable units currently listed for rent nearby; rentals at typical pace (median 23d on market — plan ~3-4 weeks tenant-placement turnaround); solid renter incomes; 1,630 units permitted in Weber County in 2024 (521 in 5+ unit buildings).
Forward outlook
- Local home prices are declining (-3.0%/yr); year-one equity from $725 of loan paydown is wiped out by about $3k of value loss. Plan a longer hold.
- Weber County population projected at +24% by 2050 — long-run rental-demand tailwind backs the buy-and-hold thesis.
- At projected returns (-3.0% appreciation + 2.3% rent growth), your $29k cash investment doubles in ~7 years — after that, you're playing with house money.
Negotiation context
- It's been on market 85 days — a 6% lower offer ($99k) is reasonable based on typical stale-listing flexibility.
Questions for the listing agent
- It's been on market 85 days. Have you received any prior offers? Is the seller open to a 6% concession, seller financing, or rate buy-down credit?
- Why hasn't it sold? Are there any deal-killer items the seller is aware of (foundation, flood, title, zoning, code violations)?
- Is there a deadline driving the sale (1031 exchange, divorce, estate, relocation)? That informs how much negotiation room exists.
- Crime grade is F in this area — have there been break-ins, vandalism, or insurance claims at this property in the last 3 years? What carrier currently insures it and at what premium?
- What's the average days-on-market for RENTAL listings here right now (not sales)? A rising rental-DOM trend means longer vacancies and softer asking-rent achievability than the comps imply.
- What's the recent tenant-quality profile in this submarket — average credit score on applications, eviction rate, late-payment / NSF rate, and stable-employment percentage? A property-management company in the area should have these aggregated.
- How much new for-sale + rental construction is in the pipeline within 1–3 miles? Heavy new supply typically softens prices + rents 12–24 months out; constrained supply supports both.
Investment metrics
- 1% rule
- 1.42% ✓
- Cap rate
- 11.42%
- Cash-on-cash
- 18.30%
- DSCR
- 1.81
- GRM
- 5.9
CMA / ARV
No comps found within radius.
Projected returns pro-forma
-3.0% appreciation · 2.33% rent growth · sell at horizon
- IRR
- 9.2%
- Equity multiple
- 1.36×
- Total profit
- $10,563
- Equity at exit
- $15,641
- IRR
- 17.8%
- Equity multiple
- 2.43×
- Total profit
- $42,006
- Equity at exit
- $9,070
Cash invested: $29,372 (down + closing). Projections, not guarantees.
Landlord ↔ Tenant lean methodology
- Overall (STATE)
- 86 Strongly Landlord-Friendly
- State Utah
- 86 Strongly Landlord-Friendly · R+15
- County
- — inherits STATE
- City
- — inherits STATE
ZIP-level market 84404
- Rents YoY
- 2.3%
- Active inventory
- 611
- Price-to-rent
- 5.9×
Monthly cashflow live
- Estimated rent
- $1,485 high interval (Pro) →
- Mortgage (P&I)
- −$550
- Tax est. 1.5%
- −$131 /mo · $1,574/yr
- Insurance
- −$44
- HOA
- −$0
- Vacancy / Maint / Mgmt
- −$312
- Net cashflow
- $448
Break-even live
UW: 25.0% down · 7.5% · 30yr · 1.5% tax · 5.0% vac · 8.0% maint · 8.0% mgmt
Financing live
Cash to close
- Down payment
- $26,225
- Closing costs
- $3,147
- Reserves months
- —
- Total cash needed
- —
Loan-product check · same deal, 3 products live
Conventional
25% down · 7.5% · 30yr
- Down + closing
- —
- Monthly P&I
- —
- Monthly cashflow
- —
- DSCR
- —
- Eligible?
- —
Personal DTI + credit; lowest rate.
DSCR
20% down · 8.5% · 30yr
- Down + closing
- —
- Monthly P&I
- —
- Monthly cashflow
- —
- DSCR
- —
- Eligible?
- —
No personal income docs; deal must DSCR.
Hard money
10% down · 12.0% · 12mo
- Down + closing
- —
- Monthly P&I
- —
- Monthly cashflow
- —
- DSCR
- —
- Eligible?
- —
Short-term bridge; refi at stabilization.
Rent comps 15 comps
| Address | Beds | Baths | Sqft | Rent | $/sqft | DOM | Units | Dist |
|---|---|---|---|---|---|---|---|---|
| 455 2nd St Ogden, UT | 1.0–2.0 | 1.0–2.0 | 838 | $1,499 | $1.79 | 14d | 5 | 0.36mi |
| 200 N Harrisville Rd Ogden, UT | 2.0 | 1.0 | 750 | $1,400 | $1.87 | 23d | 1 | 0.40mi |
| 381 N Washington Blvd Ogden, UT | 1.0–3.0 | 1.0–2.0 | 1062 | $1,446 | $1.36 | 14d | 15 | 0.51mi |
| 348 8th St Ogden, UT | 2.0 | 1.0 | 1037 | $1,695 | $1.63 | 23d | 1 | 0.56mi |
| 940 Kiesel Ave Ogden, UT | 2.0 | 1.0 | 708 | $1,200 | $1.69 | 23d | 1 | 0.71mi |
| 445 E 800 North St Ogden, UT | 2.0 | 1.0 | 1030 | $1,250 | $1.21 | 23d | 1 | 1.01mi |
| 231 W 12th St Ogden, UT | 1.0–2.0 | 1.0–2.0 | 813 | $1,544 | $1.90 | 14d | 14 | 1.06mi |
| 1075 Century Dr Ogden, UT | 2.0 | 1.0–2.0 | 731 | $1,599 | $2.19 | 23d | 1 | 1.08mi |
| 407 W 12th St Ogden, UT | 2.0 | 1.0–2.0 | 694 | $1,650 | $2.38 | 23d | 1 | 1.14mi |
| 324 14th St Ogden, UT | 2.0 | 2.0 | 936 | $1,495 | $1.60 | 23d | 1 | 1.15mi |
| 820 Monroe Blvd Ogden, UT | 1.0–2.0 | 1.0 | 875 | $1,350 | $1.54 | 23d | 2 | 1.22mi |
| 873 12th St Ogden, UT | 2.0 | 1.0 | 845 | $1,095 | $1.30 | 23d | 1 | 1.36mi |
| 615 15th St Ogden, UT | 2.0 | 1.0 | 1097 | $1,000 | $0.91 | 23d | 1 | 1.40mi |
| 462 Canyon Rd Ogden, UT | 2.0 | 1.0 | 900 | $930 | $1.03 | 23d | 1 | 1.43mi |
| 1658 Gibson Ave Ogden, UT | 2.0 | 2.0 | 1057 | $1,800 | $1.70 | 21d | 1 | 1.49mi |
Listing history 19 events
-
2026-06-18days on market $104,900 Active 85 DOM
-
2026-06-17days on market $104,900 Active 84 DOM
-
2026-06-16days on market $104,900 Active 83 DOM
-
2026-06-15days on market $104,900 Active 82 DOM
-
2026-06-14days on market $104,900 Active 80 DOM
-
2026-06-13days on market $104,900 Active 79 DOM
-
2026-06-10pricedays on market $104,900 Active 77 DOM
-
2026-06-09days on market $115,499 Active 76 DOM
-
2026-06-08days on market $115,499 Active 75 DOM
-
2026-06-07days on market $115,499 Active 74 DOM
-
2026-06-05days on market $115,499 Active 71 DOM
-
2026-06-03days on market $115,499 Active 70 DOM
-
2026-06-02days on market $115,499 Active 69 DOM
-
2026-06-01days on market $115,499 Active 68 DOM
-
2026-05-31days on market $115,499 Active 67 DOM
-
2026-05-31days on market $115,499 Active 66 DOM
-
2026-05-05price $115,499
-
2026-04-10price $120,499
-
2026-03-25$124,999 Active
ⓘ Source: listings_history table (triggers on properties + properties_extension) + one-shot
backfill from property_details.listing_events for pre-trigger history.
Nearby sold comps map
Loading sold comps map…
Walkable amenities ~0.75 mi
Loading nearby amenities…
Taxation est. · year 1
- Rental income
- $17,817
- − Mortgage interest
- −$5,876
- − Property taxes
- −$1,574
- − Insurance
- −$524
- − Repairs & maintenance
- −$1,425
- − Management
- −$1,425
- − Depreciation
- −$3,052
- Taxable income
- $3,941
- Est. tax owed @ 24.0%
- −$946
- After-tax cash flow
- $4,430/yr
For passive investors: Depreciation is non-cash, so a rental often shows a tax loss while cash-flowing — sheltering income. Rental losses are passive: they offset passive income freely, and up to $25,000/yr can offset ordinary (W-2) income if you actively participate and your MAGI is under $100k (phasing out to $0 by $150k); unused losses carry forward. On sale, claimed depreciation is recaptured at up to 25%, and gains may owe capital-gains tax (a 1031 exchange can defer both). Figures are a year-1 estimate at your 24.0% rate — not tax advice; consult a CPA.
Condition & rehab AI · 13 photos
This brand new 2-bedroom, 2-bath mobile home in a desirable 55+ community is move-in ready with excellent condition and minimal maintenance required. It offers a comfortable and functional layout filled with natural light, creating a warm and inviting space to relax or entertain. The home is conveniently located just minutes from shopping, dining, parks, and easy access to downtown Ogden, making it an ideal location for both homeowners and renters.
Value-add opportunities
- Both Painting the exterior siding — Fresh paint can enhance curb appeal and add value to the home.
- Both Landscaping improvements — A well-maintained yard can increase both resale and rental value.
- Both Adding a small shed or storage unit — Additional storage can be useful for both homeowners and renters.
- Both Upgrading the flooring in the bathrooms — Modern, durable flooring can improve the look and functionality of the bathrooms.
Renovation cost estimate screening
Value-add ROI direction
- Both Painting the exterior siding — Fresh paint can enhance curb appeal and add value to the home. ↑
- Both Landscaping improvements — A well-maintained yard can increase both resale and rental value. ↑
- Both Adding a small shed or storage unit — Additional storage can be useful for both homeowners and renters. ↑
- Both Upgrading the flooring in the bathrooms — Modern, durable flooring can improve the look and functionality of the bathrooms. ↑
ⓘ Cost ranges are severity-bucket heuristics (US national rule-of-thumb). Get contractor quotes + a written scope before underwriting a rehab budget.
Schools (NCES district)
- District
- Ogden City District
- NCES district ID
- 4900720
- Math proficiency
- 25% ▼ -2.00%
- Reading proficiency
- 31% ▼ -5.00%
- Median HH income
- $41,974
- Composite
- 23.76/100
- National rank
- #7818
- State rank
- #72 of 80 in UT
Livability — Ogden
- Score
- 84/100
- State rank
- #19
- US rank
- #810
Category grades
Schools grade is shown separately in the Schools card above.
Census & demographics
- Census place
- Ogden, UT
- County
- Weber County · 260,557 people
- City population
- 152,611
- Metro
- Ogden-Clearfield, UT
- Population (ZIP)
- 66,587
- Household income
- $85,057
- Rent vs Own
- Severe rent burden
- 1201.0
Population outlook (Weber County) Hauer SSP2
- Today (2025)
- 274,329 people
- By 2030
- 288,577 · +5.2%
- By 2040
- 314,848 · +14.8%
- By 2050
- 338,710 · +23.5%
- By 2075
- 384,412 · +40.1%
- By 2100
- 409,305 · +49.2%
Race, ethnicity, and origin ACS 2023
- Neighborhood character
- Predominantly White (70%)
- Race & ethnicity
- White 70% Hispanic / Latino 24% Two or more races 7% Asian 1%
- Hispanic origin (detail)
- Mexican 20%
- Common ancestry
- Italian 5% Slovak 4% Iranian 3%
- Foreign-born
- 8% · Canada
- Languages at home
- 83% English-only · Spanish 15% Other Indo-European 1%
Political lean MEDSL · Weber
- 2024 margin
- Strong R (+23.5) · D 36.8% · R 60.3% · Other 2.9%
- 2008→2024 swing
- +4.1pp toward D · 2008: -27.6pp · 2024: -23.5pp
- All cycles
- 2024: R+23.5 2020: R+22.7 2016: R+20.0 2012: R+46.0 2008: R+27.6
Not yet ingested
- Civics
- —
Market trends
- HPI YoY
- ▼ -317.85%
- Current HPI
- 323.2499
- Rent YoY
- ▲ 2.33%
- Metro
- Ogden-Clearfield, UT
- State GDP YoY
- ▲ 3.54%
- F500 in state
- 2
Industry mix (Fortune 500 HQ in UT)
| Industry | F500 HQs | Revenue |
|---|---|---|
| Financial Services | 1 | $3B |
|
||
Price history
-7.6% since first listed3 events — show timeline
- 2026-05-05 Price Changed $115,499 WFRMLS
- 2026-04-10 Price Changed $120,499 WFRMLS
- 2026-03-25 Listed $124,999 WFRMLS
Cash-flow waterfall
monthlySold comps — $/sqft
last 12 mo · ≤1 miLoading sold comps…