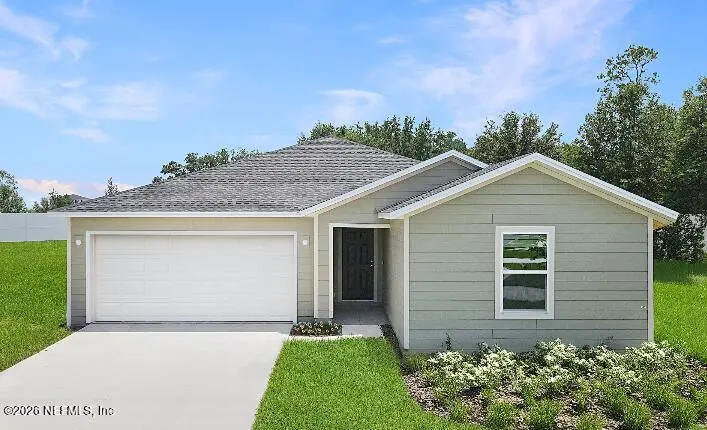
2814 Little Trout Ln · Asbury Lake, FL
Flood risk No data
- FEMA flood zone
- —
- Chance of flooding over 30 yrs
- —
- Est. flood insurance / yr
- —
Fire risk No data
- Est. fire insurance / yr
- —
Heat risk No data
- Hot days now (above threshold)
- —
- Hot days in 30 yrs
- —
Wind risk No data
- Chance of severe wind over 30 yrs
- —
Air-quality risk No data
- Unhealthy air days now
- —
- Unhealthy air days in 30 yrs
- —
Risk factors via First Street. Map © Google.
Why this score? — see what drove the F grade
The composite is a weighted blend of 9 inputs, each scored 0–100. Each bar is that input's sub-score; the figure is the points it added to the 100-point composite (weight × sub-score).
- ARV discount +7.5/15.0
- Cash flow +6.7/30.0
- Schools +5.1/10.0
- Livability +3.1/5.0
- Rent growth +2.6/5.0
- Condition / age +2.5/5.0
- 1% rule +2.1/10.0
- DSCR +0.9/10.0
- Appreciation +0.0/10.0
$346,485
🖨 Deal sheet (PDF) 📄 Offer letter ✓ Due diligence
Listing remarks
Under construction: Ready May 2026! Lennar Homes Celeste Floor plan with 4 bedrooms, 2 baths, and 2 car garage. Everything Included features 36 inch white recessed panel cabinetry with quartz countertops, stainless steel appliances including range, dishwasher, microwave, and refrigerator, wood inspired LVP flooring, Honeywell Z Wave smart thermostat and energy efficient water heater. Limited one year warranty on workmanship, dedicated customer care service program, and 24 hour emergency customer service. (Conditions may apply)
Key facts
- 0.25 acre lot
- 2 garage spots
- Built 2026
Neighborhood map
What this means for you Summary
Snapshot
- This is a 4-bed/2.0-bath land listed at $346k.
Deal economics
- At list price, monthly cash flow is $-562 ($-7k/yr) — negative.
- To cash-flow at today's rent, offer at most $265k (23.5% below list).
- To meet the 1% rule (rent ≥ 1% of price), the offer needs to be $245k (29.2% below list).
- Recommended offer: $245k (29.2% below list) — sets the bar for 1% rule.
Location & tenants
- Location reads 61/100 on livability (#776 in FL) — a middle-class / working-renter tenant base. Strengths: housing A+, employment A, crime A-; Watch: amenities F, commute F, health & safety F.
- Clay (suburban): math 58% / reading 59% proficiency, ranked #14 of 73 in FL (top 19%) — acceptable for families but not a draw, mixed tenant base, ~2y average lease.
- Zoned schools: Lake Asbury Elementary School (math 69% / reading 64%, grade B+, #473 of 2,144 statewide, top 23%, 975 students, 38% FRL); Lake Asbury Junior High School (math 65% / reading 58%, grade B+, #124 of 571 statewide, top 22%, 1,037 students, 41% FRL); Clay High School (math 37% / reading 53%, grade D-, #228 of 667 statewide, top 35%, 1,666 students, 43% FRL).
- Market conditions: Rents flat; 891 active listings in the ZIP; 8 comparable units currently listed for rent nearby; rentals at typical pace (median 18d on market — plan ~3-4 weeks tenant-placement turnaround); solid renter incomes; 1,876 units permitted in Clay County in 2024 (14 in 5+ unit buildings).
- This rent runs 35% of the median local income ($84k/yr) — at the standard rent-burdened threshold; future hikes will face affordability resistance.
Forward outlook
- Local home prices are declining (-3.0%/yr); year-one equity from $2k of loan paydown is wiped out by about $10k of value loss. Plan a longer hold.
- Clay County population projected at +19% by 2050 — long-run rental-demand tailwind backs the buy-and-hold thesis.
Negotiation context
- Only 7 days on market — expect competitive offers; lowballing is unlikely to land.
Questions for the listing agent
- What do current leases actually rent for vs. the listed asking? Can we see a recent rent roll and the last 12 months of T-12 income?
- What does the HOA fee cover, when was the last increase, and are there any pending special assessments or reserve-fund shortfalls?
- Is there a deadline driving the sale (1031 exchange, divorce, estate, relocation)? That informs how much negotiation room exists.
- Schools are F-rated, which usually means shorter tenancies and higher turnover. Who's the typical renter profile here, and what's been the actual vacancy rate?
- The area grade is low — what's the realistic commute time and amenity access for the typical tenant pool here? Any planned neighborhood developments (good or bad) we should know about?
- What's the average days-on-market for RENTAL listings here right now (not sales)? A rising rental-DOM trend means longer vacancies and softer asking-rent achievability than the comps imply.
- What's the recent tenant-quality profile in this submarket — average credit score on applications, eviction rate, late-payment / NSF rate, and stable-employment percentage? A property-management company in the area should have these aggregated.
- How much new for-sale + rental construction is in the pipeline within 1–3 miles? Heavy new supply typically softens prices + rents 12–24 months out; constrained supply supports both.
Investment metrics
- 1% rule
- 0.71% ✗
- Cap rate
- 4.35%
- Cash-on-cash
- -6.95%
- DSCR
- 0.69
- GRM
- 11.8
CMA / ARV
No comps found within radius.
Projected returns pro-forma
-3.0% appreciation · 0.46% rent growth · sell at horizon
- IRR
- -31.3%
- Equity multiple
- -0.01×
- Total profit
- $-97,931
- Equity at exit
- $51,662
- IRR
- -52.7%
- Equity multiple
- -0.60×
- Total profit
- $-154,772
- Equity at exit
- $29,958
Cash invested: $97,016 (down + closing). Projections, not guarantees.
Landlord ↔ Tenant lean methodology
- Overall (STATE)
- 87 Strongly Landlord-Friendly
- State Florida
- 87 Strongly Landlord-Friendly · R+3
- County
- — inherits STATE
- City
- — inherits STATE
ZIP-level market 32043
- Home prices YoY
- -26.3%
- Rents YoY
- 0.5%
- Active inventory
- 891
- Price-to-rent
- 11.8×
Monthly cashflow live
- Estimated rent
- $2,453 high interval (Pro) →
- Mortgage (P&I)
- −$1,817
- Tax est. 1.5%
- −$433 /mo · $5,197/yr
- Insurance
- −$144
- HOA
- −$105
- Vacancy / Maint / Mgmt
- −$515
- Net cashflow
- $-562
Break-even live
Sensitivity live
| Price | -10% $-322 | -5% $-442 | +0% $-562 | +5% $-681 | +10% $-801 |
|---|---|---|---|---|---|
| Rent | -10% $-755 | -5% $-659 | +0% $-562 | +5% $-465 | +10% $-368 |
| Rate | -1.0pp $-387 | -0.5pp $-474 | base $-562 | +0.5pp $-651 | +1.0pp $-743 |
UW: 25.0% down · 7.5% · 30yr · 1.5% tax · 5.0% vac · 8.0% maint · 8.0% mgmt
Financing live
Cash to close
- Down payment
- $86,621
- Closing costs
- $10,395
- Reserves months
- —
- Total cash needed
- —
Loan-product check · same deal, 3 products live
Conventional
25% down · 7.5% · 30yr
- Down + closing
- —
- Monthly P&I
- —
- Monthly cashflow
- —
- DSCR
- —
- Eligible?
- —
Personal DTI + credit; lowest rate.
DSCR
20% down · 8.5% · 30yr
- Down + closing
- —
- Monthly P&I
- —
- Monthly cashflow
- —
- DSCR
- —
- Eligible?
- —
No personal income docs; deal must DSCR.
Hard money
10% down · 12.0% · 12mo
- Down + closing
- —
- Monthly P&I
- —
- Monthly cashflow
- —
- DSCR
- —
- Eligible?
- —
Short-term bridge; refi at stabilization.
Rent comps 8 comps
| Address | Beds | Baths | Sqft | Rent | $/sqft | DOM | Units | Dist |
|---|---|---|---|---|---|---|---|---|
| 2935 Darlington Oak Rd Green Cove Springs, FL | 3.0 | 2.5 | 2096 | $2,350 | $1.12 | 9d | 1 | 0.32mi |
| 2555 Bear Creek Way Green Cove Springs, FL | 3.0 | 2.0 | 1655 | $1,835 | $1.11 | 25d | 1 | 0.92mi |
| 2858 Buck Creek Pl Green Cove Springs, FL | 3.0 | 2.0 | 1647 | $1,829 | $1.11 | 18d | 1 | 1.04mi |
| 2621 Fernleaf Dr Green Cove Springs, FL | 4.0 | 2.0 | 1870 | $2,135 | $1.14 | 5d | 1 | 1.20mi |
| 2506 Creekfront Dr Green Cove Springs, FL | 4.0 | 2.0 | 1638 | $2,554 | $1.56 | 25d | 1 | 1.20mi |
| 3549 Bella Sera Ln Green Cove Springs, FL | 3.0 | 2.0 | 1464 | $2,150 | $1.47 | 25d | 1 | 1.21mi |
| 2653 Fernleaf Dr Green Cove Springs, FL | 4.0 | 2.0 | 1638 | $2,005 | $1.22 | 9d | 1 | 1.22mi |
| 2836 Cross Creek Dr Green Cove Springs, FL | 3.0 | 2.0 | 1453 | $1,880 | $1.29 | 13d | 1 | 1.49mi |
HOA detail
- Monthly dues
- $105 · $1,260/yr
- Likely covers
- water
Listing history 3 events
-
2026-03-31status Pending
-
2026-03-24$346,485 Active
-
2026-02-19soldstatus $424,300
ⓘ Source: listings_history table (triggers on properties + properties_extension) + one-shot
backfill from property_details.listing_events for pre-trigger history.
Nearby sold comps map
Loading sold comps map…
Walkable amenities ~0.75 mi
Loading nearby amenities…
Taxation est. · year 1
- Rental income
- $29,435
- − Mortgage interest
- −$19,409
- − Property taxes
- −$5,197
- − Insurance
- −$1,732
- − Repairs & maintenance
- −$2,355
- − Management
- −$2,355
- − HOA
- −$1,260
- − Depreciation
- −$10,080
- Taxable loss
- −$12,952
- Est. tax savings @ 24.0%
- +$3,109
- After-tax cash flow
- $-3,632/yr
For passive investors: Depreciation is non-cash, so a rental often shows a tax loss while cash-flowing — sheltering income. Rental losses are passive: they offset passive income freely, and up to $25,000/yr can offset ordinary (W-2) income if you actively participate and your MAGI is under $100k (phasing out to $0 by $150k); unused losses carry forward. On sale, claimed depreciation is recaptured at up to 25%, and gains may owe capital-gains tax (a 1031 exchange can defer both). Figures are a year-1 estimate at your 24.0% rate — not tax advice; consult a CPA.
Schools (NCES district)
- District
- Clay
- NCES district ID
- 1200300
- Math proficiency
- 58% ▼ -8.00%
- Reading proficiency
- 59% ▼ -3.00%
- Median HH income
- $59,379
- Composite
- 50.73/100
- National rank
- #1815
- State rank
- #14 of 73 in FL
Livability — Asbury Lake
- Score
- 61/100
- State rank
- #776
- US rank
- #17575
Category grades
Schools grade is shown separately in the Schools card above.
Census & demographics
- Census place
- Asbury Lake, FL
- County
- Clay County · 208,450 people
- Metro
- Jacksonville, FL
- Population (ZIP)
- 34,562
- Household income
- $84,145
- Rent vs Own
- Severe rent burden
- 449.0
Population outlook (Clay County) Hauer SSP2
- Today (2025)
- 230,495 people
- By 2030
- 242,427 · +5.2%
- By 2040
- 262,244 · +13.8%
- By 2050
- 275,148 · +19.4%
- By 2075
- 295,397 · +28.2%
- By 2100
- 287,592 · +24.8%
Race, ethnicity, and origin ACS 2023
- Neighborhood character
- Predominantly White (77%)
- Race & ethnicity
- White 77% Black 10% Two or more races 7% Hispanic / Latino 6% Asian 2%
- Hispanic origin (detail)
- Mexican 2% Puerto Rican 1%
- Common ancestry
- Slovak 3% Romanian 2% Lithuanian 2%
- Foreign-born
- 5% · Canada
- Languages at home
- 92% English-only · Spanish 5% French/Haitian/Cajun 1% Other Indo-European 1%
Political lean MEDSL · Clay
- 2024 margin
- Solid R (+39.3) · D 29.9% · R 69.2%
- 2008→2024 swing
- +3.6pp toward D · 2008: -42.8pp · 2024: -39.3pp
- All cycles
- 2024: R+39.3 2020: R+37.1 2016: R+44.3 2012: R+45.8 2008: R+42.8
Not yet ingested
- Civics
- —
Market trends
- HPI YoY
- ▼ -107.34%
- Current HPI
- 301.3212
- Rent YoY
- ▲ 0.46%
- Metro
- Jacksonville, FL
- State GDP YoY
- ▲ 3.28%
- F500 in state
- 36
Industry mix (Fortune 500 HQ in FL)
| Industry | F500 HQs | Revenue |
|---|---|---|
| Industrial Technology | 2 | $29B |
|
||
| Insurance | 2 | $17B |
|
||
| Retail | 1 | $60B |
|
||
| Technology Distribution | 1 | $58B |
|
||
| Homebuilding | 1 | $35B |
|
||
| Technology Manufacturing | 1 | $35B |
|
||
Price history
-18.3% since first listed3 events — show timeline
- 2026-03-31 Pending — realMLS
- 2026-03-24 Listed $346,485 realMLS
- 2026-02-19 Sold (Public Records) $424,300 Public Records
Property tax history
+74.4%/yrLatest (2025): $655 · +74.4% YoY. Source: county tax records.
Cash-flow waterfall
monthlySold comps — $/sqft
last 12 mo · ≤1 miLoading sold comps…