 Multi-family
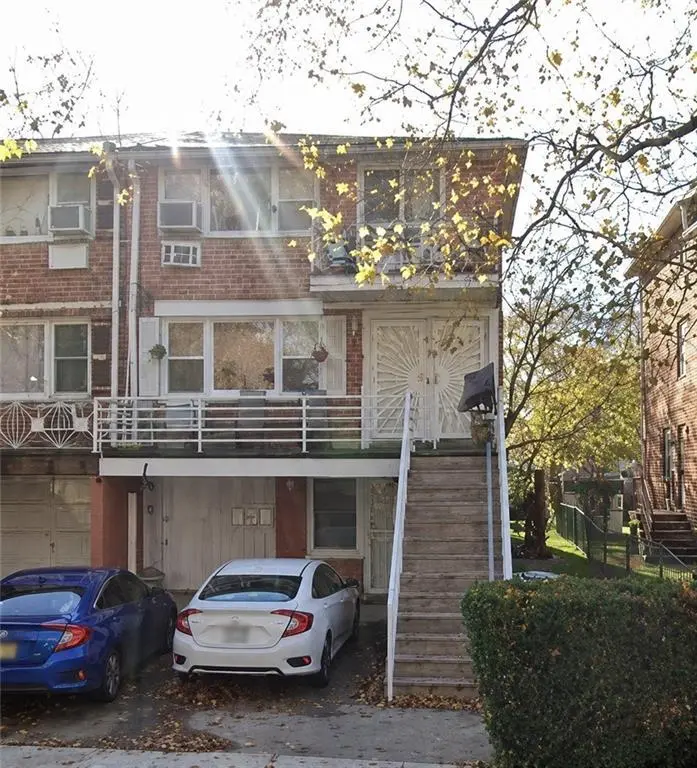
1250 E 69th St · New York, NY
Flood risk 1/10 · Minimal
- FEMA flood zone
- X (unshaded)
- Chance of flooding over 30 yrs
- 0.0%
- Est. flood insurance / yr
- $507 – $1,088
Fire risk 2/10 · Minimal
- Est. fire insurance / yr
- $691 – $1,283
Heat risk 7/10 · Major
- Hot days now (above 97°F)
- 7 days/yr
- Hot days in 30 yrs
- 16 days/yr
Wind risk 6/10 · Moderate
- Chance of severe wind over 30 yrs
- 75.0%
Air-quality risk 5/10 · Moderate
- Unhealthy air days now
- 6 days/yr
- Unhealthy air days in 30 yrs
- 8 days/yr
Risk factors via First Street. Map © Google.
Why this score? — see what drove the D- grade
The composite is a weighted blend of 9 inputs, each scored 0–100. Each bar is that input's sub-score; the figure is the points it added to the 100-point composite (weight × sub-score).
- Cash flow +13.0/30.0
- Rent growth +5.0/5.0
- Schools +5.0/10.0
- DSCR +3.9/10.0
- Livability +3.8/5.0
- 1% rule +3.1/10.0
- Condition / age +2.5/5.0
- ARV discount +1.2/15.0
- Appreciation +0.0/10.0
$1,299,000
🖨 Deal sheet (PDF) 📄 Offer letter ✓ Due diligence
Multi-family units
County records classify this as Multi-Family (2-4 Unit). Listing-text estimate: 1 unit. estimate disagrees with records
Listing remarks
CAN BE DELIVERED VACANT! This exceptional all-brick, semi-detached multi-family split-level home is located in the desirable Georgetown area of Brooklyn, set on an oversized 30x150 lot. With a spacious 6½ over 6½ layout plus a separate 2-bedroom hospitality suite, the property offers incredible flexibility for multi-generational living or investment potential. Each apartment features three generously sized bedrooms, a large living room, formal dining room, and one and a half baths—perfect for comfortable everyday living and entertaining. The fully finished basement adds even more usable space, ideal for recreation. Outside, enjoy a spacious backyard oasis and private pa
Key facts
- Spacious backyard
- Private parking
- Oversized lot
Tags
Property features AI
Finance
- Other: Property type: Residential; Three-unit building (all units listed as leased); Utility expense listed (approx. $600)
- Financial info: Financing considered: bank mortgage, cash, exchange considered; Reported rent income: $69,600
Exterior
- Parking: Private drive; Parking area
- Utilities: 220V electric; Gas hot water; Hot water coil in boiler; Gas heating (baseboard)
- Home design: Semi-detached residential building; Flat roof; Poured concrete foundation; Building dimensions approximately 57.00 x 22.00; Building footprint about 1,254 sq ft; Zoning R3-2
- Construction: Brick exterior and construction; Flat roof; Poured concrete foundation; Built as a multi-unit (3 units)
- Exterior features: Front yard and back yard
Interior
- Kitchen: Oven/Range; Refrigerator; Dishwasher; Microwave
- Bedrooms: Two bedrooms on level 1; Three bedrooms on level 2; Three bedrooms on level 3
- Flooring: Hardwood floors
- Bathrooms: Three full bathrooms; Two half bathrooms; One bath on level 1; Two baths on level 2; Two baths on level 3
- Heating & cooling: Gas-fired heating with baseboard heat delivery; Hot water coil in boiler; 220V electric service; Wall and window A/C units (5+)
- Interior features: Wall and window A/C units (5+ units); Dishwasher; Microwave; Refrigerator; Stove / Oven/Range; Washer and Dryer; Garage door opener(s); Laundry area; Window treatments; Porch, terrace and patio/garden; Finished full basement; Hardwood floors; Other
- Laundry & utility: Washer and Dryer; Laundry area; Garage door opener(s)
Neighborhood map
What this means for you Summary
Snapshot
- This is a 8-bed/4.0-bath multifamily listed at $1.30M.
Deal economics
- At list price, monthly cash flow is $-76 ($-910/yr) — negative.
- To cash-flow at today's rent, offer at most $1.29M (1.0% below list).
- To meet the 1% rule (rent ≥ 1% of price), the offer needs to be $1.05M (19.1% below list).
- Recommended offer: $1.05M (19.1% below list) — sets the bar for 1% rule.
- Cap rate 6.2% vs local median 2.6% in New York — top-decile yield for the area; either an underpriced asset or a hidden risk that comps aren't pricing in. Stress-test before assuming the spread holds.
Location & tenants
- Location reads 75/100 on livability (#268 in NY, #4,188 nationally) — a middle-class / working-renter tenant base. Strengths: amenities A+, commute A+, health & safety A; Watch: crime F, cost of living F.
- Zoned schools: Elm Tree Elementary School (math 27% / reading 52%, grade F, #1,444 of 2,108 statewide, top 71%, 806 students, 94% FRL); Jhs 383 Philippa Schuyler (math 32% / reading 67%, grade C, #280 of 729 statewide, top 40%, 822 students, 85% FRL); Midwood High School (math 94% / reading 96%, grade A+, #83 of 1,100 statewide, top 8%, 4,062 students, 73% FRL).
- Market conditions: Rents rising fast (+16.2%/yr); 461 active listings in the ZIP; solid renter incomes; 10,063 units permitted in Kings County in 2024 (9,789 in 5+ unit buildings).
- At $10,506/mo this rent would consume 129% of the median local household income ($97k/yr) (locally 2384% of renters already pay >50% of income on rent) — very limited rent-growth headroom before tenants either downsize or default.
Forward outlook
- Local home prices are declining (-3.0%/yr); year-one equity from $9k of loan paydown is wiped out by about $39k of value loss. Plan a longer hold.
- Kings County population projected at +13% by 2050 — modest demand growth; plan on rents tracking national, not racing it.
Negotiation context
- It's been on market 18 days — a 2% lower offer ($1.28M) is reasonable based on typical stale-listing flexibility.
- Current owner paid $995k; 31% above their basis — modest negotiation headroom, anchor on the comps not their cost.
Risks & watch-outs
- Watch-outs: built in 1065 — expect roof / HVAC / electrical / plumbing capex.
- Climate carrying-cost: major wind risk, 75% chance of damaging wind over 30y; extreme-heat days projected 7→16/yr by 2055 (HVAC capex compounding) — expect insurance premiums to compound above CPI over the hold.
Questions for the listing agent
- What do current leases actually rent for vs. the listed asking? Can we see a recent rent roll and the last 12 months of T-12 income?
- Built in 1065 — when were the roof, HVAC, electrical panel, plumbing, and water heater last replaced?
- Is there a deadline driving the sale (1031 exchange, divorce, estate, relocation)? That informs how much negotiation room exists.
- Schools are B-rated — typically a magnet for longer-tenancy family renters. What's the average tenant stay here, and is there a school-zone premium baked into asking?
- Crime grade is F in this area — have there been break-ins, vandalism, or insurance claims at this property in the last 3 years? What carrier currently insures it and at what premium?
- The area grade is low — what's the realistic commute time and amenity access for the typical tenant pool here? Any planned neighborhood developments (good or bad) we should know about?
- What's the average days-on-market for RENTAL listings here right now (not sales)? A rising rental-DOM trend means longer vacancies and softer asking-rent achievability than the comps imply.
- What's the recent tenant-quality profile in this submarket — average credit score on applications, eviction rate, late-payment / NSF rate, and stable-employment percentage? A property-management company in the area should have these aggregated.
- How much new apartment / multifamily construction is in the pipeline within 1–3 miles? Heavy new supply (>2% of stock underway) typically softens rents 12–24 months out; light construction supports rent growth.
Investment metrics
- 1% rule
- 0.81% ✗
- Cap rate
- 6.22%
- Cash-on-cash
- -0.25%
- DSCR
- 0.99
- GRM
- 10.3
CMA / ARV
- ARV (on-the-fly)
- $1,139,840
- Comps found
- 3
Show comp detail 3 sales within ~0.75 mi
| Address | Dist | Beds/Ba | Sqft | Sold | Price | $/sf | Match |
|---|---|---|---|---|---|---|---|
| 1229 E 66th St | 0.10mi | 8/4.5 | 3,248 (-9%) | 2mo | $1,350,000 | $416 | 77 |
| 7224 Avenue M | 0.22mi | 8/5.0 | 3,870 (+9%) | 12mo | $1,240,000 | $320 | 62 |
| 1268 E 73rd St | 0.20mi | 7/4.0 (-1) | 3,265 (-8%) | 16mo | $1,040,000 | $319 | 59 |
Match score weights: distance 35% · size 25% · config 20% · recency 20%. Top-matched comps best support the ARV.
Projected returns pro-forma
-3.0% appreciation · 8.0% rent growth · sell at horizon
- IRR
- -11.6%
- Equity multiple
- 0.56×
- Total profit
- $-160,013
- Equity at exit
- $193,685
- IRR
- 3.3%
- Equity multiple
- 1.29×
- Total profit
- $106,289
- Equity at exit
- $112,314
Cash invested: $363,720 (down + closing). Projections, not guarantees.
Landlord ↔ Tenant lean methodology
- Overall (CITY)
- 0 Strongly Tenant-Friendly
- State New York
- 15 Strongly Tenant-Friendly · D+10
- County
- — inherits STATE
- City New York
- 0 Strongly Tenant-Friendly · D+34
ZIP-level market 11234
- Rents YoY
- 16.2%
- Active inventory
- 461
- Price-to-rent
- 30.9×
Monthly cashflow live
- Estimated rent
- $10,506 medium interval (Pro) →
- Mortgage (P&I)
- −$6,812
- Tax from tax record
- −$1,022 /mo · $12,267/yr
- Insurance
- −$541
- HOA
- −$0
- Vacancy / Maint / Mgmt
- −$2,206
- Net cashflow
- $-76
Break-even live
Sensitivity live
| Price | -10% $660 | -5% $292 | +0% $-76 | +5% $-444 | +10% $-811 |
|---|---|---|---|---|---|
| Rent | -10% $-906 | -5% $-491 | +0% $-76 | +5% $339 | +10% $754 |
| Rate | -1.0pp $578 | -0.5pp $255 | base $-76 | +0.5pp $-412 | +1.0pp $-755 |
3-unit breakdown (identical units grouped — click to expand)
| Units | Beds | Baths | Est. rent |
|---|---|---|---|
| 3× units | 3 | 1.5 | $10,506 |
| #1 | 3 | 1.5 | $3,502 |
| #2 | 3 | 1.5 | $3,502 |
| #3 | 3 | 1.5 | $3,502 |
| Total (3 units) | $10,506 | ||
UW: 25.0% down · 7.5% · 30yr · 1.5% tax · 5.0% vac · 8.0% maint · 8.0% mgmt
Financing live
Cash to close
- Down payment
- $324,750
- Closing costs
- $38,970
- Reserves months
- —
- Total cash needed
- —
Loan-product check · same deal, 3 products live
Conventional
25% down · 7.5% · 30yr
- Down + closing
- —
- Monthly P&I
- —
- Monthly cashflow
- —
- DSCR
- —
- Eligible?
- —
Personal DTI + credit; lowest rate.
DSCR
20% down · 8.5% · 30yr
- Down + closing
- —
- Monthly P&I
- —
- Monthly cashflow
- —
- DSCR
- —
- Eligible?
- —
No personal income docs; deal must DSCR.
Hard money
10% down · 12.0% · 12mo
- Down + closing
- —
- Monthly P&I
- —
- Monthly cashflow
- —
- DSCR
- —
- Eligible?
- —
Short-term bridge; refi at stabilization.
Listing history 6 events
-
2026-05-31days on market $1,299,000 Active 18 DOM
-
2026-05-13$1,299,000 Active
-
2026-01-08price $1,299,000
-
2024-02-14soldstatus $995,000
-
1994-03-29soldstatus $330,000
-
1993-06-11soldstatus $265,000
ⓘ Source: listings_history table (triggers on properties + properties_extension) + one-shot
backfill from property_details.listing_events for pre-trigger history.
Tax reassessment forecast NY · Partial reset (capped growth)
- Current annual tax
- $12,267 · $1,022/mo
- Projected year-2 tax
- $17,110 · $1,426/mo
- Expected delta
- +$4,843/yr (+$404/mo · 39.5%)
ⓘ Screening estimate from a state-policy table — verify with the county assessor before closing.
Climate risk First Street
- Flood 1/10 Low FEMA zone X (unshaded) · 0% chance over 30 yrs
- Wildfire 2/10 Low
- Heat 7/10 Severe 7 d/yr ≥97°F today · 16 d/yr by 30 yrs out
- Wind 6/10 Major 75% chance of damaging wind over 30 yrs
- Air quality 5/10 Major 6 unhealthy d/yr today · 8 by 30 yrs out
Nearby sold comps map
Loading sold comps map…
Walkable amenities ~0.75 mi
Loading nearby amenities…
Taxation est. · year 1
- Rental income
- $126,072
- − Mortgage interest
- −$72,764
- − Property taxes
- −$12,267
- − Insurance
- −$6,495
- − Repairs & maintenance
- −$10,086
- − Management
- −$10,086
- − Depreciation
- −$37,789
- Taxable loss
- −$23,415
- Est. tax savings @ 24.0%
- +$5,619
- After-tax cash flow
- $4,709/yr
For passive investors: Depreciation is non-cash, so a rental often shows a tax loss while cash-flowing — sheltering income. Rental losses are passive: they offset passive income freely, and up to $25,000/yr can offset ordinary (W-2) income if you actively participate and your MAGI is under $100k (phasing out to $0 by $150k); unused losses carry forward. On sale, claimed depreciation is recaptured at up to 25%, and gains may owe capital-gains tax (a 1031 exchange can defer both). Figures are a year-1 estimate at your 24.0% rate — not tax advice; consult a CPA.
Schools (NCES district)
No district data.
Livability — New York
- Score
- 75/100
- State rank
- #268
- US rank
- #4188
Category grades
Schools grade is shown separately in the Schools card above.
Census & demographics
- Census place
- New York, NY
- County
- Kings County · 2,614,986 people
- City population
- 7,731,280
- Metro
- New York-Newark-Jersey City, NY-NJ-PA
- Population (ZIP)
- 83,187
- Household income
- $97,479
- Rent vs Own
- Severe rent burden
- 2384.0
Population outlook (Kings County) Hauer SSP2
- Today (2025)
- 2,847,441 people
- By 2030
- 2,937,006 · +3.1%
- By 2040
- 3,095,491 · +8.7%
- By 2050
- 3,228,968 · +13.4%
- By 2075
- 3,321,723 · +16.7%
- By 2100
- 3,111,387 · +9.3%
Race, ethnicity, and origin ACS 2023
- Neighborhood character
- Diverse neighborhood (Simpson 0.69)
- Race & ethnicity
- Black 42% White 35% Hispanic / Latino 10% Asian 8% Two or more races 7%
- Hispanic origin (detail)
- Mexican 1% Puerto Rican 4%
- Common ancestry
- Hispanic 8% Scotch-Irish 3% Romanian 2%
- Foreign-born
- 35% · Canada, China, Mexico
- Languages at home
- 65% English-only · French/Haitian/Cajun 9% Spanish 7% Russian/Polish/Slavic 6%
Political lean MEDSL · Kings
- 2024 margin
- Solid D (+44.0) · D 72.0% · R 28.0%
- 2008→2024 swing
- -15.5pp toward R · 2008: 59.4pp · 2024: 44.0pp
- All cycles
- 2024: D+44.0 2020: D+54.8 2016: D+61.8 2012: D+63.9 2008: D+59.4
Not yet ingested
- Civics
- —
Market trends
- HPI YoY
- ▼ -667.47%
- Current HPI
- 318.0416
- Rent YoY
- ▲ 16.21%
- Metro
- New York-Newark-Jersey City, NY-NJ-PA
- State GDP YoY
- ▲ 2.60%
- F500 in state
- 92
Industry mix (Fortune 500 HQ in NY)
| Industry | F500 HQs | Revenue |
|---|---|---|
| Financial Services | 10 | $950B |
|
||
| Consumer Goods | 9 | $162B |
|
||
| Insurance | 4 | $225B |
|
||
| Telecommunications | 2 | $144B |
|
||
| Pharmaceuticals | 2 | $112B |
|
||
| Media / Entertainment | 2 | $69B |
|
||
Price history
+390.2% since first listed5 events — show timeline
- 2026-05-13 Listed $1,299,000 BNYMLS
- 2026-01-08 Price Changed $1,299,000 BNYMLS
- 2024-02-14 Sold (Public Records) $995,000 Public Records
- 1994-03-29 Sold (Public Records) $330,000 Public Records
- 1993-06-11 Sold (Public Records) $265,000 Public Records
Property tax history
+5.0%/yrLatest (2025): $12,267 · +3.4% YoY. Source: county tax records.
Cash-flow waterfall
monthlySold comps — $/sqft
last 12 mo · ≤1 miLoading sold comps…