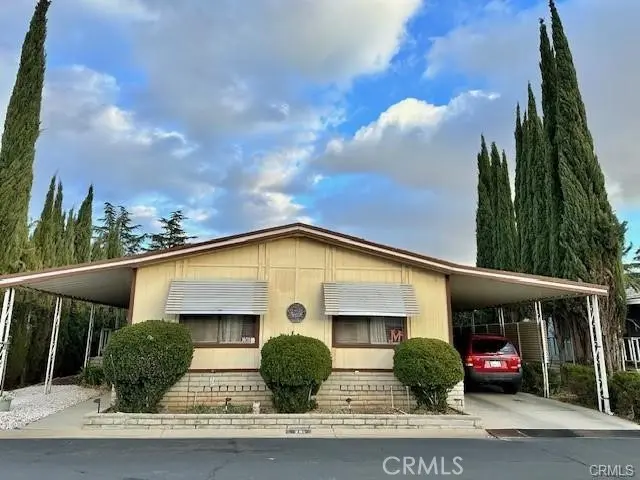
5700 W Wilson St #25 · Banning, CA
Flood risk 1/10 · Minimal
- FEMA flood zone
- X (unshaded)
- Chance of flooding over 30 yrs
- 0.0%
- Est. flood insurance / yr
- $507 – $1,088
Fire risk 10/10 · Severe
- Est. fire insurance / yr
- $659 – $1,223
Heat risk 6/10 · Moderate
- Hot days now (above 101°F)
- 6 days/yr
- Hot days in 30 yrs
- 16 days/yr
Wind risk 1/10 · Minimal
- Chance of severe wind over 30 yrs
- —
Air-quality risk 8/10 · Major
- Unhealthy air days now
- 18 days/yr
- Unhealthy air days in 30 yrs
- 23 days/yr
Risk factors via First Street. Map © Google.
Why this score? — see what drove the B grade
The composite is a weighted blend of 9 inputs, each scored 0–100. Each bar is that input's sub-score; the figure is the points it added to the 100-point composite (weight × sub-score).
- Cash flow +30.0/30.0
- ARV discount +10.2/15.0
- 1% rule +10.0/10.0
- DSCR +10.0/10.0
- Schools +4.0/10.0
- Rent growth +3.4/5.0
- Condition / age +2.5/5.0
- Livability +2.4/5.0
- Appreciation +0.0/10.0
$119,000
🖨 Deal sheet (PDF) 📄 Offer letter ✓ Due diligence
Listing remarks MLS
LOCATED in a FAMILY PARK- PRICE IMPROVEMENT Back on the market after $17,000 worth of upgrades. NEW vinyl flooring, New painted kitchen cabinets, newly painted bathrooms and vanities, BRAND NEW water Heater, NEW thermostat and much more. Welcome home to your beautiful mobile home located in a quiet and very well-maintained community FAMILY PARK. Open floor plan with lots of natural light. This home features 2 extra-large bedrooms with a large walk-in closet in the master, and 2 full bathrooms. The laundry room has storage and washer and dryer are included. The kitchen opens up to the dining room and then to the living room. The home also features a carport with enough space for 3 cars. This lot is the only lot in the park with a large back yard and French doors that lead out to a beautiful wood deck the overlooks the snowcapped mountains where you can enjoy your morning coffee and watch the sunrise. The yard has a very mature and high producing lemon and apricot tree. The home has newer carpet, upgraded A/C unit in 2020, and new ducting replaced in 2021. This family friendly park has a swimming pool, hot tub, sauna, dog park, club house, pickle ball courts, shuffleboard, fire pit, and picnic area. Location is perfect for day trips to Oak Glen, Big Bear, Palm Springs, and Cabazon. Property is being sold AS-IS. Space rent is Approx. $1050 Water is included in space rent. Seller and seller's agent do not warrant any information. Buyers and Buyer's agent to do their own due diligence regarding all aspects of the property
Key facts
- Upgrades
- Vinyl flooring
- Thermostat
Tags
Neighborhood map
What this means for you Summary
Snapshot
- This is a 2-bed/2.0-bath manufactured listed at $119k.
Deal economics
- At list price, monthly cash flow is $862 ($10k/yr) — positive.
- The deal already cash-flows at list — no discount required.
- Meets the 1% rule at list price ($2k rent vs $119k).
- Recommended offer: $105k (12.0% below list) — sets the bar for market timing.
- Cap rate 15.0% vs local median 3.0% in Banning — top-decile yield for the area; either an underpriced asset or a hidden risk that comps aren't pricing in. Stress-test before assuming the spread holds.
Location & tenants
- Location reads 48/100 on livability (#1,192 in CA) — a working-class tenant base; expect higher turnover. Strengths: housing B+; Watch: crime C-, amenities F, commute F.
- Beaumont Unified (suburban): math 32% / reading 60% proficiency, ranked #168 of 517 in CA (top 32%) — families likely to look elsewhere, expect single-tenant / working-renter base with shorter leases.
- Zoned schools: Sundance Elementary (734 students, 68% FRL); San Gorgonio Middle (1,215 students, 67% FRL); Beaumont Senior High (math 36% / reading 63%, grade D, #352 of 1,170 statewide, top 31%, 3,328 students, 62% FRL) — zoned schools average 66% FRL vs 45% district-wide (20 pts higher); higher-poverty schools than district average — tighter screening recommended.
- Market conditions: Rents rising (+3.6%/yr); 318 active listings in the ZIP; 9 comparable units currently listed for rent nearby; rentals at typical pace (median 17d on market — plan ~3-4 weeks tenant-placement turnaround); 9,195 units permitted in Riverside County in 2024 (1,512 in 5+ unit buildings).
- This rent runs 38% of the median local income ($63k/yr) — at the standard rent-burdened threshold; future hikes will face affordability resistance.
Forward outlook
- Local home prices are declining (-3.0%/yr); year-one equity from $823 of loan paydown is wiped out by about $4k of value loss. Plan a longer hold.
- Riverside County population projected at +22% by 2050 — long-run rental-demand tailwind backs the buy-and-hold thesis.
- At projected returns (-3.0% appreciation + 3.6% rent growth), your $33k cash investment doubles in ~4 years — after that, you're playing with house money.
Negotiation context
- It's been on market 131 days — a 12% lower offer ($105k) is reasonable based on typical stale-listing flexibility.
- 8 sale attempts since 24y ago with the ask held roughly flat each time — persistent listings suggest the price (not the market) is what's stuck; bring a comps-based counter.
- Current owner paid $28k; list at $119k implies a 318% gain — meaningful room to come down on a strong offer.
Risks & watch-outs
- Climate carrying-cost: severe wildfire risk; extreme-heat days projected 6→16/yr by 2055 (HVAC capex compounding) — expect insurance premiums to compound above CPI over the hold.
Questions for the listing agent
- It's been on market 131 days. Have you received any prior offers? Is the seller open to a 12% concession, seller financing, or rate buy-down credit?
- Why hasn't it sold? Are there any deal-killer items the seller is aware of (foundation, flood, title, zoning, code violations)?
- Is there a deadline driving the sale (1031 exchange, divorce, estate, relocation)? That informs how much negotiation room exists.
- Schools are F-rated, which usually means shorter tenancies and higher turnover. Who's the typical renter profile here, and what's been the actual vacancy rate?
- What's the average days-on-market for RENTAL listings here right now (not sales)? A rising rental-DOM trend means longer vacancies and softer asking-rent achievability than the comps imply.
- What's the recent tenant-quality profile in this submarket — average credit score on applications, eviction rate, late-payment / NSF rate, and stable-employment percentage? A property-management company in the area should have these aggregated.
- How much new for-sale + rental construction is in the pipeline within 1–3 miles? Heavy new supply typically softens prices + rents 12–24 months out; constrained supply supports both.
Investment metrics
- 1% rule
- 1.67% ✓
- Cap rate
- 14.99%
- Cash-on-cash
- 31.06%
- DSCR
- 2.38
- GRM
- 5.0
CMA / ARV
- ARV (median comp)
- $126,529
- List price
- $119,000
- Delta
- -5.95%
- Verdict
- FAIR
- Comps
- 4 within 1.0 mi
Show comp detail 7 sales within ~0.75 mi
| Address | Dist | Beds/Ba | Sqft | Sold | Price | $/sf | Match |
|---|---|---|---|---|---|---|---|
| 5700 W Wilson St #29 | 0.00mi | 3/2.0 (+1) | 1,152 (+4%) | 11mo | $124,000 | $108 | 78 |
| 5700 W Wilson St #128 | 0.00mi | 2/2.0 | 1,248 (+13%) | 12mo | $132,500 | $106 | 68 |
| 5700 W Wilson St #117 | 0.00mi | 2/2.0 | 1,248 (+13%) | 13mo | $129,000 | $103 | 67 |
| 5700 W WILSON St #64 | 0.00mi | 2/2.0 | 1,248 (+13%) | 21mo | $135,000 | $108 | 60 |
| 5700 W Wilson St #19 | 0.10mi | 3/2.0 (+1) | 1,248 (+13%) | 12mo | $131,500 | $105 | 59 |
| 5700 W WILSON St #65 | 0.10mi | 2/2.0 | 1,248 (+13%) | 22mo | $115,000 | $92 | 55 |
| 5700 W WILSON St #110 | 0.05mi | 3/2.0 (+1) | 1,248 (+13%) | 23mo | $135,000 | $108 | 52 |
Match score weights: distance 35% · size 25% · config 20% · recency 20%. Top-matched comps best support the ARV.
Projected returns pro-forma
-3.0% appreciation · 3.58% rent growth · sell at horizon
- IRR
- 26.4%
- Equity multiple
- 2.10×
- Total profit
- $36,768
- Equity at exit
- $17,743
- IRR
- 34.4%
- Equity multiple
- 4.22×
- Total profit
- $107,405
- Equity at exit
- $10,289
Cash invested: $33,320 (down + closing). Projections, not guarantees.
Landlord ↔ Tenant lean methodology
- Overall (STATE)
- 18 Strongly Tenant-Friendly
- State California
- 18 Strongly Tenant-Friendly · D+13
- County
- — inherits STATE
- City
- — inherits STATE
ZIP-level market 92220
- Rents YoY
- 3.6%
- Active inventory
- 318
- Price-to-rent
- 5.0×
Monthly cashflow live
- Estimated rent
- $1,982 high interval (Pro) →
- Mortgage (P&I)
- −$624
- Tax from tax record
- −$30 /mo · $358/yr
- Insurance
- −$50
- HOA
- −$0
- Vacancy / Maint / Mgmt
- −$416
- Net cashflow
- $862
Break-even live
Sensitivity live
| Price | -10% $930 | -5% $896 | +0% $862 | +5% $829 | +10% $795 |
|---|---|---|---|---|---|
| Rent | -10% $706 | -5% $784 | +0% $862 | +5% $941 | +10% $1,019 |
| Rate | -1.0pp $922 | -0.5pp $893 | base $862 | +0.5pp $832 | +1.0pp $800 |
UW: 25.0% down · 7.5% · 30yr · 1.5% tax · 5.0% vac · 8.0% maint · 8.0% mgmt
Financing live
Cash to close
- Down payment
- $29,750
- Closing costs
- $3,570
- Reserves months
- —
- Total cash needed
- —
Loan-product check · same deal, 3 products live
Conventional
25% down · 7.5% · 30yr
- Down + closing
- —
- Monthly P&I
- —
- Monthly cashflow
- —
- DSCR
- —
- Eligible?
- —
Personal DTI + credit; lowest rate.
DSCR
20% down · 8.5% · 30yr
- Down + closing
- —
- Monthly P&I
- —
- Monthly cashflow
- —
- DSCR
- —
- Eligible?
- —
No personal income docs; deal must DSCR.
Hard money
10% down · 12.0% · 12mo
- Down + closing
- —
- Monthly P&I
- —
- Monthly cashflow
- —
- DSCR
- —
- Eligible?
- —
Short-term bridge; refi at stabilization.
Rent comps 9 comps
| Address | Beds | Baths | Sqft | Rent | $/sqft | DOM | Units | Dist |
|---|---|---|---|---|---|---|---|---|
| 5464 Evelyn Dr Banning, CA | 2.0 | 1.0 | 851 | $1,900 | $2.23 | 17d | 1 | 0.21mi |
| 5464 Evelyn Dr Banning, CA | 2.0 | 1.0 | 851 | $1,900 | $2.23 | 45d | 1 | 0.21mi |
| 228 Janan Ct Banning, CA | 2.0 | 1.0 | 1100 | $2,100 | $1.91 | 0d | 1 | 0.25mi |
| 5001 W Wilson St Unit 103 Banning, CA | 1.0 | 1.0 | 751 | $1,600 | $2.13 | 0d | 1 | 0.50mi |
| 5001 W Wilson St Unit 227 Banning, CA | 2.0 | 1.0 | 833 | $1,700 | $2.04 | 4d | 1 | 0.50mi |
| 5891 Riviera Ave Banning, CA | 2.0 | 3.0 | 1456 | $2,350 | $1.61 | 45d | 1 | 0.71mi |
| 3911 W Ramsey St Unit 204 Banning, CA | 2.0 | 1.0 | 800 | $1,650 | $2.06 | 7d | 1 | 1.21mi |
| 3880 W Jacinto View Rd Unit A Banning, CA | 2.0 | 2.0 | 780 | $1,395 | $1.79 | 26d | 1 | 1.23mi |
| 1378 Snead St Banning, CA | 2.0 | 2.0 | 1150 | $2,200 | $1.91 | 17d | 1 | 1.24mi |
Listing history 43 events
-
2026-06-21days on market $119,000 Active 131 DOM
-
2026-06-18days on market $119,000 Active 128 DOM
-
2026-06-17days on market $119,000 Active 127 DOM
-
2026-06-16days on market $119,000 Active 126 DOM
-
2026-06-15days on market $119,000 Active 125 DOM
-
2026-06-13days on market $119,000 Active 123 DOM
-
2026-06-13days on market $119,000 Active 122 DOM
-
2026-06-09days on market $119,000 Active 119 DOM
-
2026-06-08days on market $119,000 Active 118 DOM
-
2026-06-07days on market $119,000 Active 117 DOM
-
2026-06-04days on market $119,000 Active 114 DOM
-
2026-06-03days on market $119,000 Active 113 DOM
-
2026-06-02days on market $119,000 Active 112 DOM
-
2026-06-01days on market $119,000 Active 111 DOM
-
2026-05-31days on market $119,000 Active 110 DOM
-
2026-02-10$119,000 Active 1543-char remark
Show marketing remark (1543 chars)
LOCATED in a FAMILY PARK- PRICE IMPROVEMENT Back on the market after $17,000 worth of upgrades. NEW vinyl flooring, New painted kitchen cabinets, newly painted bathrooms and vanities, BRAND NEW water Heater, NEW thermostat and much more. Welcome home to your beautiful mobile home located in a quiet and very well-maintained community FAMILY PARK. Open floor plan with lots of natural light. This home features 2 extra-large bedrooms with a large walk-in closet in the master, and 2 full bathrooms. The laundry room has storage and washer and dryer are included. The kitchen opens up to the dining room and then to the living room. The home also features a carport with enough space for 3 cars. This lot is the only lot in the park with a large back yard and French doors that lead out to a beautiful wood deck the overlooks the snowcapped mountains where you can enjoy your morning coffee and watch the sunrise. The yard has a very mature and high producing lemon and apricot tree. The home has newer carpet, upgraded A/C unit in 2020, and new ducting replaced in 2021. This family friendly park has a swimming pool, hot tub, sauna, dog park, club house, pickle ball courts, shuffleboard, fire pit, and picnic area. Location is perfect for day trips to Oak Glen, Big Bear, Palm Springs, and Cabazon. Property is being sold AS-IS. Space rent is Approx. $1050 Water is included in space rent. Seller and seller's agent do not warrant any information. Buyers and Buyer's agent to do their own due diligence regarding all aspects of the property
-
2026-01-21historical
-
2025-10-25price $119,900
-
2025-10-16price $125,000
-
2025-09-06price $126,000
-
2025-08-10price $128,000
-
2025-05-24price $129,900
-
2025-04-15price $136,000
-
2025-02-25price $138,000
-
2025-02-08$139,000 Active
-
2025-01-27historical
-
2025-01-09historical
-
2024-12-01status Active
-
2024-10-02price $140,000
-
2024-03-05price $129,900
-
2024-01-10$135,000 Active
-
2022-04-21historical
-
2022-04-15historical Active Under Contract
-
2022-03-22$92,000 Active
-
2017-04-17soldstatus $28,500 Closed Sale
-
2017-03-24status Pending Sale
-
2017-03-17price $28,500
-
2017-02-08price $34,500
-
2017-01-11$29,000 Active
-
2003-01-21historical
-
2003-01-21historical
-
2002-09-04$20,000
-
2002-08-16$20,000
ⓘ Source: listings_history table (triggers on properties + properties_extension) + one-shot
backfill from property_details.listing_events for pre-trigger history.
Tax reassessment forecast CA · Resets to sale price
- Current annual tax
- $358 · $30/mo
- Projected year-2 tax
- $904 · $75/mo
- Expected delta
- +$546/yr (+$46/mo · 152.3%)
ⓘ Screening estimate from a state-policy table — verify with the county assessor before closing.
Climate risk First Street
- Flood 1/10 Low FEMA zone X (unshaded) · 0% chance over 30 yrs
- Wildfire 10/10 Extreme
- Heat 6/10 Major 6 d/yr ≥101°F today · 16 d/yr by 30 yrs out
- Wind 1/10 Low
- Air quality 8/10 Severe 18 unhealthy d/yr today · 23 by 30 yrs out
Nearby sold comps map
Loading sold comps map…
Walkable amenities ~0.75 mi
Loading nearby amenities…
Taxation est. · year 1
- Rental income
- $23,787
- − Mortgage interest
- −$6,666
- − Property taxes
- −$358
- − Insurance
- −$595
- − Repairs & maintenance
- −$1,903
- − Management
- −$1,903
- − Depreciation
- −$3,462
- Taxable income
- $8,900
- Est. tax owed @ 24.0%
- −$2,136
- After-tax cash flow
- $8,214/yr
For passive investors: Depreciation is non-cash, so a rental often shows a tax loss while cash-flowing — sheltering income. Rental losses are passive: they offset passive income freely, and up to $25,000/yr can offset ordinary (W-2) income if you actively participate and your MAGI is under $100k (phasing out to $0 by $150k); unused losses carry forward. On sale, claimed depreciation is recaptured at up to 25%, and gains may owe capital-gains tax (a 1031 exchange can defer both). Figures are a year-1 estimate at your 24.0% rate — not tax advice; consult a CPA.
Schools (NCES district)
- District
- Beaumont Unified
- NCES district ID
- 0604290
- Math proficiency
- 32% ▼ -4.00%
- Reading proficiency
- 60% ▲ 11.00%
- Median HH income
- $60,635
- Composite
- 40.37/100
- National rank
- #3736
- State rank
- #168 of 517 in CA
Livability — Banning
- Score
- 48/100
- State rank
- #1192
- US rank
- #26047
Category grades
Schools grade is shown separately in the Schools card above.
Census & demographics
- Census place
- Banning, CA
- County
- Riverside County · 2,287,001 people
- City population
- 33,755
- Metro
- Riverside-San Bernardino-Ontario, CA
- Population (ZIP)
- 33,755
- Household income
- $62,599
- Rent vs Own
- Severe rent burden
- 1146.0
Population outlook (Riverside County) Hauer SSP2
- Today (2025)
- 2,664,475 people
- By 2030
- 2,802,692 · +5.2%
- By 2040
- 3,050,904 · +14.5%
- By 2050
- 3,256,783 · +22.2%
- By 2075
- 3,655,058 · +37.2%
- By 2100
- 3,766,594 · +41.4%
Race, ethnicity, and origin ACS 2023
- Neighborhood character
- Diverse neighborhood (Simpson 0.64)
- Race & ethnicity
- Hispanic / Latino 48% White 35% Two or more races 21% Black 6% Asian 5% Native American 4%
- Hispanic origin (detail)
- Mexican 44%
- Common ancestry
- Italian 1% Romanian 1% Portuguese 1%
- Foreign-born
- 17% · Canada, South Korea, China
- Languages at home
- 65% English-only · Spanish 29% Tagalog/Filipino 1% Other Indo-European 1%
Political lean MEDSL · Riverside
- 2024 margin
- Toss-up / Even · D 48.0% · R 49.3% · Other 2.6%
- 2008→2024 swing
- -3.6pp toward R · 2008: 2.3pp · 2024: -1.3pp
- All cycles
- 2024: R+1.3 2020: D+8.0 2016: D+4.3 2012: R+0.4 2008: D+2.3
Not yet ingested
- Civics
- —
Market trends
- HPI YoY
- ▼ -343.32%
- Current HPI
- 342.4268
- Rent YoY
- ▲ 3.58%
- Metro
- Riverside-San Bernardino-Ontario, CA
- State GDP YoY
- ▲ 3.21%
- F500 in state
- 116
Industry mix (Fortune 500 HQ in CA)
| Industry | F500 HQs | Revenue |
|---|---|---|
| Technology | 27 | $1,492B |
|
||
| Financial Services | 3 | $174B |
|
||
| Retail | 3 | $44B |
|
||
| Insurance | 3 | $26B |
|
||
| Media / Entertainment | 2 | $115B |
|
||
| Pharmaceuticals / Biotech | 2 | $62B |
|
||
Price history
+495.0% since first listed28 events — show timeline
- 2026-02-10 Listed $119,000 CRMLS
- 2026-01-21 Listing Removed — CRMLS
- 2025-10-25 Price Changed $119,900 CRMLS
- 2025-10-16 Price Changed $125,000 CRMLS
- 2025-09-06 Price Changed $126,000 CRMLS
- 2025-08-10 Price Changed $128,000 CRMLS
- 2025-05-24 Price Changed $129,900 CRMLS
- 2025-04-15 Price Changed $136,000 CRMLS
- 2025-02-25 Price Changed $138,000 CRMLS
- 2025-02-08 Listed $139,000 CRMLS
- 2025-01-27 Coming Soon — CRMLS
- 2025-01-09 Listing Removed — CRMLS
- 2024-12-01 Relisted — CRMLS
- 2024-10-02 Price Changed $140,000 CRMLS
- 2024-03-05 Price Changed $129,900 CRMLS
- 2024-01-10 Listed $135,000 CRMLS
- 2022-04-21 Listing Removed — CRMLS
- 2022-04-15 Contingent — CRMLS
- 2022-03-22 Listed $92,000 CRMLS
- 2017-04-17 Sold (MLS) $28,500 CRMLS
- 2017-03-24 Pending — CRMLS
- 2017-03-17 Price Changed $28,500 CRMLS
- 2017-02-08 Price Changed $34,500 CRMLS
- 2017-01-11 Listed $29,000 CRMLS
- 2003-01-21 Listing Removed — CRMLS
- 2003-01-21 Listing Removed — CRMLS
- 2002-09-04 Listed $20,000 CRMLS
- 2002-08-16 Listed $20,000 CRMLS
Property tax history
+1.6%/yrLatest (2025): $358 · -75.3% YoY. Source: county tax records.
Cash-flow waterfall
monthlySold comps — $/sqft
last 12 mo · ≤1 miLoading sold comps…