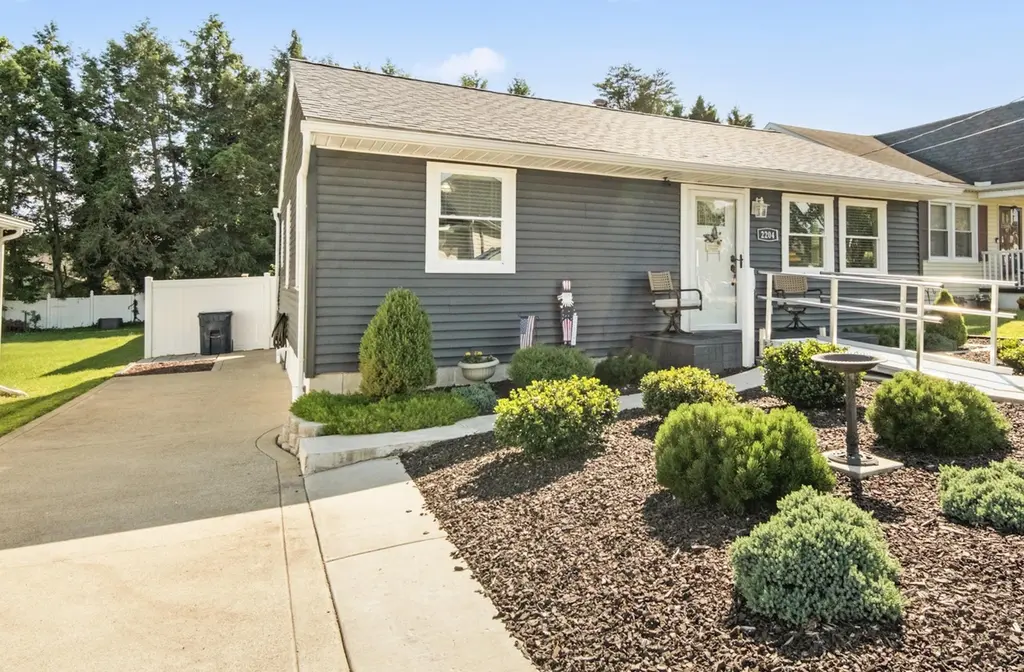
2204 Harrod St · Ashland, KY
Flood risk 1/10 · Minimal
- FEMA flood zone
- X (unshaded)
- Chance of flooding over 30 yrs
- 0.0%
- Est. flood insurance / yr
- $507 – $1,088
Fire risk 1/10 · Minimal
- Est. fire insurance / yr
- $839 – $1,559
Heat risk 5/10 · Moderate
- Hot days now (above 102°F)
- 7 days/yr
- Hot days in 30 yrs
- 20 days/yr
Wind risk 2/10 · Minimal
- Chance of severe wind over 30 yrs
- 2.0%
Air-quality risk 2/10 · Minimal
- Unhealthy air days now
- 0 days/yr
- Unhealthy air days in 30 yrs
- 2 days/yr
Risk factors via First Street. Map © Google.
Why this score? — see what drove the F grade
The composite is a weighted blend of 9 inputs, each scored 0–100. Each bar is that input's sub-score; the figure is the points it added to the 100-point composite (weight × sub-score).
- Cash flow +8.5/30.0
- Appreciation +7.0/10.0
- Schools +3.2/10.0
- Livability +3.2/5.0
- ARV discount +3.0/15.0
- Rent growth +2.5/5.0
- Condition / age +2.5/5.0
- DSCR +2.3/10.0
- 1% rule +1.3/10.0
$174,500
🖨 Deal sheet 📄 Offer letter ✓ Due diligence
Listing remarks MLS
Whether you're starting out or slowing down, you won't want to miss this 1-floor plan retirement friendly ranch home offering 3 BR's, 2 Baths! Located in the heart of S. Ashland just minutes away from Hager Elementary you'll find this 1340sqft home that has original hardwood floors in some of the home. The Kitchen comes fully equipped with all appliances and has lots of cabinetry and countertop space. Step out the back door into the covered patio that overlooks the flat fenced in backyard where the kiddos and family pets can hang out. There's a 'she-shed' in the backyard too great for storage.
Key facts
- One floor plan
- Updated kitchen
- Conveniently located
Tags
Property features AI
Exterior
- Parking: No designated parking
- Utilities: Public water; Public sewer
- Home design: Single-family residence; Residential property
- Construction: Vinyl siding; Composition roof; Crawl space foundation; Built area above grade: 1,340
- Exterior features: Patio; Front porch; Fenced yard; Shed(s)
Interior
- Kitchen: Gas range; Refrigerator
- Bedrooms: Master suite on the downstairs/main level
- Bathrooms: 2 full bathrooms
- Heating & cooling: Forced air heating; Central air conditioning
- Interior features: Master bedroom located on the main level; Gas log fireplace
- Laundry & utility: Electric water heater
Neighborhood map
What this means for you Summary
Snapshot
- This is a 2-bed/1.0-bath single-family listed at $174k.
Deal economics
- At list price, monthly cash flow is $-153 ($-2k/yr) — negative.
- To cash-flow at today's rent, offer at most $147k (15.5% below list).
- To meet the 1% rule (rent ≥ 1% of price), the offer needs to be $110k (36.7% below list).
- Recommended offer: $110k (36.7% below list) — sets the bar for 1% rule.
Location & tenants
- Location reads 64/100 on livability (#304 in KY) — a middle-class / working-renter tenant base. Strengths: cost of living A+, housing A+; Watch: schools C-, amenities F, commute F.
- Ashland Independent (urban): math 32% / reading 44% proficiency, ranked #49 of 165 in KY (top 30%) — families likely to look elsewhere, expect single-tenant / working-renter base with shorter leases.
- Market conditions: 65 active listings in the ZIP; 2 units permitted in Boyd County in 2024 (0 in 5+ unit buildings).
Forward outlook
- In year one you build about $8k of equity ($1k loan paydown + $7k appreciation (4.0% local appreciation)).
- Boyd County population projected at -17% by 2050 — secular population decline; favor cash flow + early exit over multi-decade hold.
- By year 5, paydown + projected appreciation supports a ~$35k cash-out refi (75% LTV) — recoverable capital for the next deal without selling this one.
Negotiation context
- Only 10 days on market — expect competitive offers; lowballing is unlikely to land.
- 2 sale attempts since 5y ago with the ask held roughly flat each time — persistent listings suggest the price (not the market) is what's stuck; bring a comps-based counter.
- Current owner paid $120k; 46% above their basis — modest negotiation headroom, anchor on the comps not their cost.
Risks & watch-outs
- Watch-outs: built in 1956 — expect roof / HVAC / electrical / plumbing capex.
- Climate carrying-cost: extreme-heat days projected 7→20/yr by 2055 (HVAC capex compounding) — expect insurance premiums to compound above CPI over the hold.
Questions for the listing agent
- What do current leases actually rent for vs. the listed asking? Can we see a recent rent roll and the last 12 months of T-12 income?
- Built in 1956 — when were the roof, HVAC, electrical panel, plumbing, and water heater last replaced?
- Is there a deadline driving the sale (1031 exchange, divorce, estate, relocation)? That informs how much negotiation room exists.
- The area grade is low — what's the realistic commute time and amenity access for the typical tenant pool here? Any planned neighborhood developments (good or bad) we should know about?
- What's the average days-on-market for RENTAL listings here right now (not sales)? A rising rental-DOM trend means longer vacancies and softer asking-rent achievability than the comps imply.
- What's the recent tenant-quality profile in this submarket — average credit score on applications, eviction rate, late-payment / NSF rate, and stable-employment percentage? A property-management company in the area should have these aggregated.
- How much new for-sale + rental construction is in the pipeline within 1–3 miles? Heavy new supply typically softens prices + rents 12–24 months out; constrained supply supports both.
Investment metrics
- 1% rule
- 0.63% ✗
- Cap rate
- 5.24%
- Cash-on-cash
- -3.76%
- DSCR
- 0.83
- GRM
- 13.2
CMA / ARV
- ARV (on-the-fly)
- $158,688
- Comps found
- 12
Show comp detail 12 sales within ~0.75 mi
| Address | Dist | Beds/Ba | Sqft | Sold | Price | $/sf | Match |
|---|---|---|---|---|---|---|---|
| 1641 Lawrence Ave | 0.16mi | 3/1.0 (+1) | 1,354 (-1%) | 1mo | $159,000 | $117 | 85 |
| 904 Blackburn Ave | 0.56mi | 2/1.0 | 1,340 (-2%) | 2mo | $90,000 | $67 | 69 |
| 1400 Maxwell Street St | 0.36mi | 3/1.5 (+1) | 1,491 (+9%) | 1mo | $145,000 | $97 | 61 |
| 2128 Mantz St | 0.22mi | 3/1.5 (+1) | 1,176 (-14%) | 3mo | $85,575 | $73 | 57 |
| 2309 Sellars St | 0.42mi | 3/2.0 (+1) | 1,273 (-7%) | 5mo | $168,000 | $132 | 55 |
| 1429 May St | 0.42mi | 3/1.5 (+1) | 1,220 (-11%) | 2mo | $70,000 | $57 | 53 |
| 2204 Broad St | 0.50mi | 3/1.0 (+1) | 1,226 (-10%) | 2mo | $78,144 | $64 | 53 |
| 2610 S 29th St. St | 0.50mi | 2/1.5 | 1,208 (-12%) | 7mo | $140,000 | $116 | 49 |
| 2433 Moore Street St | 0.74mi | 2/2.0 | 1,468 (+7%) | 3mo | $180,000 | $123 | 47 |
| 2616 Monroe St | 0.56mi | 2/2.0 | 1,200 (-12%) | 5mo | $81,500 | $68 | 46 |
| 1215 Turner St | 0.60mi | 3/1.0 (+1) | 1,170 (-14%) | 0mo | $138,000 | $118 | 42 |
| 2701 Iroquois Avenue Ave | 0.61mi | 3/2.5 (+1) | 1,567 (+14%) | 1mo | $182,500 | $116 | 36 |
Match score weights: distance 35% · size 25% · config 20% · recency 20%. Top-matched comps best support the ARV.
Projected returns pro-forma
3.98% appreciation · 3.0% rent growth · sell at horizon
- IRR
- 6.9%
- Equity multiple
- 1.42×
- Total profit
- $20,397
- Equity at exit
- $88,271
- IRR
- 9.2%
- Equity multiple
- 2.54×
- Total profit
- $75,245
- Equity at exit
- $144,213
Cash invested: $48,860 (down + closing). Projections, not guarantees.
Landlord ↔ Tenant lean methodology
- Overall (STATE)
- 83 Strongly Landlord-Friendly
- State Kentucky
- 83 Strongly Landlord-Friendly · R+16
- County
- — inherits STATE
- City
- — inherits STATE
ZIP-level market 41102
- Home prices YoY
- 1.4%
- Active inventory
- 65
- Price-to-rent
- 13.2×
Monthly cashflow live
- Estimated rent
- $1,104 medium interval (Pro) →
- Mortgage (P&I)
- −$915
- Tax from tax record
- −$38 /mo · $454/yr
- Insurance
- −$73
- HOA
- −$0
- Vacancy / Maint / Mgmt
- −$232
- Net cashflow
- $-153
Break-even live
UW: 25.0% down · 7.5% · 30yr · 1.5% tax · 5.0% vac · 8.0% maint · 8.0% mgmt
Financing live
Cash to close
- Down payment
- $43,625
- Closing costs
- $5,235
- Reserves months
- —
- Total cash needed
- —
Loan-product check · same deal, 3 products live
Conventional
25% down · 7.5% · 30yr
- Down + closing
- —
- Monthly P&I
- —
- Monthly cashflow
- —
- DSCR
- —
- Eligible?
- —
Personal DTI + credit; lowest rate.
DSCR
20% down · 8.5% · 30yr
- Down + closing
- —
- Monthly P&I
- —
- Monthly cashflow
- —
- DSCR
- —
- Eligible?
- —
No personal income docs; deal must DSCR.
Hard money
10% down · 12.0% · 12mo
- Down + closing
- —
- Monthly P&I
- —
- Monthly cashflow
- —
- DSCR
- —
- Eligible?
- —
Short-term bridge; refi at stabilization.
Listing history 8 events
-
2026-06-18days on market $174,500 Active 10 DOM
-
2026-06-17days on market $174,500 Active 9 DOM
-
2026-06-16days on market $174,500 Active 8 DOM
-
2026-06-15days on market $174,500 Active 7 DOM
-
2026-06-13days on market $174,500 Active 5 DOM
-
2026-06-12days on market $174,500 Active 4 DOM
-
2026-06-09remarks 699-char remark
-
2026-06-09$174,500 Active 1 DOM
ⓘ Source: listings_history table (triggers on properties + properties_extension) + one-shot
backfill from property_details.listing_events for pre-trigger history.
Tax reassessment forecast KY · Resets to sale price
- Current annual tax
- $454 · $38/mo
- Projected year-2 tax
- $1,501 · $125/mo
- Expected delta
- +$1,047/yr (+$87/mo · 230.6%)
ⓘ Screening estimate from a state-policy table — verify with the county assessor before closing.
Climate risk First Street
- Flood 1/10 Low FEMA zone X (unshaded) · 0% chance over 30 yrs
- Wildfire 1/10 Low
- Heat 5/10 Major 7 d/yr ≥102°F today · 20 d/yr by 30 yrs out
- Wind 2/10 Low 2% chance of damaging wind over 30 yrs
- Air quality 2/10 Low 0 unhealthy d/yr today · 2 by 30 yrs out
Nearby sold comps map
Loading sold comps map…
Walkable amenities ~0.75 mi
Loading nearby amenities…
Taxation est. · year 1
- Rental income
- $13,254
- − Mortgage interest
- −$9,775
- − Property taxes
- −$454
- − Insurance
- −$872
- − Repairs & maintenance
- −$1,060
- − Management
- −$1,060
- − Depreciation
- −$5,076
- Taxable loss
- −$5,044
- Est. tax savings @ 24.0%
- +$1,211
- After-tax cash flow
- $-626/yr
For passive investors: Depreciation is non-cash, so a rental often shows a tax loss while cash-flowing — sheltering income. Rental losses are passive: they offset passive income freely, and up to $25,000/yr can offset ordinary (W-2) income if you actively participate and your MAGI is under $100k (phasing out to $0 by $150k); unused losses carry forward. On sale, claimed depreciation is recaptured at up to 25%, and gains may owe capital-gains tax (a 1031 exchange can defer both). Figures are a year-1 estimate at your 24.0% rate — not tax advice; consult a CPA.
Schools (NCES district)
- District
- Ashland Independent
- NCES district ID
- 2100150
- Math proficiency
- 32% ▼ -16.00%
- Reading proficiency
- 44% ▼ -15.00%
- Median HH income
- $36,579
- Composite
- 31.51/100
- National rank
- #5971
- State rank
- #49 of 165 in KY
Livability — Ashland
- Score
- 64/100
- State rank
- #304
- US rank
- #14462
Category grades
Schools grade is shown separately in the Schools card above.
Census & demographics
- Census place
- Ashland, KY
- Population (ZIP)
- 20,779
Population outlook (Boyd County) Hauer SSP2
- Today (2025)
- 46,137 people
- By 2030
- 44,585 · -3.4%
- By 2040
- 41,442 · -10.2%
- By 2050
- 38,313 · -17.0%
- By 2075
- 31,077 · -32.6%
- By 2100
- 23,432 · -49.2%
Race, ethnicity, and origin ACS 2023
- Neighborhood character
- Predominantly White (93%)
- Race & ethnicity
- White 93% Two or more races 3% Black 3% Hispanic / Latino 1%
- Common ancestry
- Serbian 4% Italian 3% Slovak 1%
- Foreign-born
- 1% · Canada
Political lean MEDSL · Boyd
- 2024 margin
- Solid R (+38.5) · D 30.0% · R 68.6% · Other 1.4%
- 2008→2024 swing
- -26.2pp toward R · 2008: -12.3pp · 2024: -38.5pp
- All cycles
- 2024: R+38.5 2020: R+33.2 2016: R+37.0 2012: R+16.3 2008: R+12.3
Not yet ingested
- Civics
- —
Market trends
- HPI YoY
- ▲ 3.98%
- Current HPI
- 299.41
- Rent YoY
- —
- Metro
- —
- State GDP YoY
- ▲ 1.81%
- F500 in state
- 4
Industry mix (Fortune 500 HQ in KY)
| Industry | F500 HQs | Revenue |
|---|---|---|
| Healthcare | 1 | $118B |
|
||
| Food / Beverage | 1 | $7B |
|
||
Price history
+98.3% since first listed7 events — show timeline
- 2026-06-07 Listed $174,500 AABOR
- 2021-10-13 Sold (Public Records) $119,500 Public Records
- 2021-10-08 Sold (MLS) $119,500 AABOR
- 2021-09-02 Listed $119,500 AABOR
- 2013-12-04 Sold (Public Records) $91,500 Public Records
- 2011-11-18 Sold (Public Records) $91,500 Public Records
- 2006-07-07 Sold (Public Records) $88,000 Public Records
Property tax history
-1.6%/yrLatest (2025): $454 · -4.5% YoY. Source: county tax records.
Cash-flow waterfall
monthlySold comps — $/sqft
last 12 mo · ≤1 miLoading sold comps…