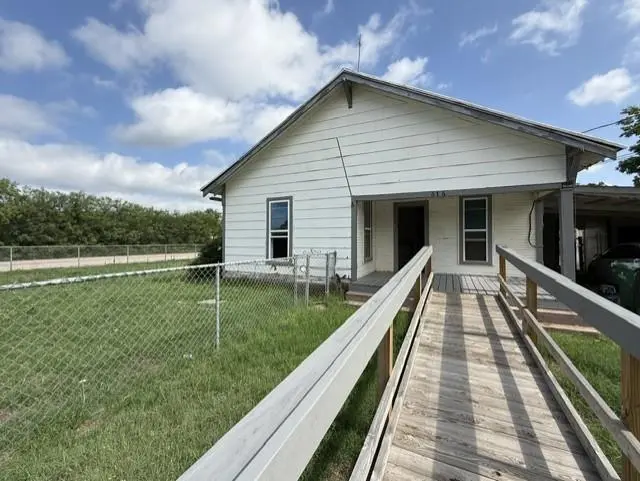
616 W 4th St · Coleman, TX
Flood risk No data
- FEMA flood zone
- —
- Chance of flooding over 30 yrs
- —
- Est. flood insurance / yr
- —
Fire risk No data
- Est. fire insurance / yr
- —
Heat risk No data
- Hot days now (above threshold)
- —
- Hot days in 30 yrs
- —
Wind risk No data
- Chance of severe wind over 30 yrs
- —
Air-quality risk No data
- Unhealthy air days now
- —
- Unhealthy air days in 30 yrs
- —
Risk factors via First Street. Map © Google.
Why this score? — see what drove the B+ grade
The composite is a weighted blend of 9 inputs, each scored 0–100. Each bar is that input's sub-score; the figure is the points it added to the 100-point composite (weight × sub-score).
- Cash flow +26.7/30.0
- ARV discount +15.0/15.0
- DSCR +9.2/10.0
- 1% rule +8.0/10.0
- Appreciation +7.8/10.0
- Livability +3.4/5.0
- Schools +3.3/10.0
- Rent growth +2.5/5.0
- Condition / age +2.5/5.0
$73,500
🖨 Deal sheet 📄 Offer letter ✓ Due diligence
Listing remarks
Charming 2-bedroom, 1-bath home situated on a large lot in Coleman. Inside, you'll find beautiful hardwood floors, generously sized bedrooms, and a spacious laundry room that offers additional storage and functionality. Recent repairs made by the seller provide a great starting point for the next owner. Whether you're looking for a primary residence, investment property, or a project to personalize, this home offers plenty of potential. Bring your ideas and finishing touches to make this property your own. Conveniently located with easy access to local amenities, this is an opportunity you won't want to miss.
Key facts
- 0.36 acre lot
- 2 parking spots
- Built 1950
Property features AI
Finance
- Other: Property is not attached to another dwelling; Will not subdivide; Parcel identifier: R17326
- HOA & community: No association
Exterior
- Parking: Attached carport; Driveway; 2 covered/carport spaces
- Utilities: City water with individual water meter; City sewer; Electricity connected
- Home design: Single-family residence; Residential property; One story; Accessible approach with ramp
- Construction: Metal roof; Pillar/post/pier foundation; Built in 1950
- Exterior features: Covered porch(es); Covered patio/porch; Outdoor storage; Utilities easement; All-weather road access
Interior
- Kitchen: Dishwasher
- Bedrooms: 2 bedrooms (both on main level)
- Flooring: Linoleum; Wood
- Bathrooms: 1 full bathroom
- Heating & cooling: Ceiling fan(s); Window unit(s); No central heating
- Interior features: Decorative lighting; One living area; One dining area; 6 total rooms; One-level layout
- Laundry & utility: Utility room; Washer hookup; Laundry with built-in cabinets
Neighborhood map
What this means for you Summary
Snapshot
- This is a 2-bed/1.0-bath single-family listed at $74k.
Deal economics
- At list price, monthly cash flow is $200 ($2k/yr) — positive.
- The deal already cash-flows at list — no discount required.
- Meets the 1% rule at list price ($959 rent vs $74k).
- Cap rate 9.6% vs local median 4.5% in Coleman — top-decile yield for the area; either an underpriced asset or a hidden risk that comps aren't pricing in. Stress-test before assuming the spread holds.
Location & tenants
- Location reads 68/100 on livability (#454 in TX) — a middle-class / working-renter tenant base. Strengths: crime A+, cost of living A+, housing A+; Watch: health & safety D+, amenities F, commute F.
- Coleman ISD (town): math 42% / reading 39% proficiency, ranked #439 of 826 in TX (top 53%) — families likely to look elsewhere, expect single-tenant / working-renter base with shorter leases.
- Zoned schools: Coleman El (math 32% / reading 27%, grade F, #2,525 of 4,322 statewide, top 62%, 339 students, 69% FRL).
- Market conditions: 119 active listings in the ZIP; 5 units permitted in Coleman County in 2024 (0 in 5+ unit buildings).
Forward outlook
- In year one you build about $5k of equity ($508 loan paydown + $4k appreciation (5.7% local appreciation)).
- Coleman County population projected at -28% by 2050 — secular population decline; favor cash flow + early exit over multi-decade hold.
- At projected returns (5.7% appreciation + 3.0% rent growth), your $21k cash investment doubles in ~3 years — after that, you're playing with house money.
- By year 7, paydown + projected appreciation supports a ~$30k cash-out refi (75% LTV) — recoverable capital for the next deal without selling this one.
Negotiation context
- Only 10 days on market — expect competitive offers; lowballing is unlikely to land.
- 3 sale attempts since 9y ago with the ask held roughly flat each time — persistent listings suggest the price (not the market) is what's stuck; bring a comps-based counter.
Risks & watch-outs
- Watch-outs: built in 1950 — expect roof / HVAC / electrical / plumbing capex.
Questions for the listing agent
- Built in 1950 — when were the roof, HVAC, electrical panel, plumbing, and water heater last replaced?
- Is there a deadline driving the sale (1031 exchange, divorce, estate, relocation)? That informs how much negotiation room exists.
- Schools are F-rated, which usually means shorter tenancies and higher turnover. Who's the typical renter profile here, and what's been the actual vacancy rate?
- What's the average days-on-market for RENTAL listings here right now (not sales)? A rising rental-DOM trend means longer vacancies and softer asking-rent achievability than the comps imply.
- What's the recent tenant-quality profile in this submarket — average credit score on applications, eviction rate, late-payment / NSF rate, and stable-employment percentage? A property-management company in the area should have these aggregated.
- How much new for-sale + rental construction is in the pipeline within 1–3 miles? Heavy new supply typically softens prices + rents 12–24 months out; constrained supply supports both.
Investment metrics
- 1% rule
- 1.30% ✓
- Cap rate
- 9.56%
- Cash-on-cash
- 11.66%
- DSCR
- 1.52
- GRM
- 6.4
CMA / ARV
- ARV (on-the-fly)
- $102,528
- Comps found
- 12
Show comp detail 12 sales within ~0.75 mi
| Address | Dist | Beds/Ba | Sqft | Sold | Price | $/sf | Match |
|---|---|---|---|---|---|---|---|
| 801 S Nueces St | 0.18mi | 3/1.0 (+1) | 1,064 (-0%) | 11mo | $59,900 | $56 | 77 |
| 516 W 4th St | 0.08mi | 2/1.0 | 950 (-11%) | 10mo | $133,000 | $140 | 69 |
| 1216 5th Ave | 0.16mi | 2/1.0 | 1,196 (+12%) | 7mo | $115,000 | $96 | 67 |
| 716 14th St | 0.63mi | 2/2.0 | 1,062 (-1%) | 4mo | $30,000 | $28 | 62 |
| 903 W 2nd St | 0.20mi | 3/2.0 (+1) | 1,158 (+8%) | 11mo | $129,900 | $112 | 59 |
| 504 S Concho St | 0.43mi | 2/1.0 | 1,178 (+10%) | 5mo | $52,000 | $44 | 58 |
| 1115 S Colorado St | 0.45mi | 2/1.0 | 1,179 (+10%) | 5mo | $62,500 | $53 | 58 |
| 208 N Neches St | 0.71mi | 2/1.0 | 1,040 (-3%) | 7mo | $29,990 | $29 | 56 |
| 215 E 10th St | 0.60mi | 2/2.0 | 1,092 (+2%) | 12mo | $165,000 | $151 | 54 |
| 1215 Llano | 0.58mi | 2/2.0 | 976 (-9%) | 5mo | $149,000 | $153 | 50 |
| 1510 S Colorado St | 0.51mi | 2/1.0 | 1,204 (+13%) | 12mo | $199,999 | $166 | 45 |
| 213 W 14th St | 0.71mi | 3/1.0 (+1) | 1,148 (+8%) | 12mo | $59,900 | $52 | 39 |
Match score weights: distance 35% · size 25% · config 20% · recency 20%. Top-matched comps best support the ARV.
Projected returns pro-forma
5.66% appreciation · 3.0% rent growth · sell at horizon
- IRR
- 24.3%
- Equity multiple
- 2.58×
- Total profit
- $32,535
- Equity at exit
- $44,638
- IRR
- 23.2%
- Equity multiple
- 5.19×
- Total profit
- $86,231
- Equity at exit
- $79,631
Cash invested: $20,580 (down + closing). Projections, not guarantees.
Landlord ↔ Tenant lean methodology
- Overall (STATE)
- 87 Strongly Landlord-Friendly
- State Texas
- 87 Strongly Landlord-Friendly · R+5
- County
- — inherits STATE
- City
- — inherits STATE
ZIP-level market 76834
- Home prices YoY
- 4.8%
- Active inventory
- 119
- Price-to-rent
- 6.4×
Monthly cashflow live
- Estimated rent
- $959 medium interval (Pro) →
- Mortgage (P&I)
- −$385
- Tax from tax record
- −$141 /mo · $1,696/yr
- Insurance
- −$31
- HOA
- −$0
- Vacancy / Maint / Mgmt
- −$201
- Net cashflow
- $200
Break-even live
UW: 25.0% down · 7.5% · 30yr · 1.5% tax · 5.0% vac · 8.0% maint · 8.0% mgmt
Financing live
Cash to close
- Down payment
- $18,375
- Closing costs
- $2,205
- Reserves months
- —
- Total cash needed
- —
Loan-product check · same deal, 3 products live
Conventional
25% down · 7.5% · 30yr
- Down + closing
- —
- Monthly P&I
- —
- Monthly cashflow
- —
- DSCR
- —
- Eligible?
- —
Personal DTI + credit; lowest rate.
DSCR
20% down · 8.5% · 30yr
- Down + closing
- —
- Monthly P&I
- —
- Monthly cashflow
- —
- DSCR
- —
- Eligible?
- —
No personal income docs; deal must DSCR.
Hard money
10% down · 12.0% · 12mo
- Down + closing
- —
- Monthly P&I
- —
- Monthly cashflow
- —
- DSCR
- —
- Eligible?
- —
Short-term bridge; refi at stabilization.
Listing history 8 events
-
2026-06-18days on market $73,500 Active 10 DOM
-
2026-06-17days on market $73,500 Active 9 DOM
-
2026-06-16days on market $73,500 Active 8 DOM
-
2026-06-15days on market $73,500 Active 7 DOM
-
2026-06-13days on market $73,500 Active 5 DOM
-
2026-06-12days on market $73,500 Active 4 DOM
-
2026-06-09remarks 616-char remark
-
2026-06-09$73,500 Active 1 DOM
ⓘ Source: listings_history table (triggers on properties + properties_extension) + one-shot
backfill from property_details.listing_events for pre-trigger history.
Tax reassessment forecast TX · Resets to sale price
- Current annual tax
- $1,696 · $141/mo
- Projected year-2 tax
- $1,696 · $141/mo
- Expected delta
- $0/yr ($0/mo · 0.0%)
ⓘ Screening estimate from a state-policy table — verify with the county assessor before closing.
Nearby sold comps map
Loading sold comps map…
Walkable amenities ~0.75 mi
Loading nearby amenities…
Taxation est. · year 1
- Rental income
- $11,506
- − Mortgage interest
- −$4,117
- − Property taxes
- −$1,696
- − Insurance
- −$368
- − Repairs & maintenance
- −$920
- − Management
- −$920
- − Depreciation
- −$2,138
- Taxable income
- $1,346
- Est. tax owed @ 24.0%
- −$323
- After-tax cash flow
- $2,078/yr
For passive investors: Depreciation is non-cash, so a rental often shows a tax loss while cash-flowing — sheltering income. Rental losses are passive: they offset passive income freely, and up to $25,000/yr can offset ordinary (W-2) income if you actively participate and your MAGI is under $100k (phasing out to $0 by $150k); unused losses carry forward. On sale, claimed depreciation is recaptured at up to 25%, and gains may owe capital-gains tax (a 1031 exchange can defer both). Figures are a year-1 estimate at your 24.0% rate — not tax advice; consult a CPA.
Schools (NCES district)
- District
- Coleman ISD
- NCES district ID
- 4814550
- Math proficiency
- 42% ▲ 3.00%
- Reading proficiency
- 39% ▲ 3.00%
- Median HH income
- $31,765
- Composite
- 33.18/100
- National rank
- #5540
- State rank
- #439 of 826 in TX
Livability — Coleman
- Score
- 68/100
- State rank
- #454
- US rank
- #9173
Category grades
Schools grade is shown separately in the Schools card above.
Census & demographics
- Census place
- Coleman, TX
- Population (ZIP)
- 4,861
Population outlook (Coleman County) Hauer SSP2
- Today (2025)
- 7,321 people
- By 2030
- 6,834 · -6.7%
- By 2040
- 5,968 · -18.5%
- By 2050
- 5,283 · -27.8%
- By 2075
- 4,205 · -42.6%
- By 2100
- 3,405 · -53.5%
Race, ethnicity, and origin ACS 2023
- Neighborhood character
- Predominantly White (76%)
- Race & ethnicity
- White 76% Hispanic / Latino 20% Two or more races 13% Black 3%
- Hispanic origin (detail)
- Mexican 18%
- Common ancestry
- Italian 16% Slovak 8% Serbian 3%
- Foreign-born
- 7% · Canada
- Languages at home
- 79% English-only · Spanish 21%
Political lean MEDSL · Coleman
- 2024 margin
- Solid R (+79.0) · D 10.3% · R 89.3%
- 2008→2024 swing
- -15.1pp toward R · 2008: -64.0pp · 2024: -79.0pp
- All cycles
- 2024: R+79.0 2020: R+77.3 2016: R+76.8 2012: R+73.7 2008: R+64.0
Not yet ingested
- Civics
- —
Market trends
- HPI YoY
- ▲ 5.66%
- Current HPI
- 123.8456
- Rent YoY
- —
- Metro
- —
- State GDP YoY
- ▲ 3.95%
- F500 in state
- 110
Industry mix (Fortune 500 HQ in TX)
| Industry | F500 HQs | Revenue |
|---|---|---|
| Energy | 16 | $1,198B |
|
||
| Technology | 5 | $198B |
|
||
| Engineering / Construction | 4 | $72B |
|
||
| Energy Services | 3 | $60B |
|
||
| Utilities | 3 | $41B |
|
||
| Healthcare | 2 | $330B |
|
||
Price history
+47.3% since first listed11 events — show timeline
- 2026-06-08 Listed $73,500 NTREIS
- 2019-03-21 Sold (Public Records) — Public Records
- 2018-12-27 Listing Removed — NTREIS
- 2018-12-26 Price Changed $28,000 NTREIS
- 2018-09-11 Price Changed $34,900 NTREIS
- 2018-07-02 Listed $39,900 NTREIS
- 2017-08-17 Listing Removed — NTREIS
- 2017-07-06 Price Changed $44,900 NTREIS
- 2017-04-26 Listed $49,900 NTREIS
- 2013-03-28 Sold (Public Records) — Public Records
- 2011-05-20 Sold (Public Records) — Public Records
Property tax history
+12.9%/yrLatest (2025): $1,696 · -10.6% YoY. Source: county tax records.
Cash-flow waterfall
monthlySold comps — $/sqft
last 12 mo · ≤1 miLoading sold comps…