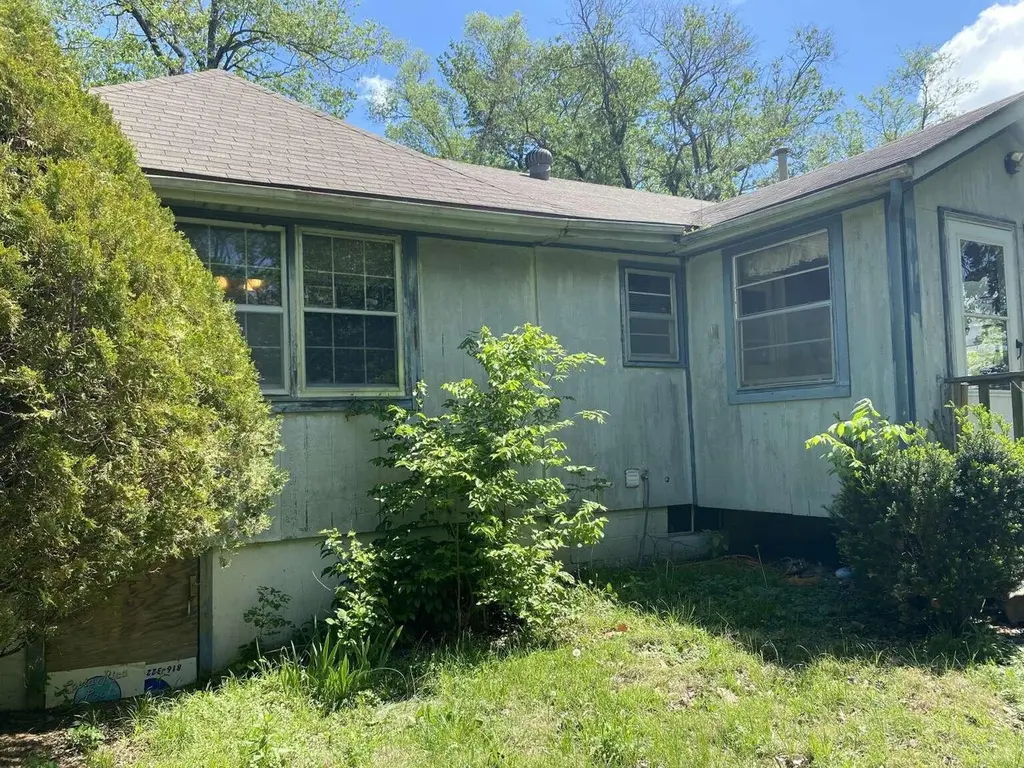
1002 N Madison St · Raymore, MO
Flood risk 1/10 · Minimal
- FEMA flood zone
- X (unshaded)
- Chance of flooding over 30 yrs
- 0.0%
- Est. flood insurance / yr
- $473 – $860
Fire risk 4/10 · Minor
- Est. fire insurance / yr
- $1,054 – $1,958
Heat risk 4/10 · Minor
- Hot days now (above 107°F)
- 7 days/yr
- Hot days in 30 yrs
- 17 days/yr
Wind risk 2/10 · Minimal
- Chance of severe wind over 30 yrs
- 1.0%
Air-quality risk 2/10 · Minimal
- Unhealthy air days now
- 2 days/yr
- Unhealthy air days in 30 yrs
- 2 days/yr
Risk factors via First Street. Map © Google.
Why this score? — see what drove the D grade
The composite is a weighted blend of 9 inputs, each scored 0–100. Each bar is that input's sub-score; the figure is the points it added to the 100-point composite (weight × sub-score).
- ARV discount +15.0/15.0
- Cash flow +10.2/30.0
- Schools +4.0/10.0
- Rent growth +3.6/5.0
- Livability +3.6/5.0
- DSCR +2.9/10.0
- Condition / age +2.5/5.0
- 1% rule +1.9/10.0
- Appreciation +0.0/10.0
$279,900
🖨 Deal sheet 📄 Offer letter ✓ Due diligence
Listing remarks
Charming 4-bedroom, 1-bath home situated on a spacious ~1-acre lot in the growing Raymore area. This single-story property offers approximately 1,567 sq ft of living space plus a full basement, providing plenty of room for storage or future expansion. The home features a functional layout with a mix of hardwood and carpet flooring, an attached garage, and a large yard with endless potential. Built in 1950, this property presents a great opportunity for buyers looking to add personal touches or investors seeking value-add potential. The expansive lot offers privacy and flexibility, ideal for outdoor living, additional structures, or future improvements. Conveniently located with easy access
Key facts
- Expansive lot
- Large yard
- Spacious lot
Tags
Property features AI
Finance
- Financial info: Annual tax amount reported
Exterior
- Parking: Attached garage with 2 spaces
- Utilities: Public water service; Public sewer service
- Home design: Single-family residence; One level
- Construction: Shingle roof (not specified); Construction details not specified
- Exterior features: Public water; Public sewer; 1-acre lot
Interior
- Bathrooms: 1 full bathroom
- Heating & cooling: Central air conditioning; Natural gas forced-air heating
- Interior features: Living room fireplace; Basement (concrete, full, partially finished)
Neighborhood map
What this means for you Summary
Snapshot
- This is a 3-bed/1.0-bath single-family listed at $280k.
Deal economics
- At list price, monthly cash flow is $-161 ($-2k/yr) — negative.
- To cash-flow at today's rent, offer at most $251k (10.2% below list).
- To meet the 1% rule (rent ≥ 1% of price), the offer needs to be $193k (31.1% below list).
- Recommended offer: $193k (31.1% below list) — sets the bar for 1% rule.
- Cap rate 5.6% vs local median 3.2% in Raymore — top-decile yield for the area; either an underpriced asset or a hidden risk that comps aren't pricing in. Stress-test before assuming the spread holds.
Location & tenants
- Location reads 71/100 on livability (#111 in MO) — a middle-class / working-renter tenant base. Strengths: employment A+, housing A+, crime A; Watch: amenities F, commute F, health & safety F.
- Raymore-Peculiar R-II (suburban): math 37% / reading 51% proficiency, ranked #70 of 324 in MO (top 22%) — families likely to look elsewhere, expect single-tenant / working-renter base with shorter leases.
- Market conditions: Rents rising fast (+4.6%/yr); 352 active listings in the ZIP; 13 comparable units currently listed for rent nearby; rentals at typical pace (median 24d on market — plan ~3-4 weeks tenant-placement turnaround); solid renter incomes; 588 units permitted in Cass County in 2024 (0 in 5+ unit buildings).
Forward outlook
- Local home prices are declining (-3.0%/yr); year-one equity from $2k of loan paydown is wiped out by about $8k of value loss. Plan a longer hold.
- Cass County population projected to shrink 3% by 2050 — rents likely to lag national; underwrite the cash flow, not the appreciation.
Negotiation context
- It's been on market 28 days — a 2% lower offer ($276k) is reasonable based on typical stale-listing flexibility.
Risks & watch-outs
- Watch-outs: built in 1950 — expect roof / HVAC / electrical / plumbing capex.
Questions for the listing agent
- What do current leases actually rent for vs. the listed asking? Can we see a recent rent roll and the last 12 months of T-12 income?
- Built in 1950 — when were the roof, HVAC, electrical panel, plumbing, and water heater last replaced?
- Is there a deadline driving the sale (1031 exchange, divorce, estate, relocation)? That informs how much negotiation room exists.
- Schools are B-rated — typically a magnet for longer-tenancy family renters. What's the average tenant stay here, and is there a school-zone premium baked into asking?
- The area grade is low — what's the realistic commute time and amenity access for the typical tenant pool here? Any planned neighborhood developments (good or bad) we should know about?
- What's the average days-on-market for RENTAL listings here right now (not sales)? A rising rental-DOM trend means longer vacancies and softer asking-rent achievability than the comps imply.
- What's the recent tenant-quality profile in this submarket — average credit score on applications, eviction rate, late-payment / NSF rate, and stable-employment percentage? A property-management company in the area should have these aggregated.
- How much new for-sale + rental construction is in the pipeline within 1–3 miles? Heavy new supply typically softens prices + rents 12–24 months out; constrained supply supports both.
Investment metrics
- 1% rule
- 0.69% ✗
- Cap rate
- 5.60%
- Cash-on-cash
- -2.46%
- DSCR
- 0.89
- GRM
- 12.1
CMA / ARV
- ARV (median comp)
- $387,987
- List price
- $279,900
- Delta
- -27.86%
- Verdict
- UNDERPRICED
- Comps
- 20 within 1.0 mi
Show comp detail 12 sales within ~0.75 mi
| Address | Dist | Beds/Ba | Sqft | Sold | Price | $/sf | Match |
|---|---|---|---|---|---|---|---|
| 1014 Branchwood Ln | 0.28mi | 3/2.0 | 1,636 (+4%) | 1mo | $470,044 | $287 | 75 |
| 601 Mayfair Ct | 0.27mi | 3/2.0 | 1,518 (-3%) | 5mo | $423,515 | $279 | 74 |
| 1009 Branchwood Ln | 0.25mi | 3/2.0 | 1,636 (+4%) | 5mo | $445,950 | $273 | 73 |
| 778 Creekmoor Dr | 0.46mi | 3/2.0 | 1,571 (+0%) | 3mo | $425,000 | $271 | 72 |
| 711 Glenn Cir | 0.43mi | 3/2.5 | 1,687 (+8%) | 1mo | $419,000 | $248 | 60 |
| 1024 Branchwood Ln | 0.30mi | 2/2.0 (-1) | 1,411 (-10%) | 1mo | $489,999 | $347 | 60 |
| 1007 Branchwood Ln | 0.25mi | 2/2.0 (-1) | 1,411 (-10%) | 6mo | $417,868 | $296 | 58 |
| 1313 SE Ranchland St | 0.30mi | 2/2.0 (-1) | 1,411 (-10%) | 5mo | $404,950 | $287 | 56 |
| 819 Bridgeshire Dr | 0.72mi | 3/2.0 | 1,618 (+3%) | 4mo | $440,000 | $272 | 54 |
| 709 Glenn Cir | 0.43mi | 4/2.5 (+1) | 1,776 (+13%) | 4mo | $384,950 | $217 | 44 |
| 715 Glenn Cir | 0.45mi | 4/2.5 (+1) | 1,776 (+13%) | 7mo | $389,950 | $220 | 40 |
| 304 W Calico Dr | 0.68mi | 4/2.0 (+1) | 1,340 (-14%) | 4mo | $300,000 | $224 | 32 |
Match score weights: distance 35% · size 25% · config 20% · recency 20%. Top-matched comps best support the ARV.
Projected returns pro-forma
-3.0% appreciation · 4.56% rent growth · sell at horizon
- IRR
- -19.0%
- Equity multiple
- 0.33×
- Total profit
- $-52,653
- Equity at exit
- $41,734
- IRR
- -9.1%
- Equity multiple
- 0.41×
- Total profit
- $-46,531
- Equity at exit
- $24,201
Cash invested: $78,372 (down + closing). Projections, not guarantees.
Landlord ↔ Tenant lean methodology
- Overall (STATE)
- 81 Strongly Landlord-Friendly
- State Missouri
- 81 Strongly Landlord-Friendly · R+10
- County
- — inherits STATE
- City
- — inherits STATE
ZIP-level market 64083
- Rents YoY
- 4.6%
- Active inventory
- 352
- Price-to-rent
- 12.1×
Monthly cashflow live
- Estimated rent
- $1,928 high interval (Pro) →
- Mortgage (P&I)
- −$1,468
- Tax from tax record
- −$99 /mo · $1,192/yr
- Insurance
- −$117
- HOA
- −$0
- Vacancy / Maint / Mgmt
- −$405
- Net cashflow
- $-161
Break-even live
UW: 25.0% down · 7.5% · 30yr · 1.5% tax · 5.0% vac · 8.0% maint · 8.0% mgmt
Financing live
Cash to close
- Down payment
- $69,975
- Closing costs
- $8,397
- Reserves months
- —
- Total cash needed
- —
Loan-product check · same deal, 3 products live
Conventional
25% down · 7.5% · 30yr
- Down + closing
- —
- Monthly P&I
- —
- Monthly cashflow
- —
- DSCR
- —
- Eligible?
- —
Personal DTI + credit; lowest rate.
DSCR
20% down · 8.5% · 30yr
- Down + closing
- —
- Monthly P&I
- —
- Monthly cashflow
- —
- DSCR
- —
- Eligible?
- —
No personal income docs; deal must DSCR.
Hard money
10% down · 12.0% · 12mo
- Down + closing
- —
- Monthly P&I
- —
- Monthly cashflow
- —
- DSCR
- —
- Eligible?
- —
Short-term bridge; refi at stabilization.
Rent comps 13 comps
| Address | Beds | Baths | Sqft | Rent | $/sqft | DOM | Units | Dist |
|---|---|---|---|---|---|---|---|---|
| 206 W Calico Dr Raymore, MO | 3.0 | 2.0 | 1400 | $2,100 | $1.50 | 23d | 1 | 0.72mi |
| 327 Shenandoah Dr Raymore, MO | 3.0 | 2.0 | 1489 | $2,049 | $1.38 | 23d | 1 | 0.82mi |
| 105 E Maplewood Ln Raymore, MO | 2.0 | 2.0 | 1256 | $1,895 | $1.51 | 43d | 1 | 1.18mi |
| 236 Sumac Rd Unit 240 Raymore, MO | 2.0 | 1.5 | 1265 | $1,595 | $1.26 | 43d | 1 | 1.18mi |
| 233 Sumac Rd Raymore, MO | 2.0 | 1.5 | 1265 | $1,595 | $1.26 | 1d | 1 | 1.21mi |
| 109 E Pine St Unit 111 Raymore, MO | 3.0 | 3.0 | 1987 | $2,295 | $1.16 | 23d | 1 | 1.28mi |
| 257 Persimmon Rd Raymore, MO | 3.0 | 2.5 | 1390 | $1,995 | $1.44 | 1d | 1 | 1.31mi |
| 241 Pawpaw Rd Raymore, MO | 2.0 | 1.5 | 1265 | $1,595 | $1.26 | 11d | 1 | 1.37mi |
| 239 Pawpaw Rd Raymore, MO | 2.0 | 1.5 | 1265 | $1,628 | $1.29 | 43d | 1 | 1.37mi |
| 526 N Foxridge Dr Unit 1 Raymore, MO | 3.0 | 2.5 | 1672 | $1,645 | $0.98 | 3d | 1 | 1.38mi |
| 507 N Foxridge Dr Raymore, MO | 2.0 | 2.5 | 1162 | $1,405 | $1.21 | 23d | 1 | 1.38mi |
| 507 N Foxridge Dr Raymore, MO | 2.0 | 2.5 | 1162 | $1,438 | $1.24 | 43d | 1 | 1.38mi |
| 210 Pointe Ln Raymore, MO | 2.0 | 2.5 | 1327 | $1,600 | $1.21 | 4d | 1 | 1.42mi |
Listing history 3 events
-
2026-06-01days on market $279,900 Active 28 DOM
-
2026-05-31days on market $279,900 Active 27 DOM
-
2026-05-04$279,900 Active 800-char remark
ⓘ Source: listings_history table (triggers on properties + properties_extension) + one-shot
backfill from property_details.listing_events for pre-trigger history.
Tax reassessment forecast MO · Resets to sale price
- Current annual tax
- $1,192 · $99/mo
- Projected year-2 tax
- $2,715 · $226/mo
- Expected delta
- +$1,523/yr (+$127/mo · 127.8%)
ⓘ Screening estimate from a state-policy table — verify with the county assessor before closing.
Climate risk First Street
- Flood 1/10 Low FEMA zone X (unshaded) · 0% chance over 30 yrs
- Wildfire 4/10 Moderate
- Heat 4/10 Moderate 7 d/yr ≥107°F today · 17 d/yr by 30 yrs out
- Wind 2/10 Low 100% chance of damaging wind over 30 yrs
- Air quality 2/10 Low 2 unhealthy d/yr today · 2 by 30 yrs out
Nearby sold comps map
Loading sold comps map…
Walkable amenities ~0.75 mi
Loading nearby amenities…
Taxation est. · year 1
- Rental income
- $23,133
- − Mortgage interest
- −$15,679
- − Property taxes
- −$1,192
- − Insurance
- −$1,400
- − Repairs & maintenance
- −$1,851
- − Management
- −$1,851
- − Depreciation
- −$8,143
- Taxable loss
- −$6,981
- Est. tax savings @ 24.0%
- +$1,675
- After-tax cash flow
- $-255/yr
For passive investors: Depreciation is non-cash, so a rental often shows a tax loss while cash-flowing — sheltering income. Rental losses are passive: they offset passive income freely, and up to $25,000/yr can offset ordinary (W-2) income if you actively participate and your MAGI is under $100k (phasing out to $0 by $150k); unused losses carry forward. On sale, claimed depreciation is recaptured at up to 25%, and gains may owe capital-gains tax (a 1031 exchange can defer both). Figures are a year-1 estimate at your 24.0% rate — not tax advice; consult a CPA.
Schools (NCES district)
- District
- Raymore-Peculiar R-II
- NCES district ID
- 2923730
- Math proficiency
- 37% ▼ -10.00%
- Reading proficiency
- 51% ▼ -5.00%
- Median HH income
- $71,939
- Composite
- 39.86/100
- National rank
- #3865
- State rank
- #70 of 324 in MO
Livability — Raymore
- Score
- 71/100
- State rank
- #111
- US rank
- #7062
Category grades
Schools grade is shown separately in the Schools card above.
Census & demographics
- Census place
- Raymore, MO
- County
- Cass County · 65,358 people
- City population
- 26,201
- Metro
- Kansas City, MO-KS
- Population (ZIP)
- 26,201
- Household income
- $101,667
- Rent vs Own
- Severe rent burden
- 488.0
Population outlook (Cass County) Hauer SSP2
- Today (2025)
- 105,292 people
- By 2030
- 106,109 · +0.8%
- By 2040
- 105,786 · +0.5%
- By 2050
- 102,062 · -3.1%
- By 2075
- 88,569 · -15.9%
- By 2100
- 68,293 · -35.1%
Race, ethnicity, and origin ACS 2023
- Neighborhood character
- Predominantly White (78%)
- Race & ethnicity
- White 78% Two or more races 10% Black 9% Hispanic / Latino 6% Asian 1%
- Hispanic origin (detail)
- Mexican 2%
- Common ancestry
- Romanian 4% Italian 3% Serbian 2%
- Foreign-born
- 2% · Canada
- Languages at home
- 97% English-only · Spanish 1% Tagalog/Filipino 1%
Political lean MEDSL · Cass
- 2024 margin
- Solid R (+32.1) · D 33.3% · R 65.4% · Other 1.3%
- 2008→2024 swing
- -12.5pp toward R · 2008: -19.6pp · 2024: -32.1pp
- All cycles
- 2024: R+32.1 2020: R+31.6 2016: R+35.9 2012: R+28.4 2008: R+19.6
Not yet ingested
- Civics
- —
Market trends
- HPI YoY
- ▼ -211.98%
- Current HPI
- 181.1129
- Rent YoY
- ▲ 4.56%
- Metro
- Kansas City, MO-KS
- State GDP YoY
- ▲ 1.84%
- F500 in state
- 20
Industry mix (Fortune 500 HQ in MO)
| Industry | F500 HQs | Revenue |
|---|---|---|
| Healthcare | 1 | $163B |
|
||
| Insurance | 1 | $21B |
|
||
| Industrial Technology | 1 | $17B |
|
||
| Retail | 1 | $16B |
|
||
| Industrial Distribution | 1 | $10B |
|
||
| Utilities | 1 | $9B |
|
||
Price history
1 event — show timeline
- 2026-05-04 Listed $279,900 SOMO
Property tax history
+3.3%/yrLatest (2025): $1,192 · +12.8% YoY. Source: county tax records.
Cash-flow waterfall
monthlySold comps — $/sqft
last 12 mo · ≤1 miLoading sold comps…