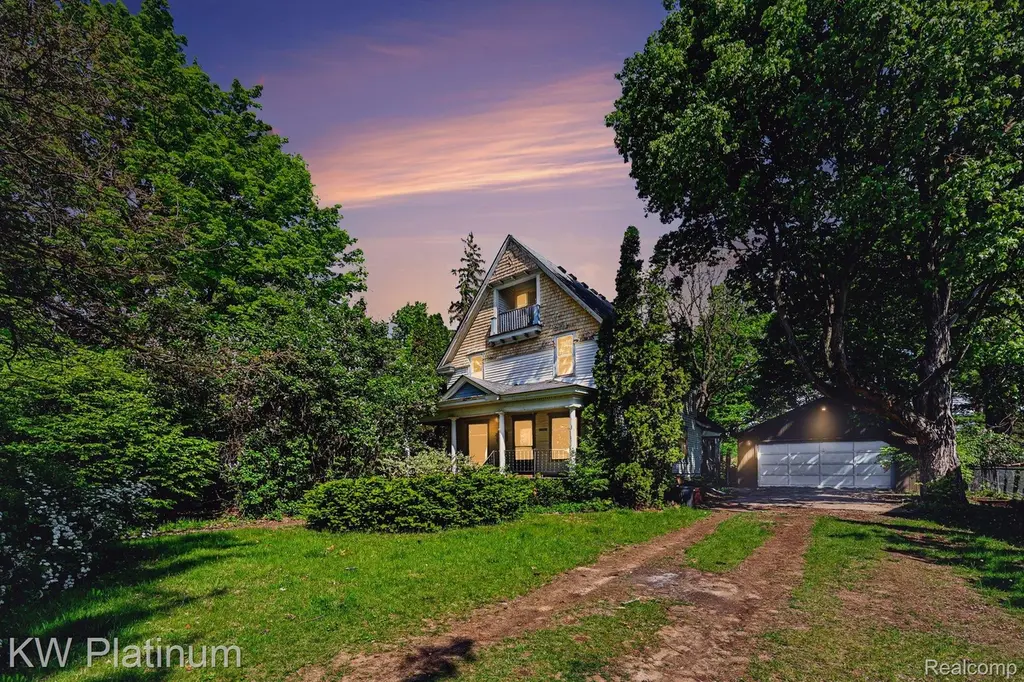
30825 Prospect St · New Haven, MI
Flood risk 1/10 · Minimal
- FEMA flood zone
- X (unshaded)
- Chance of flooding over 30 yrs
- 0.0%
- Est. flood insurance / yr
- $473 – $860
Fire risk 1/10 · Minimal
- Est. fire insurance / yr
- $784 – $1,456
Heat risk 3/10 · Minor
- Hot days now (above 96°F)
- 7 days/yr
- Hot days in 30 yrs
- 15 days/yr
Wind risk 1/10 · Minimal
- Chance of severe wind over 30 yrs
- —
Air-quality risk 4/10 · Minor
- Unhealthy air days now
- 4 days/yr
- Unhealthy air days in 30 yrs
- 5 days/yr
Risk factors via First Street. Map © Google.
Why this score? — see what drove the B- grade
The composite is a weighted blend of 9 inputs, each scored 0–100. Each bar is that input's sub-score; the figure is the points it added to the 100-point composite (weight × sub-score).
- Cash flow +29.2/30.0
- DSCR +10.0/10.0
- 1% rule +7.9/10.0
- ARV discount +7.5/15.0
- Schools +2.9/10.0
- Livability +2.9/5.0
- Rent growth +2.5/5.0
- Condition / age +2.5/5.0
- Appreciation +0.0/10.0
$135,000
🖨 Deal sheet 📄 Offer letter ✓ Due diligence
Listing remarks MLS
Step into a piece of New Haven history with this remarkable 1890 historic home. Spanning over 2,000 square feet of living space, this property offers incredible bones and a solid foundation for anyone looking to restore a classic Michigan estate. Featuring 4 spacious bedrooms and 1.5 bathrooms, the residence retains its original character while being completely functional for modern living. The main structure is in remarkably great shape given its century-plus heritage, sitting on a solid Michigan basement with fully functional mechanicals already in place. One of the most exciting features is the unfinished third-story attic space, which boasts a walk-out balcony that could easily become a spectacular primary suite, home office, or studio. Outside, the property includes a large 2.5-car detached garage, providing ample storage and workshop space. While the home needs a ton of updates to fully restore its original luster, it represents a rare investment opportunity in a growing Macomb County community. Whether you are an investor or a historic home enthusiast, this property is ready for its next chapter.
Key facts
- Walk-out balcony
- Original character
- Solid foundation
Tags
Property features AI
Exterior
- Parking: Detached 2-car garage
- Utilities: Public water; Public sewer
- Home design: Single-family residence; Two levels; Ground-level entry with steps
- Construction: Cedar and wood siding; Block foundation
- Exterior features: Covered porch
Interior
- Kitchen: Free-standing electric range; Free-standing refrigerator
- Bedrooms: 7 total rooms (includes bedrooms and living spaces)
- Bathrooms: 1 full bathroom; 1 half bathroom
- Heating & cooling: Hot water heating (natural gas); No cooling
- Interior features: Gas water heater; Free-standing electric range; Free-standing refrigerator; Unfinished basement
- Laundry & utility: Gas water heater
Neighborhood map
What this means for you Summary
Snapshot
- This is a 3-bed/1.0-bath single-family listed at $135k.
Deal economics
- At list price, monthly cash flow is $470 ($6k/yr) — positive.
- The deal already cash-flows at list — no discount required.
- Meets the 1% rule at list price ($2k rent vs $135k).
- Cap rate 10.5% vs local median 3.2% in New Haven — top-decile yield for the area; either an underpriced asset or a hidden risk that comps aren't pricing in. Stress-test before assuming the spread holds.
Location & tenants
- Location reads 57/100 on livability (#650 in MI) — a working-class tenant base; expect higher turnover. Strengths: cost of living A+, housing A+, crime B; Watch: employment D, amenities F, commute F.
- New Haven Community Schools (suburban): math 25% / reading 39% proficiency, ranked #305 of 540 in MI (top 56%) — families likely to look elsewhere, expect single-tenant / working-renter base with shorter leases.
- Market conditions: 101 active listings in the ZIP; 1,321 units permitted in Macomb County in 2024 (86 in 5+ unit buildings).
Forward outlook
- Local home prices are declining (-3.0%/yr); year-one equity from $933 of loan paydown is wiped out by about $4k of value loss. Plan a longer hold.
- Macomb County population projected at +9% by 2050 — modest demand growth; plan on rents tracking national, not racing it.
- At projected returns (-3.0% appreciation + 3.0% rent growth), your $38k cash investment doubles in ~8 years — after that, you're playing with house money.
Negotiation context
- Only 5 days on market — expect competitive offers; lowballing is unlikely to land.
- 2 sale attempts with the ask held roughly flat each time — persistent listings suggest the price (not the market) is what's stuck; bring a comps-based counter.
Risks & watch-outs
- Watch-outs: built in 1890 — expect roof / HVAC / electrical / plumbing capex.
Questions for the listing agent
- Built in 1890 — when were the roof, HVAC, electrical panel, plumbing, and water heater last replaced?
- Is there a deadline driving the sale (1031 exchange, divorce, estate, relocation)? That informs how much negotiation room exists.
- What's the average days-on-market for RENTAL listings here right now (not sales)? A rising rental-DOM trend means longer vacancies and softer asking-rent achievability than the comps imply.
- What's the recent tenant-quality profile in this submarket — average credit score on applications, eviction rate, late-payment / NSF rate, and stable-employment percentage? A property-management company in the area should have these aggregated.
- How much new for-sale + rental construction is in the pipeline within 1–3 miles? Heavy new supply typically softens prices + rents 12–24 months out; constrained supply supports both.
Investment metrics
- 1% rule
- 1.29% ✓
- Cap rate
- 10.47%
- Cash-on-cash
- 14.93%
- DSCR
- 1.66
- GRM
- 6.5
CMA / ARV
- ARV (on-the-fly)
- $347,464
- Comps found
- 12
Show comp detail 12 sales within ~0.75 mi
| Address | Dist | Beds/Ba | Sqft | Sold | Price | $/sf | Match |
|---|---|---|---|---|---|---|---|
| 58910 Main St | 0.26mi | 4/2.0 (+1) | 2,100 (+2%) | 3mo | $218,000 | $104 | 73 |
| 30367 Margo Dr | 0.34mi | 3/2.0 | 2,000 (-3%) | 4mo | $334,500 | $167 | 72 |
| 58656 Cogswell Ct | 0.48mi | 3/2.5 | 2,074 (+1%) | 6mo | $375,000 | $181 | 65 |
| 30185 Carl St | 0.39mi | 3/1.5 | 1,873 (-9%) | 4mo | $185,000 | $99 | 62 |
| 58302 Pembrooke Ave | 0.69mi | 3/2.5 | 2,052 (-0%) | 2mo | $384,465 | $187 | 60 |
| 58254 Pembrooke Ave | 0.72mi | 3/2.5 | 2,052 (-0%) | 1mo | $362,680 | $177 | 59 |
| 32176 Montclair St | 0.73mi | 3/2.5 | 2,064 (+0%) | 1mo | $260,000 | $126 | 58 |
| 58151 Kincaid St | 0.68mi | 3/2.5 | 2,052 (-0%) | 5mo | $372,285 | $181 | 58 |
| 32170 Bradford St | 0.69mi | 3/2.5 | 2,086 (+2%) | 4mo | $349,500 | $168 | 56 |
| 32202 Bradford St | 0.72mi | 3/2.5 | 2,074 (+1%) | 4mo | $350,000 | $169 | 56 |
| 59033 Amherst Ave | 0.56mi | 3/2.5 | 1,793 (-13%) | 5mo | $255,000 | $142 | 42 |
| 58278 Pembrooke Ave | 0.71mi | 4/2.5 (+1) | 2,347 (+14%) | 5mo | $415,110 | $177 | 28 |
Match score weights: distance 35% · size 25% · config 20% · recency 20%. Top-matched comps best support the ARV.
Projected returns pro-forma
-3.0% appreciation · 3.0% rent growth · sell at horizon
- IRR
- 5.5%
- Equity multiple
- 1.21×
- Total profit
- $8,080
- Equity at exit
- $20,129
- IRR
- 14.9%
- Equity multiple
- 2.21×
- Total profit
- $45,630
- Equity at exit
- $11,672
Cash invested: $37,800 (down + closing). Projections, not guarantees.
Landlord ↔ Tenant lean methodology
- Overall (STATE)
- 62 Landlord-Friendly
- State Michigan
- 62 Landlord-Friendly · EVEN
- County
- — inherits STATE
- City
- — inherits STATE
ZIP-level market 48048
- Active inventory
- 101
- Price-to-rent
- 6.5×
Monthly cashflow live
- Estimated rent
- $1,738 medium interval (Pro) →
- Mortgage (P&I)
- −$708
- Tax from tax record
- −$139 /mo · $1,667/yr
- Insurance
- −$56
- HOA
- −$0
- Vacancy / Maint / Mgmt
- −$365
- Net cashflow
- $470
Break-even live
UW: 25.0% down · 7.5% · 30yr · 1.5% tax · 5.0% vac · 8.0% maint · 8.0% mgmt
Financing live
Cash to close
- Down payment
- $33,750
- Closing costs
- $4,050
- Reserves months
- —
- Total cash needed
- —
Loan-product check · same deal, 3 products live
Conventional
25% down · 7.5% · 30yr
- Down + closing
- —
- Monthly P&I
- —
- Monthly cashflow
- —
- DSCR
- —
- Eligible?
- —
Personal DTI + credit; lowest rate.
DSCR
20% down · 8.5% · 30yr
- Down + closing
- —
- Monthly P&I
- —
- Monthly cashflow
- —
- DSCR
- —
- Eligible?
- —
No personal income docs; deal must DSCR.
Hard money
10% down · 12.0% · 12mo
- Down + closing
- —
- Monthly P&I
- —
- Monthly cashflow
- —
- DSCR
- —
- Eligible?
- —
Short-term bridge; refi at stabilization.
Listing history 2 events
-
2026-05-21$135,000 Active
Show marketing remark (1120 chars)
Step into a piece of New Haven history with this remarkable 1890 historic home. Spanning over 2,000 square feet of living space, this property offers incredible bones and a solid foundation for anyone looking to restore a classic Michigan estate. Featuring 4 spacious bedrooms and 1.5 bathrooms, the residence retains its original character while being completely functional for modern living. The main structure is in remarkably great shape given its century-plus heritage, sitting on a solid Michigan basement with fully functional mechanicals already in place. One of the most exciting features is the unfinished third-story attic space, which boasts a walk-out balcony that could easily become a spectacular primary suite, home office, or studio. Outside, the property includes a large 2.5-car detached garage, providing ample storage and workshop space. While the home needs a ton of updates to fully restore its original luster, it represents a rare investment opportunity in a growing Macomb County community. Whether you are an investor or a historic home enthusiast, this property is ready for its next chapter.
-
2026-05-21$135,000 Active 1120-char remark
Show marketing remark (1120 chars)
Step into a piece of New Haven history with this remarkable 1890 historic home. Spanning over 2,000 square feet of living space, this property offers incredible bones and a solid foundation for anyone looking to restore a classic Michigan estate. Featuring 4 spacious bedrooms and 1.5 bathrooms, the residence retains its original character while being completely functional for modern living. The main structure is in remarkably great shape given its century-plus heritage, sitting on a solid Michigan basement with fully functional mechanicals already in place. One of the most exciting features is the unfinished third-story attic space, which boasts a walk-out balcony that could easily become a spectacular primary suite, home office, or studio. Outside, the property includes a large 2.5-car detached garage, providing ample storage and workshop space. While the home needs a ton of updates to fully restore its original luster, it represents a rare investment opportunity in a growing Macomb County community. Whether you are an investor or a historic home enthusiast, this property is ready for its next chapter.
ⓘ Source: listings_history table (triggers on properties + properties_extension) + one-shot
backfill from property_details.listing_events for pre-trigger history.
Tax reassessment forecast MI · Partial reset (capped growth)
- Current annual tax
- $1,667 · $139/mo
- Projected year-2 tax
- $1,873 · $156/mo
- Expected delta
- +$206/yr (+$17/mo · 12.4%)
ⓘ Screening estimate from a state-policy table — verify with the county assessor before closing.
Climate risk First Street
- Flood 1/10 Low FEMA zone X (unshaded) · 0% chance over 30 yrs
- Wildfire 1/10 Low
- Heat 3/10 Moderate 7 d/yr ≥96°F today · 15 d/yr by 30 yrs out
- Wind 1/10 Low
- Air quality 4/10 Moderate 4 unhealthy d/yr today · 5 by 30 yrs out
Nearby sold comps map
Loading sold comps map…
Walkable amenities ~0.75 mi
Loading nearby amenities…
Taxation est. · year 1
- Rental income
- $20,861
- − Mortgage interest
- −$7,562
- − Property taxes
- −$1,667
- − Insurance
- −$675
- − Repairs & maintenance
- −$1,669
- − Management
- −$1,669
- − Depreciation
- −$3,927
- Taxable income
- $3,692
- Est. tax owed @ 24.0%
- −$886
- After-tax cash flow
- $4,756/yr
For passive investors: Depreciation is non-cash, so a rental often shows a tax loss while cash-flowing — sheltering income. Rental losses are passive: they offset passive income freely, and up to $25,000/yr can offset ordinary (W-2) income if you actively participate and your MAGI is under $100k (phasing out to $0 by $150k); unused losses carry forward. On sale, claimed depreciation is recaptured at up to 25%, and gains may owe capital-gains tax (a 1031 exchange can defer both). Figures are a year-1 estimate at your 24.0% rate — not tax advice; consult a CPA.
Schools (NCES district)
- District
- New Haven Community Schools
- NCES district ID
- 2625230
- Math proficiency
- 25% ▼ -5.00%
- Reading proficiency
- 39% ▼ -5.00%
- Median HH income
- $64,247
- Composite
- 29.17/100
- National rank
- #6575
- State rank
- #305 of 540 in MI
Livability — New Haven
- Score
- 57/100
- State rank
- #650
- US rank
- #22110
Category grades
Schools grade is shown separately in the Schools card above.
Census & demographics
- Census place
- New Haven, MI
- City population
- 11,065
- Population (ZIP)
- 11,065
Population outlook (Macomb County) Hauer SSP2
- Today (2025)
- 925,296 people
- By 2030
- 948,226 · +2.5%
- By 2040
- 983,961 · +6.3%
- By 2050
- 1,010,200 · +9.2%
- By 2075
- 1,076,222 · +16.3%
- By 2100
- 1,077,065 · +16.4%
Race, ethnicity, and origin ACS 2023
- Neighborhood character
- Predominantly White (73%)
- Race & ethnicity
- White 73% Black 13% Two or more races 10% Hispanic / Latino 4%
- Common ancestry
- Romanian 10% Italian 7% Lithuanian 3%
- Foreign-born
- 1% · Canada
- Languages at home
- 97% English-only · Spanish 1% Russian/Polish/Slavic 1%
Political lean MEDSL · Macomb
- 2024 margin
- R (+13.7) · D 42.2% · R 55.9% · Other 1.9%
- 2008→2024 swing
- -22.3pp toward R · 2008: 8.6pp · 2024: -13.7pp
- All cycles
- 2024: R+13.7 2020: R+8.1 2016: R+11.6 2012: D+4.0 2008: D+8.6
Not yet ingested
- Civics
- —
Market trends
- HPI YoY
- ▼ -147.74%
- Current HPI
- 242.3675
- Rent YoY
- —
- Metro
- —
- State GDP YoY
- ▲ 1.37%
- F500 in state
- 28
Industry mix (Fortune 500 HQ in MI)
| Industry | F500 HQs | Revenue |
|---|---|---|
| Automotive Parts | 3 | $48B |
|
||
| Automotive | 2 | $372B |
|
||
| Chemicals | 1 | $45B |
|
||
| Automotive Retail | 1 | $29B |
|
||
| Healthcare / Medical Devices | 1 | $23B |
|
||
| Automotive Technology | 1 | $20B |
|
||
Price history
+0.0% since first listed2 events — show timeline
- 2026-05-21 Listed $135,000 MiRealSource-MiMLS
- 2026-05-21 Listed $135,000 REALCOMP
Property tax history
+2.1%/yrLatest (2025): $1,667 · +2.9% YoY. Source: county tax records.
Cash-flow waterfall
monthlySold comps — $/sqft
last 12 mo · ≤1 miLoading sold comps…