 Multi-family
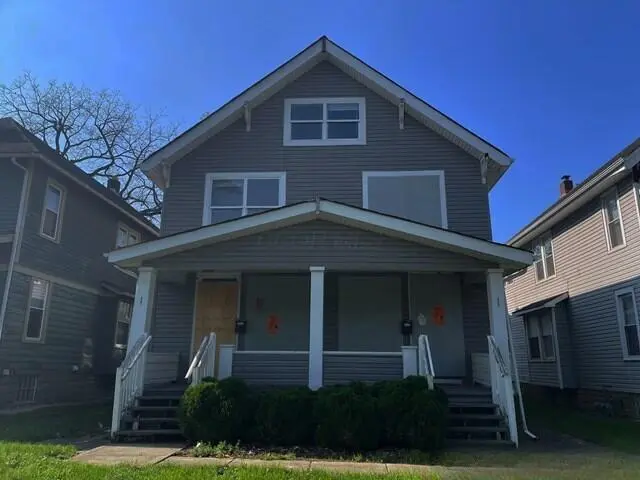
407 E 13th Ave #405 · Columbus, OH
Flood risk 1/10 · Minimal
- FEMA flood zone
- X (unshaded)
- Chance of flooding over 30 yrs
- 0.0%
- Est. flood insurance / yr
- $473 – $860
Fire risk 1/10 · Minimal
- Est. fire insurance / yr
- $713 – $1,323
Heat risk 4/10 · Minor
- Hot days now (above 100°F)
- 7 days/yr
- Hot days in 30 yrs
- 18 days/yr
Wind risk 2/10 · Minimal
- Chance of severe wind over 30 yrs
- 1.0%
Air-quality risk 3/10 · Minor
- Unhealthy air days now
- 2 days/yr
- Unhealthy air days in 30 yrs
- 4 days/yr
Risk factors via First Street. Map © Google.
Why this score? — see what drove the C+ grade
The composite is a weighted blend of 9 inputs, each scored 0–100. Each bar is that input's sub-score; the figure is the points it added to the 100-point composite (weight × sub-score).
- Cash flow +21.5/30.0
- ARV discount +15.0/15.0
- DSCR +6.9/10.0
- 1% rule +5.6/10.0
- Livability +4.0/5.0
- Rent growth +3.0/5.0
- Condition / age +2.5/5.0
- Schools +1.7/10.0
- Appreciation +0.0/10.0
$424,900
🖨 Deal sheet 📄 Offer letter ✓ Due diligence
Multi-family units
County records classify this as Multi-Family (2-4 Unit). Listing-text estimate: 1 unit. estimate disagrees with records
Listing remarks
Amazing opportunity to buy in the campus district. This property has 6 bedrooms and 4 baths with an additional 4 bedrooms and 1 bath in the basement. The top level of the home also has 2 loft areas for extra seating or office space. There is a large amount of parking in the back as well as street parking. Call your Realtor today and make it your next purchase.
Key facts
- Loft areas
- Campus district
- 6,098 sq ft lot
Tags
Property features AI
Finance
- Financial info: Property listed as Real Estate Owned
Exterior
- Utilities: Public water; Public sewer; Natural gas available; Electricity available; Storm sewer
- Home design: Duplex; Built in 1900; Unit address includes #405
- Exterior features: Lot approximately 0.14 acres; Cross street: Big 4 St
Interior
- Heating & cooling: Central Air; Forced Air
- Interior features: Central air conditioning; Forced air heating
Neighborhood map
What this means for you Summary
Snapshot
- This is a 6-bed/5.0-bath multifamily listed at $425k.
Deal economics
- At list price, monthly cash flow is $637 ($8k/yr) — positive.
- The deal already cash-flows at list — no discount required.
- Meets the 1% rule at list price ($5k rent vs $425k).
- Recommended offer: $412k (3.0% below list) — sets the bar for market timing.
- Cap rate 8.1% vs local median 3.8% in Columbus — top-decile yield for the area; either an underpriced asset or a hidden risk that comps aren't pricing in. Stress-test before assuming the spread holds.
Location & tenants
- Location reads 81/100 on livability (#97 in OH, #1,491 nationally) — a professional / high-income tenant draw. Strengths: commute A+, cost of living A+, housing A+; Watch: employment C-, crime F.
- Columbus City School District (urban): math 15% / reading 26% proficiency, ranked #626 of 656 in OH (top 95%) — low school quality limits family demand, transient renter base, plan for 1-2y turnover; 72% free/reduced lunch — lower-income household profile, screen leases tightly.
- Market conditions: Rents rising (+2.1%/yr); 136 active listings in the ZIP; 7 comparable units currently listed for rent nearby; rentals lingering (median 44d on market — plan ~5-8 weeks vacancy on turnover, expect pricing pressure); 57% of comp listings sitting > 30 days — soft ceiling on asking rent; lower-income renter base — watch delinquency; 8,139 units permitted in Franklin County in 2024 (5,940 in 5+ unit buildings).
- At $4,518/mo this rent would consume 124% of the median local household income ($44k/yr) (locally 4913% of renters already pay >50% of income on rent) — very limited rent-growth headroom before tenants either downsize or default.
Forward outlook
- Local home prices are declining (-3.0%/yr); year-one equity from $3k of loan paydown is wiped out by about $13k of value loss. Plan a longer hold.
- Franklin County population projected at +34% by 2050 — long-run rental-demand tailwind backs the buy-and-hold thesis.
Negotiation context
- It's been on market 43 days — a 3% lower offer ($412k) is reasonable based on typical stale-listing flexibility.
- 7 sale attempts since 6y ago with the ask held roughly flat each time — persistent listings suggest the price (not the market) is what's stuck; bring a comps-based counter.
Risks & watch-outs
- Watch-outs: built in 1900 — expect roof / HVAC / electrical / plumbing capex.
Questions for the listing agent
- It's been on market 43 days. Have you received any prior offers? Is the seller open to a 3% concession, seller financing, or rate buy-down credit?
- Built in 1900 — when were the roof, HVAC, electrical panel, plumbing, and water heater last replaced?
- Is there a deadline driving the sale (1031 exchange, divorce, estate, relocation)? That informs how much negotiation room exists.
- Crime grade is F in this area — have there been break-ins, vandalism, or insurance claims at this property in the last 3 years? What carrier currently insures it and at what premium?
- What's the average days-on-market for RENTAL listings here right now (not sales)? A rising rental-DOM trend means longer vacancies and softer asking-rent achievability than the comps imply.
- What's the recent tenant-quality profile in this submarket — average credit score on applications, eviction rate, late-payment / NSF rate, and stable-employment percentage? A property-management company in the area should have these aggregated.
- How much new apartment / multifamily construction is in the pipeline within 1–3 miles? Heavy new supply (>2% of stock underway) typically softens rents 12–24 months out; light construction supports rent growth.
Investment metrics
- 1% rule
- 1.06% ✓
- Cap rate
- 8.09%
- Cash-on-cash
- 6.42%
- DSCR
- 1.29
- GRM
- 7.8
CMA / ARV
- ARV (median comp)
- $520,341
- List price
- $424,900
- Delta
- -18.34%
- Verdict
- UNDERPRICED
- Comps
- 20 within 1.0 mi
Show comp detail 6 sales within ~0.75 mi
| Address | Dist | Beds/Ba | Sqft | Sold | Price | $/sf | Match |
|---|---|---|---|---|---|---|---|
| 401 - 403 E 13th Ave | 0.01mi | 7/2.0 (+1) | 2,952 (+5%) | 7mo | $435,000 | $147 | 69 |
| 1357-59 N 6th St | 0.42mi | 6/— | 2,621 (-7%) | 1mo | $435,000 | $166 | 68 |
| 1243 N 5th St | 0.60mi | 5/— (-1) | 2,632 (-6%) | 8mo | $368,100 | $140 | 49 |
| 1285-1287 N 5th St | 0.54mi | 5/4.5 (-1) | 3,042 (+8%) | 15mo | $515,000 | $169 | 41 |
| 1214 Summit St #1212 | 0.72mi | 5/— (-1) | 2,657 (-6%) | 16mo | $440,000 | $166 | 39 |
| 1268-1270 Courtland Ave | 0.74mi | 6/— | 2,504 (-11%) | 19mo | $537,000 | $214 | 31 |
Match score weights: distance 35% · size 25% · config 20% · recency 20%. Top-matched comps best support the ARV.
Projected returns pro-forma
-3.0% appreciation · 2.14% rent growth · sell at horizon
- IRR
- -7.4%
- Equity multiple
- 0.73×
- Total profit
- $-32,116
- Equity at exit
- $63,354
- IRR
- 1.1%
- Equity multiple
- 1.07×
- Total profit
- $8,879
- Equity at exit
- $36,738
Cash invested: $118,972 (down + closing). Projections, not guarantees.
Landlord ↔ Tenant lean methodology
- Overall (STATE)
- 73 Landlord-Friendly
- State Ohio
- 73 Landlord-Friendly · R+6
- County
- — inherits STATE
- City
- — inherits STATE
ZIP-level market 43201
- Rents YoY
- 2.1%
- Active inventory
- 136
- Price-to-rent
- 31.4×
Monthly cashflow live
- Estimated rent
- $4,518 high interval (Pro) →
- Mortgage (P&I)
- −$2,228
- Tax from tax record
- −$527 /mo · $6,328/yr
- Insurance
- −$177
- HOA
- −$0
- Vacancy / Maint / Mgmt
- −$949
- Net cashflow
- $637
Break-even live
4-unit breakdown (identical units grouped — click to expand)
| Units | Beds | Baths | Est. rent |
|---|---|---|---|
| 4× units | 2 | 1 | $4,516 |
| #1 | 2 | 1 | $1,129 |
| #2 | 2 | 1 | $1,129 |
| #3 | 2 | 1 | $1,129 |
| #4 | 2 | 1 | $1,129 |
| Total (4 units) | $4,518 | ||
UW: 25.0% down · 7.5% · 30yr · 1.5% tax · 5.0% vac · 8.0% maint · 8.0% mgmt
Financing live
Cash to close
- Down payment
- $106,225
- Closing costs
- $12,747
- Reserves months
- —
- Total cash needed
- —
Loan-product check · same deal, 3 products live
Conventional
25% down · 7.5% · 30yr
- Down + closing
- —
- Monthly P&I
- —
- Monthly cashflow
- —
- DSCR
- —
- Eligible?
- —
Personal DTI + credit; lowest rate.
DSCR
20% down · 8.5% · 30yr
- Down + closing
- —
- Monthly P&I
- —
- Monthly cashflow
- —
- DSCR
- —
- Eligible?
- —
No personal income docs; deal must DSCR.
Hard money
10% down · 12.0% · 12mo
- Down + closing
- —
- Monthly P&I
- —
- Monthly cashflow
- —
- DSCR
- —
- Eligible?
- —
Short-term bridge; refi at stabilization.
Rent comps 7 comps
| Address | Beds | Baths | Sqft | Rent | $/sqft | DOM | Units | Dist |
|---|---|---|---|---|---|---|---|---|
| 321 E 17th Ave Columbus, OH | 6.0 | 3.0 | 2300 | $3,200 | $1.39 | 43d | 1 | 0.34mi |
| 356 E 20th Ave Columbus, OH | 5.0 | 3.0 | 2547 | $3,000 | $1.18 | 43d | 1 | 0.55mi |
| 2040 Iuka Ave Columbus, OH | 1.0–5.0 | 1.0–2.5 | 3000 | $3,250 | $1.08 | 14d | 3 | 0.60mi |
| 1329 Indianola Ave Unit 1407030P Columbus, OH | 6.0 | 2.5 | 3498 | $8,656 | $2.47 | 21d | 1 | 0.64mi |
| 1329 Indianola Ave Unit 1407025P Columbus, OH | 5.0 | 2.5 | 3498 | $8,624 | $2.47 | 23d | 1 | 0.64mi |
| 1438 Hunter Ave #1440 Columbus, OH | 5.0 | 2.5 | 2050 | $2,500 | $1.22 | 43d | 1 | 0.83mi |
| 294 King Ave Columbus, OH | 5.0 | 3.0 | 2500 | $2,395 | $0.96 | 43d | 1 | 1.06mi |
Listing history 39 events
-
2026-06-18days on market $424,900 Active 43 DOM
-
2026-06-17days on market $424,900 Active 42 DOM
-
2026-06-16days on market $424,900 Active 41 DOM
-
2026-06-15days on market $424,900 Active 40 DOM
-
2026-06-13days on market $424,900 Active 38 DOM
-
2026-06-13pricedays on market $424,900 Active 37 DOM
-
2026-06-09days on market $439,900 Active 34 DOM
-
2026-06-08days on market $439,900 Active 33 DOM
-
2026-06-07days on market $439,900 Active 32 DOM
-
2026-06-05days on market $439,900 Active 29 DOM
-
2026-06-03days on market $439,900 Active 28 DOM
-
2026-06-02days on market $439,900 Active 27 DOM
-
2026-06-01days on market $439,900 Active 26 DOM
-
2026-05-31days on market $439,900 Active 25 DOM
-
2026-05-06$439,900 Active 362-char remark
-
2024-02-16status Pending
-
2024-02-16historical
-
2024-02-10price $599,900
-
2024-02-10status Active
-
2024-01-31historical Contingent Finance and Inspection
-
2023-12-28price $622,500
-
2023-11-28price $625,000
-
2023-11-24price $629,500
-
2023-11-24status Active
-
2023-11-17historical Contingent Finance and Inspection
-
2023-11-15$629,900 Active
-
2022-10-27historical Contingent Finance and Inspection
-
2022-10-27historical
-
2022-10-20price $649,000
-
2022-10-17status Active
-
2022-09-26historical Contingent Finance and Inspection
-
2022-09-19$689,000 Active
-
2020-12-22soldstatus $599,900 Closed
-
2020-11-24historical Contingent Finance and Inspection
-
2020-11-18$599,900 Active
-
2017-05-03soldstatus $241,000
-
2017-02-16soldstatus $215,000
-
2015-08-11soldstatus $65,000
-
1978-01-01soldstatus $21,000
ⓘ Source: listings_history table (triggers on properties + properties_extension) + one-shot
backfill from property_details.listing_events for pre-trigger history.
Tax reassessment forecast OH · Partial reset (capped growth)
- Current annual tax
- $6,328 · $527/mo
- Projected year-2 tax
- $6,478 · $540/mo
- Expected delta
- +$150/yr (+$13/mo · 2.4%)
ⓘ Screening estimate from a state-policy table — verify with the county assessor before closing.
Climate risk First Street
- Flood 1/10 Low FEMA zone X (unshaded) · 0% chance over 30 yrs
- Wildfire 1/10 Low
- Heat 4/10 Moderate 7 d/yr ≥100°F today · 18 d/yr by 30 yrs out
- Wind 2/10 Low 100% chance of damaging wind over 30 yrs
- Air quality 3/10 Moderate 2 unhealthy d/yr today · 4 by 30 yrs out
Nearby sold comps map
Loading sold comps map…
Walkable amenities ~0.75 mi
Loading nearby amenities…
Taxation est. · year 1
- Rental income
- $54,216
- − Mortgage interest
- −$23,801
- − Property taxes
- −$6,328
- − Insurance
- −$2,124
- − Repairs & maintenance
- −$4,337
- − Management
- −$4,337
- − Depreciation
- −$12,361
- Taxable income
- $927
- Est. tax owed @ 24.0%
- −$223
- After-tax cash flow
- $7,417/yr
For passive investors: Depreciation is non-cash, so a rental often shows a tax loss while cash-flowing — sheltering income. Rental losses are passive: they offset passive income freely, and up to $25,000/yr can offset ordinary (W-2) income if you actively participate and your MAGI is under $100k (phasing out to $0 by $150k); unused losses carry forward. On sale, claimed depreciation is recaptured at up to 25%, and gains may owe capital-gains tax (a 1031 exchange can defer both). Figures are a year-1 estimate at your 24.0% rate — not tax advice; consult a CPA.
Schools (NCES district)
- District
- Columbus City School District
- NCES district ID
- 3904380
- Math proficiency
- 15% ▼ -17.00%
- Reading proficiency
- 26% ▼ -12.00%
- Median HH income
- $38,483
- Composite
- 17.19/100
- National rank
- #9105
- State rank
- #626 of 656 in OH
Livability — Columbus
- Score
- 81/100
- State rank
- #97
- US rank
- #1491
Category grades
Schools grade is shown separately in the Schools card above.
Census & demographics
- Census place
- Columbus, OH
- County
- Franklin County · 1,351,780 people
- City population
- 612,189
- Metro
- Columbus, OH
- Population (ZIP)
- 34,322
- Household income
- $43,731
- Rent vs Own
- Severe rent burden
- 4913.0
Population outlook (Franklin County) Hauer SSP2
- Today (2025)
- 1,456,139 people
- By 2030
- 1,556,890 · +6.9%
- By 2040
- 1,757,349 · +20.7%
- By 2050
- 1,950,539 · +34.0%
- By 2075
- 2,376,171 · +63.2%
- By 2100
- 2,636,796 · +81.1%
Race, ethnicity, and origin ACS 2023
- Neighborhood character
- Predominantly White (68%)
- Race & ethnicity
- White 68% Black 14% Two or more races 8% Asian 7% Hispanic / Latino 5%
- Hispanic origin (detail)
- Mexican 1% Puerto Rican 1%
- Common ancestry
- Romanian 4% Lithuanian 2% Italian 2%
- Foreign-born
- 8% · Canada, China, Jamaica
- Languages at home
- 90% English-only · Chinese 3% Spanish 2% Other Indo-European 2%
Political lean MEDSL · Franklin
- 2024 margin
- Strong D (+28.4) · D 63.7% · R 35.3% · Other 1.0%
- 2008→2024 swing
- +7.7pp toward D · 2008: 20.7pp · 2024: 28.4pp
- All cycles
- 2024: D+28.4 2020: D+31.4 2016: D+25.9 2012: D+21.7 2008: D+20.7
Not yet ingested
- Civics
- —
Market trends
- HPI YoY
- ▼ -207.90%
- Current HPI
- 321.7282
- Rent YoY
- ▲ 2.14%
- Metro
- Columbus, OH
- State GDP YoY
- ▲ 1.98%
- F500 in state
- 48
Industry mix (Fortune 500 HQ in OH)
| Industry | F500 HQs | Revenue |
|---|---|---|
| Insurance | 3 | $145B |
|
||
| Industrial Machinery | 3 | $49B |
|
||
| Financial Services | 3 | $24B |
|
||
| Consumer Goods | 2 | $93B |
|
||
| Aerospace / Defense | 2 | $47B |
|
||
| Utilities | 2 | $33B |
|
||
Price history
+1923.3% since first listed26 events — show timeline
- 2026-06-10 Price Changed $424,900 CBRMLS
- 2026-05-06 Listed $439,900 CBRMLS
- 2024-02-16 Pending — CBRMLS
- 2024-02-16 Listing Removed — CBRMLS
- 2024-02-10 Price Changed $599,900 CBRMLS
- 2024-02-10 Relisted — CBRMLS
- 2024-01-31 Contingent — CBRMLS
- 2023-12-28 Price Changed $622,500 CBRMLS
- 2023-11-28 Price Changed $625,000 CBRMLS
- 2023-11-24 Price Changed $629,500 CBRMLS
- 2023-11-24 Relisted — CBRMLS
- 2023-11-17 Contingent — CBRMLS
- 2023-11-15 Listed $629,900 CBRMLS
- 2022-10-27 Contingent — CBRMLS
- 2022-10-27 Listing Removed — CBRMLS
- 2022-10-20 Price Changed $649,000 CBRMLS
- 2022-10-17 Relisted — CBRMLS
- 2022-09-26 Contingent — CBRMLS
- 2022-09-19 Listed $689,000 CBRMLS
- 2020-12-22 Sold (MLS) $599,900 CBRMLS
- 2020-11-24 Contingent — CBRMLS
- 2020-11-18 Listed $599,900 CBRMLS
- 2017-05-03 Sold (Public Records) $241,000 Public Records
- 2017-02-16 Sold (Public Records) $215,000 Public Records
- 2015-08-11 Sold (Public Records) $65,000 Public Records
- 1978-01-01 Sold (Public Records) $21,000 Public Records
Property tax history
+14.8%/yrLatest (2024): $6,328 · -1.1% YoY. Source: county tax records.
Cash-flow waterfall
monthlySold comps — $/sqft
last 12 mo · ≤1 miLoading sold comps…