 Multi-family
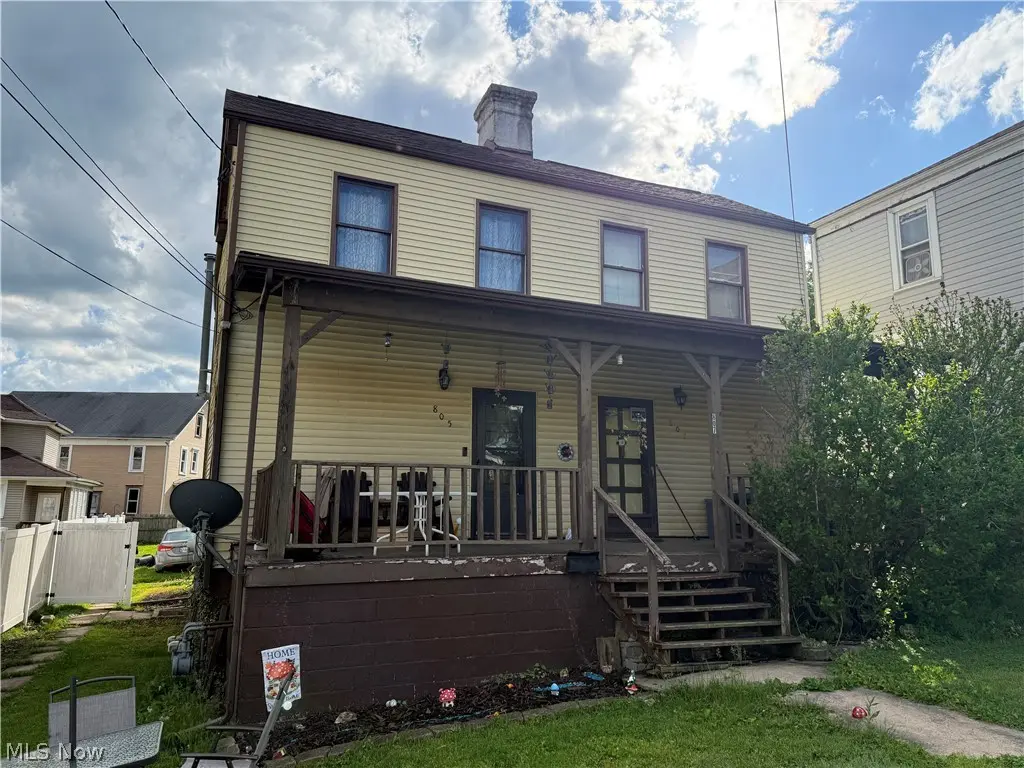
805 Hickory St · Martins Ferry, OH
Flood risk 1/10 · Minimal
- FEMA flood zone
- X (unshaded)
- Chance of flooding over 30 yrs
- 0.0%
- Est. flood insurance / yr
- $473 – $860
Fire risk 1/10 · Minimal
- Est. fire insurance / yr
- $713 – $1,323
Heat risk 4/10 · Minor
- Hot days now (above 98°F)
- 8 days/yr
- Hot days in 30 yrs
- 21 days/yr
Wind risk 1/10 · Minimal
- Chance of severe wind over 30 yrs
- —
Air-quality risk 2/10 · Minimal
- Unhealthy air days now
- 1 days/yr
- Unhealthy air days in 30 yrs
- 2 days/yr
Risk factors via First Street. Map © Google.
Why this score? — see what drove the D+ grade
The composite is a weighted blend of 9 inputs, each scored 0–100. Each bar is that input's sub-score; the figure is the points it added to the 100-point composite (weight × sub-score).
- Cash flow +15.0/30.0
- ARV discount +7.5/15.0
- 1% rule +5.0/10.0
- DSCR +5.0/10.0
- Schools +4.0/10.0
- Livability +3.6/5.0
- Rent growth +2.5/5.0
- Condition / age +2.5/5.0
- Appreciation +0.0/10.0
$35,000
🖨 Deal sheet 📄 Offer letter ✓ Due diligence
Multi-family units
County records classify this as Multi-Family (2-4 Unit). Listing-text estimate: 1 unit. estimate disagrees with records
Listing remarks
COMP ONLY. 1/2 of side by side duplex. New survey split duplex and property in half.
Key facts
- 3,510 sq ft lot
- Built 1910
Property features AI
Finance
- Financial info: Annual tax information available
Exterior
- Parking: On-street parking
- Utilities: Public water; Public sewer
- Home design: Two-story home; Property is attached
- Construction: Vinyl siding; Asphalt shingle roof; Block foundation; Built according to public records
- Exterior features: Public water; Public sewer
Interior
- Bedrooms: 5 total rooms (bedrooms included)
- Bathrooms: 1 full bathroom
- Heating & cooling: Forced-air gas heating
- Interior features: Full unfinished basement
Neighborhood map
What this means for you Summary
Snapshot
- This is a 2-bed/2.0-bath multifamily listed at $35k.
Deal economics
- At list price, monthly cash flow is $2k ($20k/yr) — positive.
- The deal already cash-flows at list — no discount required.
- Meets the 1% rule at list price ($2k rent vs $35k).
- Cap rate 64.5% vs local median 8.3% in Martins Ferry — top-decile yield for the area; either an underpriced asset or a hidden risk that comps aren't pricing in. Stress-test before assuming the spread holds.
Location & tenants
- Location reads 71/100 on livability (#423 in OH) — a middle-class / working-renter tenant base. Strengths: cost of living A+, housing A+, health & safety A-; Watch: amenities F, commute F, employment F.
- Martins Ferry City (suburban): math 42% / reading 54% proficiency, ranked #483 of 656 in OH (top 74%) — families likely to look elsewhere, expect single-tenant / working-renter base with shorter leases; 61% free/reduced lunch — lower-income household profile, screen leases tightly.
- Market conditions: 32 active listings in the ZIP; 4 units permitted in Belmont County in 2024 (0 in 5+ unit buildings).
- At $2,465/mo this rent would consume 59% of the median local household income ($50k/yr) — very limited rent-growth headroom before tenants either downsize or default.
Forward outlook
- Local home prices are declining (-3.0%/yr); year-one equity from $242 of loan paydown is wiped out by about $1k of value loss. Plan a longer hold.
- Belmont County population projected at -15% by 2050 — secular population decline; favor cash flow + early exit over multi-decade hold.
- At projected returns (-3.0% appreciation + 3.0% rent growth), your $10k cash investment doubles in ~1 year — after that, you're playing with house money.
Negotiation context
- Only 1 days on market — expect competitive offers; lowballing is unlikely to land.
Risks & watch-outs
- Watch-outs: built in 1910 — expect roof / HVAC / electrical / plumbing capex.
Questions for the listing agent
- Built in 1910 — when were the roof, HVAC, electrical panel, plumbing, and water heater last replaced?
- Is there a deadline driving the sale (1031 exchange, divorce, estate, relocation)? That informs how much negotiation room exists.
- Schools are B-rated — typically a magnet for longer-tenancy family renters. What's the average tenant stay here, and is there a school-zone premium baked into asking?
- The area grade is low — what's the realistic commute time and amenity access for the typical tenant pool here? Any planned neighborhood developments (good or bad) we should know about?
- What's the average days-on-market for RENTAL listings here right now (not sales)? A rising rental-DOM trend means longer vacancies and softer asking-rent achievability than the comps imply.
- What's the recent tenant-quality profile in this submarket — average credit score on applications, eviction rate, late-payment / NSF rate, and stable-employment percentage? A property-management company in the area should have these aggregated.
- How much new apartment / multifamily construction is in the pipeline within 1–3 miles? Heavy new supply (>2% of stock underway) typically softens rents 12–24 months out; light construction supports rent growth.
Investment metrics
- 1% rule
- 7.04% ✓
- Cap rate
- 64.52%
- Cash-on-cash
- 207.96%
- DSCR
- 10.25
- GRM
- 1.2
CMA / ARV
No comps found within radius.
Projected returns pro-forma
-3.0% appreciation · 3.0% rent growth · sell at horizon
- IRR
- —
- Equity multiple
- 11.46×
- Total profit
- $102,538
- Equity at exit
- $5,219
- IRR
- —
- Equity multiple
- 24.34×
- Total profit
- $228,741
- Equity at exit
- $3,026
Cash invested: $9,800 (down + closing). Projections, not guarantees.
Landlord ↔ Tenant lean methodology
- Overall (STATE)
- 73 Landlord-Friendly
- State Ohio
- 73 Landlord-Friendly · R+6
- County
- — inherits STATE
- City
- — inherits STATE
ZIP-level market 43935
- Home prices YoY
- -12.7%
- Active inventory
- 32
- Price-to-rent
- 2.4×
Monthly cashflow live
- Estimated rent
- $2,465 medium interval (Pro) →
- Mortgage (P&I)
- −$184
- Tax from tax record
- −$51 /mo · $611/yr
- Insurance
- −$15
- HOA
- −$0
- Vacancy / Maint / Mgmt
- −$518
- Net cashflow
- $1,698
Break-even live
2-unit breakdown (identical units grouped — click to expand)
| Units | Beds | Baths | Est. rent |
|---|---|---|---|
| 2× units | 2 | 1 | $2,464 |
| #1 | 2 | 1 | $1,232 |
| #2 | 2 | 1 | $1,232 |
| Total (2 units) | $2,465 | ||
UW: 25.0% down · 7.5% · 30yr · 1.5% tax · 5.0% vac · 8.0% maint · 8.0% mgmt
Financing live
Cash to close
- Down payment
- $8,750
- Closing costs
- $1,050
- Reserves months
- —
- Total cash needed
- —
Loan-product check · same deal, 3 products live
Conventional
25% down · 7.5% · 30yr
- Down + closing
- —
- Monthly P&I
- —
- Monthly cashflow
- —
- DSCR
- —
- Eligible?
- —
Personal DTI + credit; lowest rate.
DSCR
20% down · 8.5% · 30yr
- Down + closing
- —
- Monthly P&I
- —
- Monthly cashflow
- —
- DSCR
- —
- Eligible?
- —
No personal income docs; deal must DSCR.
Hard money
10% down · 12.0% · 12mo
- Down + closing
- —
- Monthly P&I
- —
- Monthly cashflow
- —
- DSCR
- —
- Eligible?
- —
Short-term bridge; refi at stabilization.
Listing history 2 events
-
2026-05-13status Pending
-
2026-05-12$35,000 Active
ⓘ Source: listings_history table (triggers on properties + properties_extension) + one-shot
backfill from property_details.listing_events for pre-trigger history.
Tax reassessment forecast OH · Partial reset (capped growth)
- Current annual tax
- $611 · $51/mo
- Projected year-2 tax
- $611 · $51/mo
- Expected delta
- $0/yr ($0/mo · 0.0%)
ⓘ Screening estimate from a state-policy table — verify with the county assessor before closing.
Climate risk First Street
- Flood 1/10 Low FEMA zone X (unshaded) · 0% chance over 30 yrs
- Wildfire 1/10 Low
- Heat 4/10 Moderate 8 d/yr ≥98°F today · 21 d/yr by 30 yrs out
- Wind 1/10 Low
- Air quality 2/10 Low 1 unhealthy d/yr today · 2 by 30 yrs out
Nearby sold comps map
Loading sold comps map…
Walkable amenities ~0.75 mi
Loading nearby amenities…
Taxation est. · year 1
- Rental income
- $29,580
- − Mortgage interest
- −$1,961
- − Property taxes
- −$611
- − Insurance
- −$175
- − Repairs & maintenance
- −$2,366
- − Management
- −$2,366
- − Depreciation
- −$1,018
- Taxable income
- $21,083
- Est. tax owed @ 24.0%
- −$5,060
- After-tax cash flow
- $15,320/yr
For passive investors: Depreciation is non-cash, so a rental often shows a tax loss while cash-flowing — sheltering income. Rental losses are passive: they offset passive income freely, and up to $25,000/yr can offset ordinary (W-2) income if you actively participate and your MAGI is under $100k (phasing out to $0 by $150k); unused losses carry forward. On sale, claimed depreciation is recaptured at up to 25%, and gains may owe capital-gains tax (a 1031 exchange can defer both). Figures are a year-1 estimate at your 24.0% rate — not tax advice; consult a CPA.
Schools (NCES district)
- District
- Martins Ferry City
- NCES district ID
- 3904434
- Math proficiency
- 42% ▼ -23.00%
- Reading proficiency
- 54% ▼ -9.00%
- Median HH income
- $37,566
- Composite
- 39.89/100
- National rank
- #3859
- State rank
- #483 of 656 in OH
Livability — Martins Ferry
- Score
- 71/100
- State rank
- #423
- US rank
- #6917
Category grades
Schools grade is shown separately in the Schools card above.
Census & demographics
- Census place
- Martins Ferry, OH
- County
- Belmont · 63,139 people
- Metro
- Wheeling, WV-OH
- Population (ZIP)
- 7,918
- Household income
- $50,109
- Rent vs Own
- Severe rent burden
- 2.2
Population outlook (Belmont County) Hauer SSP2
- Today (2025)
- 66,568 people
- By 2030
- 64,818 · -2.6%
- By 2040
- 60,702 · -8.8%
- By 2050
- 56,427 · -15.2%
- By 2075
- 46,222 · -30.6%
- By 2100
- 34,611 · -48.0%
Race, ethnicity, and origin ACS 2023
- Neighborhood character
- Predominantly White (84%)
- Race & ethnicity
- White 84% Two or more races 8% Black 5% Asian 3%
- Common ancestry
- Romanian 4% Serbian 1% Lithuanian 1%
- Foreign-born
- 2% · China
- Languages at home
- 98% English-only · Spanish 1% Chinese 1% German/W. Germanic 1%
Political lean MEDSL · Belmont
- 2024 margin
- Solid R (+47.3) · D 26.0% · R 73.3%
- 2008→2024 swing
- -50.0pp toward R · 2008: 2.7pp · 2024: -47.3pp
- All cycles
- 2024: R+47.3 2020: R+43.6 2016: R+39.5 2012: R+8.4 2008: D+2.7
Not yet ingested
- Civics
- —
Market trends
- HPI YoY
- ▼ -25.06%
- Current HPI
- 172.1787
- Rent YoY
- —
- Metro
- —
- State GDP YoY
- ▲ 1.98%
- F500 in state
- 48
Industry mix (Fortune 500 HQ in OH)
| Industry | F500 HQs | Revenue |
|---|---|---|
| Insurance | 3 | $145B |
|
||
| Industrial Machinery | 3 | $49B |
|
||
| Financial Services | 3 | $24B |
|
||
| Consumer Goods | 2 | $93B |
|
||
| Aerospace / Defense | 2 | $47B |
|
||
| Utilities | 2 | $33B |
|
||
Price history
2 events — show timeline
- 2026-05-13 Pending — MLSNOW
- 2026-05-12 Listed $35,000 MLSNOW
Property tax history
+0.5%/yrLatest (2025): $611 · -53.8% YoY. Source: county tax records.
Cash-flow waterfall
monthlySold comps — $/sqft
last 12 mo · ≤1 miLoading sold comps…