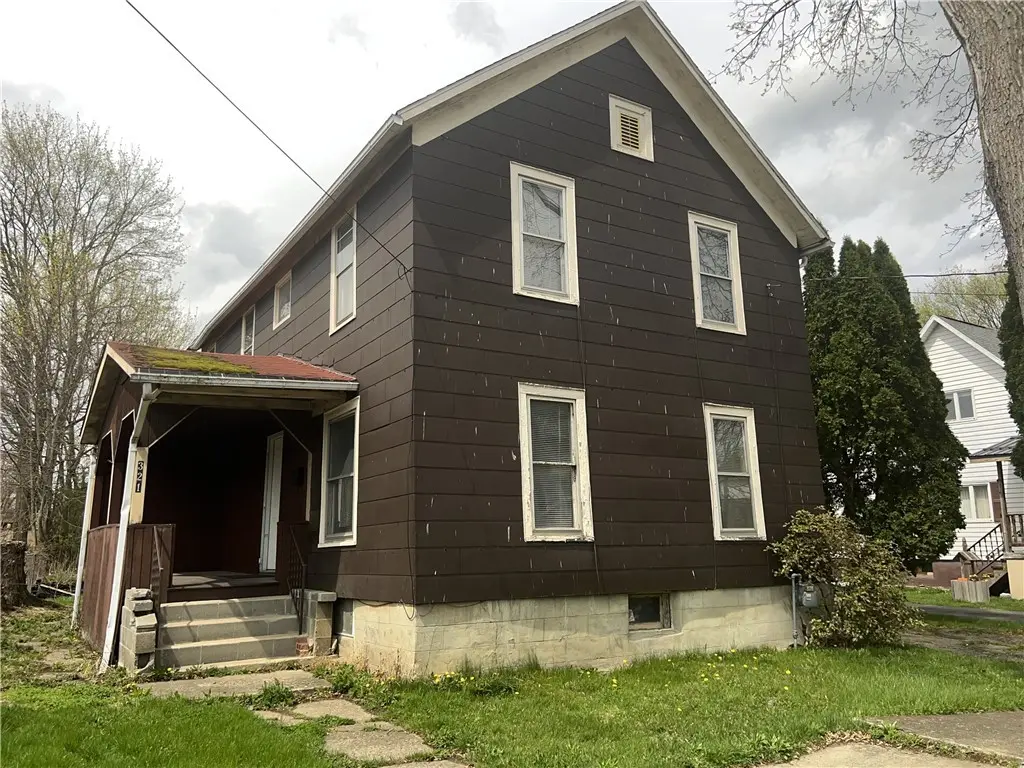
321 Jerome St · Painted Post, NY
Flood risk 1/10 · Minimal
- FEMA flood zone
- X (shaded)
- Chance of flooding over 30 yrs
- 0.0%
- Est. flood insurance / yr
- $473 – $860
Fire risk 3/10 · Minor
- Est. fire insurance / yr
- $691 – $1,283
Heat risk 3/10 · Minor
- Hot days now (above 95°F)
- 8 days/yr
- Hot days in 30 yrs
- 18 days/yr
Wind risk 1/10 · Minimal
- Chance of severe wind over 30 yrs
- 0.0%
Air-quality risk 1/10 · Minimal
- Unhealthy air days now
- 0 days/yr
- Unhealthy air days in 30 yrs
- 0 days/yr
Risk factors via First Street. Map © Google.
Why this score? — see what drove the B grade
The composite is a weighted blend of 9 inputs, each scored 0–100. Each bar is that input's sub-score; the figure is the points it added to the 100-point composite (weight × sub-score).
- Cash flow +30.0/30.0
- 1% rule +10.0/10.0
- DSCR +10.0/10.0
- ARV discount +7.5/15.0
- Schools +4.2/10.0
- Livability +3.8/5.0
- Condition / age +2.5/5.0
- Rent growth +2.2/5.0
- Appreciation +0.0/10.0
$75,000
🖨 Deal sheet 📄 Offer letter ✓ Due diligence
Listing remarks
Looking for an affordable home in Painted Post? This well-maintained three-bedroom, two-and-a-half-bath home is set on a quiet side street in the Village. Inside, the family room offers comfortable living space with good natural light. The eat-in kitchen provides ample room for everyday use, with appliances included. A separate dining room with multiple windows adds flexibility for meals or gatherings. A full bath is also conveniently located on the first floor. Upstairs, the primary bedroom includes an ensuite bath. Two additional bedrooms and a half bath complete the second floor. The half bath is already equipped with power, water, and drain lines, offering potential for a shower, bathtu
Key facts
- Multiple windows
- Enclosed back porch
- Newer roof
Tags
Neighborhood map
What this means for you Summary
Snapshot
- This is a 4-bed/2.0-bath single-family listed at $75k.
Deal economics
- At list price, monthly cash flow is $893 ($11k/yr) — positive.
- The deal already cash-flows at list — no discount required.
- Meets the 1% rule at list price ($2k rent vs $75k).
Location & tenants
- Location reads 75/100 on livability (#255 in NY, #4,036 nationally) — a middle-class / working-renter tenant base. Strengths: crime A+, housing A+, health & safety A+; Watch: amenities D-, commute F.
- Corning City School District (town): math 44% / reading 53% proficiency, ranked #406 of 590 in NY (top 69%) — families likely to look elsewhere, expect single-tenant / working-renter base with shorter leases.
- Market conditions: Rents soft (-1.4%/yr); 44 active listings in the ZIP; 5 comparable units currently listed for rent nearby; rentals lingering (median 44d on market — plan ~5-8 weeks vacancy on turnover, expect pricing pressure); 100% of comp listings sitting > 30 days — soft ceiling on asking rent; solid renter incomes; 196 units permitted in Steuben County in 2024 (0 in 5+ unit buildings).
Forward outlook
- Local home prices are declining (-3.0%/yr); year-one equity from $519 of loan paydown is wiped out by about $2k of value loss. Plan a longer hold.
- Steuben County population projected at -20% by 2050 — secular population decline; favor cash flow + early exit over multi-decade hold.
- At projected returns (-3.0% appreciation + 0.0% rent growth), your $21k cash investment doubles in ~3 years — after that, you're playing with house money.
Negotiation context
- Only 6 days on market — expect competitive offers; lowballing is unlikely to land.
- 3 sale attempts since 22y ago with the ask held roughly flat each time — persistent listings suggest the price (not the market) is what's stuck; bring a comps-based counter.
Risks & watch-outs
- Watch-outs: built in 1900 — expect roof / HVAC / electrical / plumbing capex.
Questions for the listing agent
- Built in 1900 — when were the roof, HVAC, electrical panel, plumbing, and water heater last replaced?
- Is there a deadline driving the sale (1031 exchange, divorce, estate, relocation)? That informs how much negotiation room exists.
- What's the average days-on-market for RENTAL listings here right now (not sales)? A rising rental-DOM trend means longer vacancies and softer asking-rent achievability than the comps imply.
- What's the recent tenant-quality profile in this submarket — average credit score on applications, eviction rate, late-payment / NSF rate, and stable-employment percentage? A property-management company in the area should have these aggregated.
- How much new for-sale + rental construction is in the pipeline within 1–3 miles? Heavy new supply typically softens prices + rents 12–24 months out; constrained supply supports both.
Investment metrics
- 1% rule
- 2.38% ✓
- Cap rate
- 20.58%
- Cash-on-cash
- 51.01%
- DSCR
- 3.27
- GRM
- 3.5
CMA / ARV
- ARV (on-the-fly)
- $198,030
- Comps found
- 12
Show comp detail 12 sales within ~0.75 mi
| Address | Dist | Beds/Ba | Sqft | Sold | Price | $/sf | Match |
|---|---|---|---|---|---|---|---|
| 369 Delaware Ave | 0.13mi | 3/1.5 (-1) | 1,768 (+3%) | 1mo | $217,000 | $123 | 82 |
| 229 Norwood St | 0.15mi | 3/2.0 (-1) | 1,608 (-7%) | 0mo | $180,000 | $112 | 76 |
| 312 Bronson St | 0.09mi | 3/1.5 (-1) | 1,683 (-2%) | 17mo | $135,000 | $80 | 71 |
| 326 N Hamilton St | 0.23mi | 3/1.5 (-1) | 1,824 (+6%) | 7mo | $220,000 | $121 | 67 |
| 204 E High St | 0.13mi | 3/1.5 (-1) | 1,876 (+9%) | 9mo | $135,000 | $72 | 65 |
| 139 Steuben St | 0.42mi | 4/2.5 | 1,910 (+11%) | 1mo | $249,000 | $130 | 59 |
| 220 Rand Ave | 0.52mi | 3/2.0 (-1) | 1,656 (-4%) | 9mo | $240,000 | $145 | 56 |
| 325 Jerome St | 0.01mi | 3/1.5 (-1) | 1,500 (-13%) | 18mo | $111,702 | $74 | 56 |
| 229 Cutler Ave | 0.58mi | 3/1.5 (-1) | 1,822 (+6%) | 5mo | $179,000 | $98 | 52 |
| 464 Pine St | 0.67mi | 3/1.5 (-1) | 1,724 (+0%) | 12mo | $200,000 | $116 | 51 |
| 515 Park Pl | 0.73mi | 3/1.5 (-1) | 1,656 (-4%) | 8mo | $177,000 | $107 | 46 |
| 174 Fuller Ave | 0.69mi | 3/1.0 (-1) | 1,568 (-9%) | 7mo | $180,000 | $115 | 38 |
Match score weights: distance 35% · size 25% · config 20% · recency 20%. Top-matched comps best support the ARV.
Projected returns pro-forma
-3.0% appreciation · 0.0% rent growth · sell at horizon
- IRR
- 45.4%
- Equity multiple
- 2.88×
- Total profit
- $39,496
- Equity at exit
- $11,183
- IRR
- 49.9%
- Equity multiple
- 5.17×
- Total profit
- $87,486
- Equity at exit
- $6,485
Cash invested: $21,000 (down + closing). Projections, not guarantees.
Landlord ↔ Tenant lean methodology
- Overall (STATE)
- 15 Strongly Tenant-Friendly
- State New York
- 15 Strongly Tenant-Friendly · D+10
- County
- — inherits STATE
- City
- — inherits STATE
ZIP-level market 14870
- Home prices YoY
- -28.8%
- Rents YoY
- -1.4%
- Active inventory
- 44
- Price-to-rent
- 3.5×
Monthly cashflow live
- Estimated rent
- $1,786 high interval (Pro) →
- Mortgage (P&I)
- −$393
- Tax est. 1.5%
- −$94 /mo · $1,125/yr
- Insurance
- −$31
- HOA
- −$0
- Vacancy / Maint / Mgmt
- −$375
- Net cashflow
- $893
Break-even live
UW: 25.0% down · 7.5% · 30yr · 1.5% tax · 5.0% vac · 8.0% maint · 8.0% mgmt
Financing live
Cash to close
- Down payment
- $18,750
- Closing costs
- $2,250
- Reserves months
- —
- Total cash needed
- —
Loan-product check · same deal, 3 products live
Conventional
25% down · 7.5% · 30yr
- Down + closing
- —
- Monthly P&I
- —
- Monthly cashflow
- —
- DSCR
- —
- Eligible?
- —
Personal DTI + credit; lowest rate.
DSCR
20% down · 8.5% · 30yr
- Down + closing
- —
- Monthly P&I
- —
- Monthly cashflow
- —
- DSCR
- —
- Eligible?
- —
No personal income docs; deal must DSCR.
Hard money
10% down · 12.0% · 12mo
- Down + closing
- —
- Monthly P&I
- —
- Monthly cashflow
- —
- DSCR
- —
- Eligible?
- —
Short-term bridge; refi at stabilization.
Rent comps 5 comps
| Address | Beds | Baths | Sqft | Rent | $/sqft | DOM | Units | Dist |
|---|---|---|---|---|---|---|---|---|
| 459 Brainard Pl Painted Post, NY | 3.0 | 1.0 | 1090 | $1,500 | $1.38 | 43d | 1 | 0.67mi |
| 209 Oneida Pl Corning, NY | 3.0 | 1.5 | 1200 | $2,000 | $1.67 | 43d | 1 | 0.81mi |
| 247 Princeton Ave Corning, NY | 3.0 | 1.0 | 1504 | $1,500 | $1.00 | 43d | 1 | 0.99mi |
| 137 Field St Corning, NY | 2.0–3.0 | 1.0 | 1125 | $1,345 | $1.20 | 43d | 3 | 1.12mi |
| 12 Pondview Ct Painted Post, NY | 3.0 | 1.0–2.0 | 948 | $1,890 | $1.99 | 43d | 27 | 1.38mi |
Listing history 6 events
-
2026-04-26status Pending
-
2026-04-20$75,000 Active
-
2011-12-24historical
-
2011-06-24$64,900
-
2004-10-22historical
-
2004-07-26$51,900
ⓘ Source: listings_history table (triggers on properties + properties_extension) + one-shot
backfill from property_details.listing_events for pre-trigger history.
Climate risk First Street
- Flood 1/10 Low FEMA zone X (shaded) · 0% chance over 30 yrs
- Wildfire 3/10 Moderate
- Heat 3/10 Moderate 8 d/yr ≥95°F today · 18 d/yr by 30 yrs out
- Wind 1/10 Low 0% chance of damaging wind over 30 yrs
- Air quality 1/10 Low 0 unhealthy d/yr today · 0 by 30 yrs out
Nearby sold comps map
Loading sold comps map…
Walkable amenities ~0.75 mi
Loading nearby amenities…
Taxation est. · year 1
- Rental income
- $21,433
- − Mortgage interest
- −$4,201
- − Property taxes
- −$1,125
- − Insurance
- −$375
- − Repairs & maintenance
- −$1,715
- − Management
- −$1,715
- − Depreciation
- −$2,182
- Taxable income
- $10,121
- Est. tax owed @ 24.0%
- −$2,429
- After-tax cash flow
- $8,283/yr
For passive investors: Depreciation is non-cash, so a rental often shows a tax loss while cash-flowing — sheltering income. Rental losses are passive: they offset passive income freely, and up to $25,000/yr can offset ordinary (W-2) income if you actively participate and your MAGI is under $100k (phasing out to $0 by $150k); unused losses carry forward. On sale, claimed depreciation is recaptured at up to 25%, and gains may owe capital-gains tax (a 1031 exchange can defer both). Figures are a year-1 estimate at your 24.0% rate — not tax advice; consult a CPA.
Schools (NCES district)
- District
- Corning City School District
- NCES district ID
- 3608400
- Math proficiency
- 44% ▼ -12.00%
- Reading proficiency
- 53% ▲ 4.00%
- Median HH income
- $53,042
- Composite
- 41.8/100
- National rank
- #3392
- State rank
- #406 of 590 in NY
Livability — Painted Post
- Score
- 75/100
- State rank
- #255
- US rank
- #4036
Category grades
Schools grade is shown separately in the Schools card above.
Census & demographics
- Census place
- Painted Post, NY
- County
- Steuben County · 41,193 people
- City population
- 9,795
- Metro
- Corning, NY
- Population (ZIP)
- 9,795
- Household income
- $84,476
- Rent vs Own
- Severe rent burden
- 289.0
Population outlook (Steuben County) Hauer SSP2
- Today (2025)
- 93,062 people
- By 2030
- 89,793 · -3.5%
- By 2040
- 82,353 · -11.5%
- By 2050
- 74,286 · -20.2%
- By 2075
- 55,589 · -40.3%
- By 2100
- 37,587 · -59.6%
Race, ethnicity, and origin ACS 2023
- Neighborhood character
- Predominantly White (84%)
- Race & ethnicity
- White 84% Asian 8% Two or more races 5% Black 2% Hispanic / Latino 2%
- Common ancestry
- Romanian 7% Italian 3% Slovak 2%
- Foreign-born
- 8% · China, South Korea, Canada
- Languages at home
- 90% English-only · Chinese 4% Other Indo-European 2% Korean 1%
Political lean MEDSL · Steuben
- 2024 margin
- Solid R (+31.8) · D 34.1% · R 65.9%
- 2008→2024 swing
- -15.0pp toward R · 2008: -16.8pp · 2024: -31.8pp
- All cycles
- 2024: R+31.8 2020: R+29.6 2016: R+36.2 2012: R+16.4 2008: R+16.8
Not yet ingested
- Civics
- —
Market trends
- HPI YoY
- ▼ -70.45%
- Current HPI
- 174.2287
- Rent YoY
- ▼ -1.35%
- Metro
- Corning, NY
- State GDP YoY
- ▲ 2.60%
- F500 in state
- 92
Industry mix (Fortune 500 HQ in NY)
| Industry | F500 HQs | Revenue |
|---|---|---|
| Financial Services | 10 | $950B |
|
||
| Consumer Goods | 9 | $162B |
|
||
| Insurance | 4 | $225B |
|
||
| Telecommunications | 2 | $144B |
|
||
| Pharmaceuticals | 2 | $112B |
|
||
| Media / Entertainment | 2 | $69B |
|
||
Price history
+44.5% since first listed6 events — show timeline
- 2026-04-26 Pending — UNYREIS
- 2026-04-20 Listed $75,000 UNYREIS
- 2011-12-24 Listing Removed — UNYREIS
- 2011-06-24 Listed $64,900 UNYREIS
- 2004-10-22 Listing Removed — UNYREIS
- 2004-07-26 Listed $51,900 UNYREIS
Property tax history
+6.2%/yrLatest (2025): $3,977 · +12.8% YoY. Source: county tax records.
Cash-flow waterfall
monthlySold comps — $/sqft
last 12 mo · ≤1 miLoading sold comps…