 Fourplex
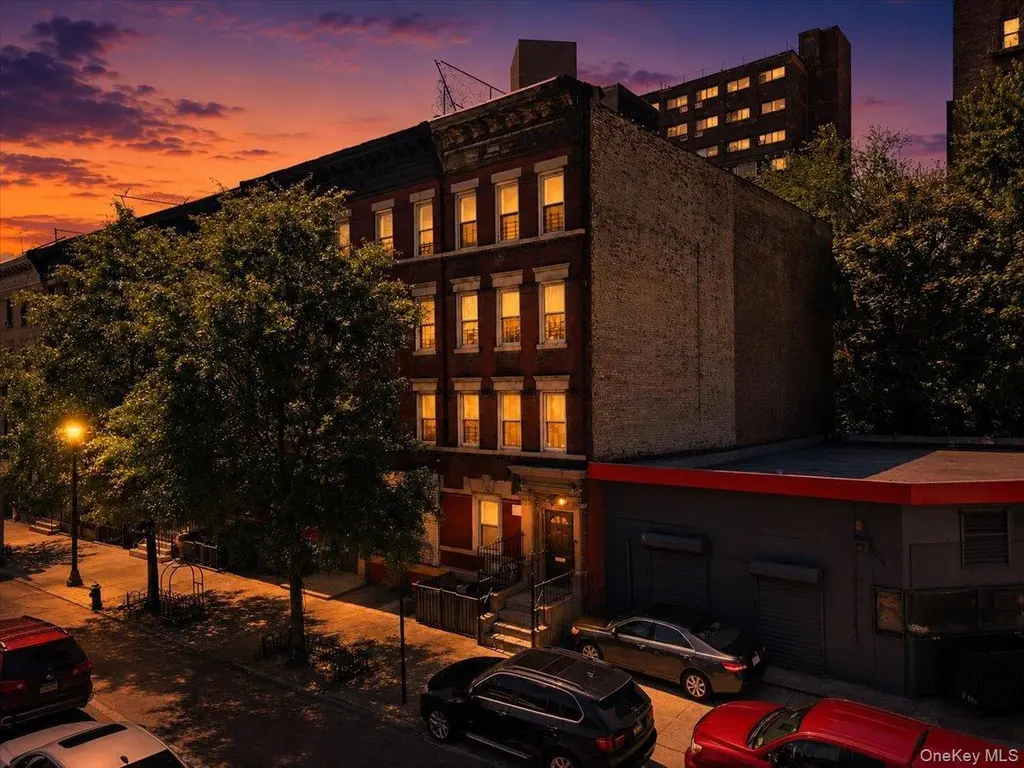
2101 Webster Ave · New York, NY
Flood risk 9/10 · Severe
- FEMA flood zone
- X (unshaded)
- Chance of flooding over 30 yrs
- 0.79%
- Est. flood insurance / yr
- $507 – $1,088
Fire risk 1/10 · Minimal
- Est. fire insurance / yr
- $691 – $1,283
Heat risk 6/10 · Moderate
- Hot days now (above 99°F)
- 7 days/yr
- Hot days in 30 yrs
- 15 days/yr
Wind risk 6/10 · Moderate
- Chance of severe wind over 30 yrs
- 27.0%
Air-quality risk 3/10 · Minor
- Unhealthy air days now
- 3 days/yr
- Unhealthy air days in 30 yrs
- 4 days/yr
Risk factors via First Street. Map © Google.
Why this score? — see what drove the B+ grade
The composite is a weighted blend of 9 inputs, each scored 0–100. Each bar is that input's sub-score; the figure is the points it added to the 100-point composite (weight × sub-score).
- Cash flow +30.0/30.0
- DSCR +10.0/10.0
- 1% rule +9.2/10.0
- ARV discount +7.5/15.0
- Appreciation +7.1/10.0
- Schools +5.0/10.0
- Livability +3.8/5.0
- Rent growth +2.5/5.0
- Condition / age +2.5/5.0
$1,048,888
🖨 Deal sheet (PDF) 📄 Offer letter ✓ Due diligence
Multi-family units
County records classify this as Multi-Family (2-4 Unit). Listing-text estimate: 4 units. confirmed
Listing remarks
Exceptional investment opportunity at 2101 Webster Avenue — a 4-unit quadruplex offering strong income potential in a prime location. This multi-family property features spacious layouts, excellent natural light, and a versatile setup ideal for investors or owner-occupants alike. Conveniently located near shopping, dining, public transportation, schools, and major highways, this property combines city convenience with long-term value. A rare opportunity to own a solid income-producing asset in a highly accessible neighborhood.
Key facts
- Spacious layouts
- Versatile setup
- 4 unit quadruplex
Tags
Property features AI
Finance
- Financial info: Tax year 2025
Exterior
- Parking: On-street parking
- Utilities: Public sewer; Natural gas connected; Public trash collection
- Home design: Quadruplex
- Construction: Brick construction
- Exterior features: Brick exterior; Not waterfront
Interior
- Bedrooms: Four 3-bedroom units
- Bathrooms: Four full bathrooms
- Heating & cooling: Natural gas heating; Wall/window air conditioning units
- Interior features: Other interior features; Full, partially finished basement
Neighborhood map
What this means for you Summary
Snapshot
- This is a 4 × 3-bed/1.0-bath units multifamily listed at $1.05M.
Deal economics
- At list price, monthly cash flow is $5k ($60k/yr) — positive. Per door: $1k/mo.
- The deal already cash-flows at list — no discount required.
- Meets the 1% rule at list price ($15k rent vs $1.05M).
- Recommended offer: $1.03M (1.5% below list) — sets the bar for market timing.
- Cap rate 12.1% vs local median 2.6% in New York — top-decile yield for the area; either an underpriced asset or a hidden risk that comps aren't pricing in. Stress-test before assuming the spread holds.
Location & tenants
- Location reads 75/100 on livability (#268 in NY, #4,188 nationally) — a middle-class / working-renter tenant base. Strengths: amenities A+, commute A+, health & safety A; Watch: crime F, cost of living F.
- Market conditions: 47 active listings in the ZIP; lower-income renter base — watch delinquency; 6,929 units permitted in Bronx County in 2024 (6,829 in 5+ unit buildings).
- At $14,895/mo this rent would consume 419% of the median local household income ($43k/yr) (locally 8573% of renters already pay >50% of income on rent) — very limited rent-growth headroom before tenants either downsize or default.
Forward outlook
- In year one you build about $52k of equity ($7k loan paydown + $45k appreciation (4.3% local appreciation)).
- Bronx County population projected at +21% by 2050 — long-run rental-demand tailwind backs the buy-and-hold thesis.
- At projected returns (4.3% appreciation + 3.0% rent growth), your $294k cash investment doubles in ~3 years — after that, you're playing with house money.
- By year 2, paydown + projected appreciation supports a ~$84k cash-out refi (75% LTV) — recoverable capital for the next deal without selling this one.
Negotiation context
- It's been on market 29 days — a 2% lower offer ($1.03M) is reasonable based on typical stale-listing flexibility.
- 4 sale attempts since 8y ago with the ask held roughly flat each time — persistent listings suggest the price (not the market) is what's stuck; bring a comps-based counter.
- Current owner paid $375k; list at $1.05M implies a 180% gain — meaningful room to come down on a strong offer.
Risks & watch-outs
- Watch-outs: flood insurance adds $66/mo; built in 1931 — expect roof / HVAC / electrical / plumbing capex.
- Climate carrying-cost: severe flood risk; major wind risk, 27% chance of damaging wind over 30y; extreme-heat days projected 7→15/yr by 2055 (HVAC capex compounding) — expect insurance premiums to compound above CPI over the hold.
Questions for the listing agent
- Can we see the unit-by-unit rent roll, current vacancy, and any below-market leases? What's the average tenancy length?
- What capital expenditures (roof, boiler, parking lot, exteriors) have been made in the last 5 years, and what's planned in the next 2?
- Built in 1931 — when were the roof, HVAC, electrical panel, plumbing, and water heater last replaced?
- What's the actual annual flood-insurance premium (NFIP or private), and is the property in a SFHA with mandatory coverage?
- Is there a deadline driving the sale (1031 exchange, divorce, estate, relocation)? That informs how much negotiation room exists.
- Schools are B-rated — typically a magnet for longer-tenancy family renters. What's the average tenant stay here, and is there a school-zone premium baked into asking?
- Crime grade is F in this area — have there been break-ins, vandalism, or insurance claims at this property in the last 3 years? What carrier currently insures it and at what premium?
- What's the average days-on-market for RENTAL listings here right now (not sales)? A rising rental-DOM trend means longer vacancies and softer asking-rent achievability than the comps imply.
- What's the recent tenant-quality profile in this submarket — average credit score on applications, eviction rate, late-payment / NSF rate, and stable-employment percentage? A property-management company in the area should have these aggregated.
- How much new apartment / multifamily construction is in the pipeline within 1–3 miles? Heavy new supply (>2% of stock underway) typically softens rents 12–24 months out; light construction supports rent growth.
Investment metrics
- 1% rule
- 1.42% ✓
- Cap rate
- 12.09%
- Cash-on-cash
- 20.69%
- DSCR
- 1.92
- GRM
- 5.9
CMA / ARV
No comps found within radius.
Projected returns pro-forma
4.3% appreciation · 3.0% rent growth · sell at horizon
- IRR
- 29.3%
- Equity multiple
- 2.77×
- Total profit
- $518,362
- Equity at exit
- $550,061
- IRR
- 28.6%
- Equity multiple
- 5.47×
- Total profit
- $1,313,220
- Equity at exit
- $914,553
Cash invested: $293,689 (down + closing). Projections, not guarantees.
Landlord ↔ Tenant lean methodology
- Overall (CITY)
- 0 Strongly Tenant-Friendly
- State New York
- 15 Strongly Tenant-Friendly · D+10
- County
- — inherits STATE
- City New York
- 0 Strongly Tenant-Friendly · D+34
ZIP-level market 10457
- Home prices YoY
- 2.8%
- Active inventory
- 47
- Price-to-rent
- 23.5×
Monthly cashflow live
- Estimated rent
- $14,895 medium interval (Pro) →
- Mortgage (P&I)
- −$5,500
- Tax from tax record
- −$765 /mo · $9,177/yr
- Insurance
- −$437
- Flood insurance flood zone
- −$66 /mo · $798/yr
- HOA
- −$0
- Vacancy / Maint / Mgmt
- −$3,128
- Net cashflow
- $4,998
Break-even live
Sensitivity live
| Price | -10% $5,592 | -5% $5,295 | +0% $4,998 | +5% $4,701 | +10% $4,405 |
|---|---|---|---|---|---|
| Rent | -10% $3,822 | -5% $4,410 | +0% $4,998 | +5% $5,587 | +10% $6,175 |
| Rate | -1.0pp $5,527 | -0.5pp $5,265 | base $4,998 | +0.5pp $4,727 | +1.0pp $4,450 |
4-unit breakdown (identical units grouped — click to expand)
| Units | Beds | Baths | Est. rent |
|---|---|---|---|
| 4× units | 3 | 1 | $14,896 |
| #1 | 3 | 1 | $3,724 |
| #2 | 3 | 1 | $3,724 |
| #3 | 3 | 1 | $3,724 |
| #4 | 3 | 1 | $3,724 |
| Total (4 units) | $14,895 | ||
UW: 25.0% down · 7.5% · 30yr · 1.5% tax · 5.0% vac · 8.0% maint · 8.0% mgmt
Financing live
Cash to close
- Down payment
- $262,222
- Closing costs
- $31,467
- Reserves months
- —
- Total cash needed
- —
Loan-product check · same deal, 3 products live
Conventional
25% down · 7.5% · 30yr
- Down + closing
- —
- Monthly P&I
- —
- Monthly cashflow
- —
- DSCR
- —
- Eligible?
- —
Personal DTI + credit; lowest rate.
DSCR
20% down · 8.5% · 30yr
- Down + closing
- —
- Monthly P&I
- —
- Monthly cashflow
- —
- DSCR
- —
- Eligible?
- —
No personal income docs; deal must DSCR.
Hard money
10% down · 12.0% · 12mo
- Down + closing
- —
- Monthly P&I
- —
- Monthly cashflow
- —
- DSCR
- —
- Eligible?
- —
Short-term bridge; refi at stabilization.
Listing history 28 events
-
2026-06-18days on market $1,048,888 Active 29 DOM
-
2026-06-17days on market $1,048,888 Active 28 DOM
-
2026-06-16days on market $1,048,888 Active 27 DOM
-
2026-06-15days on market $1,048,888 Active 26 DOM
-
2026-06-13days on market $1,048,888 Active 24 DOM
-
2026-06-10days on market $1,048,888 Active 20 DOM
-
2026-06-08days on market $1,048,888 Active 19 DOM
-
2026-06-08days on market $1,048,888 Active 18 DOM
-
2026-06-04days on market $1,048,888 Active 15 DOM
-
2026-06-03days on market $1,048,888 Active 14 DOM
-
2026-06-02days on market $1,048,888 Active 13 DOM
-
2026-06-01days on market $1,048,888 Active 12 DOM
-
2026-05-31days on market $1,048,888 Active 11 DOM
-
2026-05-20$1,048,888 Active
-
2026-04-20historical
-
2026-02-10$1,188,888 Active
-
2021-12-10historical
-
2021-11-04price $1,160,000
-
2021-06-15price $1,199,999
-
2021-06-03$1,299,999 Active
-
2018-11-20historical
-
2018-09-24price $1,149,999
-
2018-08-28$1,199,999 Active
-
2004-12-07soldstatus $375,000
-
2003-03-24soldstatus $335,000
-
2001-06-04soldstatus $252,000
-
1997-06-20soldstatus $180,500
-
1988-06-08soldstatus $90,000
ⓘ Source: listings_history table (triggers on properties + properties_extension) + one-shot
backfill from property_details.listing_events for pre-trigger history.
Tax reassessment forecast NY · Partial reset (capped growth)
- Current annual tax
- $9,177 · $765/mo
- Projected year-2 tax
- $13,451 · $1,121/mo
- Expected delta
- +$4,275/yr (+$356/mo · 46.6%)
ⓘ Screening estimate from a state-policy table — verify with the county assessor before closing.
Climate risk First Street
- Flood 9/10 Extreme FEMA zone X (unshaded) · 79% chance over 30 yrs
- Wildfire 1/10 Low
- Heat 6/10 Major 7 d/yr ≥99°F today · 15 d/yr by 30 yrs out
- Wind 6/10 Major 27% chance of damaging wind over 30 yrs
- Air quality 3/10 Moderate 3 unhealthy d/yr today · 4 by 30 yrs out
Nearby sold comps map
Loading sold comps map…
Walkable amenities ~0.75 mi
Loading nearby amenities…
Taxation est. · year 1
- Rental income
- $178,740
- − Mortgage interest
- −$58,754
- − Property taxes
- −$9,177
- − Insurance
- −$6,042
- − Repairs & maintenance
- −$14,299
- − Management
- −$14,299
- − Depreciation
- −$30,513
- Taxable income
- $45,656
- Est. tax owed @ 24.0%
- −$10,957
- After-tax cash flow
- $49,023/yr
For passive investors: Depreciation is non-cash, so a rental often shows a tax loss while cash-flowing — sheltering income. Rental losses are passive: they offset passive income freely, and up to $25,000/yr can offset ordinary (W-2) income if you actively participate and your MAGI is under $100k (phasing out to $0 by $150k); unused losses carry forward. On sale, claimed depreciation is recaptured at up to 25%, and gains may owe capital-gains tax (a 1031 exchange can defer both). Figures are a year-1 estimate at your 24.0% rate — not tax advice; consult a CPA.
Schools (NCES district)
No district data.
Livability — New York
- Score
- 75/100
- State rank
- #268
- US rank
- #4188
Category grades
Schools grade is shown separately in the Schools card above.
Census & demographics
- Census place
- New York, NY
- County
- Bronx County · 1,197,324 people
- City population
- 7,731,280
- Metro
- New York-Newark-Jersey City, NY-NJ-PA
- Population (ZIP)
- 79,543
- Household income
- $42,683
- Rent vs Own
- Severe rent burden
- 8573.0
Population outlook (Bronx County) Hauer SSP2
- Today (2025)
- 1,607,353 people
- By 2030
- 1,681,852 · +4.6%
- By 2040
- 1,824,421 · +13.5%
- By 2050
- 1,945,470 · +21.0%
- By 2075
- 2,187,887 · +36.1%
- By 2100
- 2,244,136 · +39.6%
Race, ethnicity, and origin ACS 2023
- Neighborhood character
- Majority Hispanic (63%)
- Race & ethnicity
- Hispanic / Latino 63% Black 32% Two or more races 19% White 2% Native American 1%
- Hispanic origin (detail)
- Mexican 7% Puerto Rican 16% Dominican 31%
- Common ancestry
- Hispanic 1%
- Foreign-born
- 39% · Canada, United Kingdom, Jamaica
- Languages at home
- 33% English-only · Spanish 54% French/Haitian/Cajun 2% Arabic 1%
Political lean MEDSL · Bronx
- 2024 margin
- Solid D (+45.4) · D 72.7% · R 27.3%
- 2008→2024 swing
- -32.3pp toward R · 2008: 77.8pp · 2024: 45.4pp
- All cycles
- 2024: D+45.4 2020: D+67.6 2016: D+79.1 2012: D+82.9 2008: D+77.8
Not yet ingested
- Civics
- —
Market trends
- HPI YoY
- ▲ 4.30%
- Current HPI
- 160.6434
- Rent YoY
- —
- Metro
- New York-Newark-Jersey City, NY-NJ-PA
- State GDP YoY
- ▲ 2.60%
- F500 in state
- 92
Industry mix (Fortune 500 HQ in NY)
| Industry | F500 HQs | Revenue |
|---|---|---|
| Financial Services | 10 | $950B |
|
||
| Consumer Goods | 9 | $162B |
|
||
| Insurance | 4 | $225B |
|
||
| Telecommunications | 2 | $144B |
|
||
| Pharmaceuticals | 2 | $112B |
|
||
| Media / Entertainment | 2 | $69B |
|
||
Price history
+1065.4% since first listed15 events — show timeline
- 2026-05-20 Listed $1,048,888 OneKey® MLS as Distributed by MLS Grid
- 2026-04-20 Listing Removed — OneKey® MLS as Distributed by MLS Grid
- 2026-02-10 Listed $1,188,888 OneKey® MLS as Distributed by MLS Grid
- 2021-12-10 Listing Removed — OneKey® MLS as Distributed by MLS Grid
- 2021-11-04 Price Changed $1,160,000 OneKey® MLS as Distributed by MLS Grid
- 2021-06-15 Price Changed $1,199,999 OneKey® MLS as Distributed by MLS Grid
- 2021-06-03 Listed $1,299,999 OneKey® MLS as Distributed by MLS Grid
- 2018-11-20 Listing Removed — OneKey® MLS as Distributed by MLS Grid
- 2018-09-24 Price Changed $1,149,999 OneKey® MLS as Distributed by MLS Grid
- 2018-08-28 Listed $1,199,999 OneKey® MLS as Distributed by MLS Grid
- 2004-12-07 Sold (Public Records) $375,000 Public Records
- 2003-03-24 Sold (Public Records) $335,000 Public Records
- 2001-06-04 Sold (Public Records) $252,000 Public Records
- 1997-06-20 Sold (Public Records) $180,500 Public Records
- 1988-06-08 Sold (Public Records) $90,000 Public Records
Property tax history
+5.2%/yrLatest (2025): $9,177 · +3.3% YoY. Source: county tax records.
Cash-flow waterfall
monthlySold comps — $/sqft
last 12 mo · ≤1 miLoading sold comps…