 Duplex
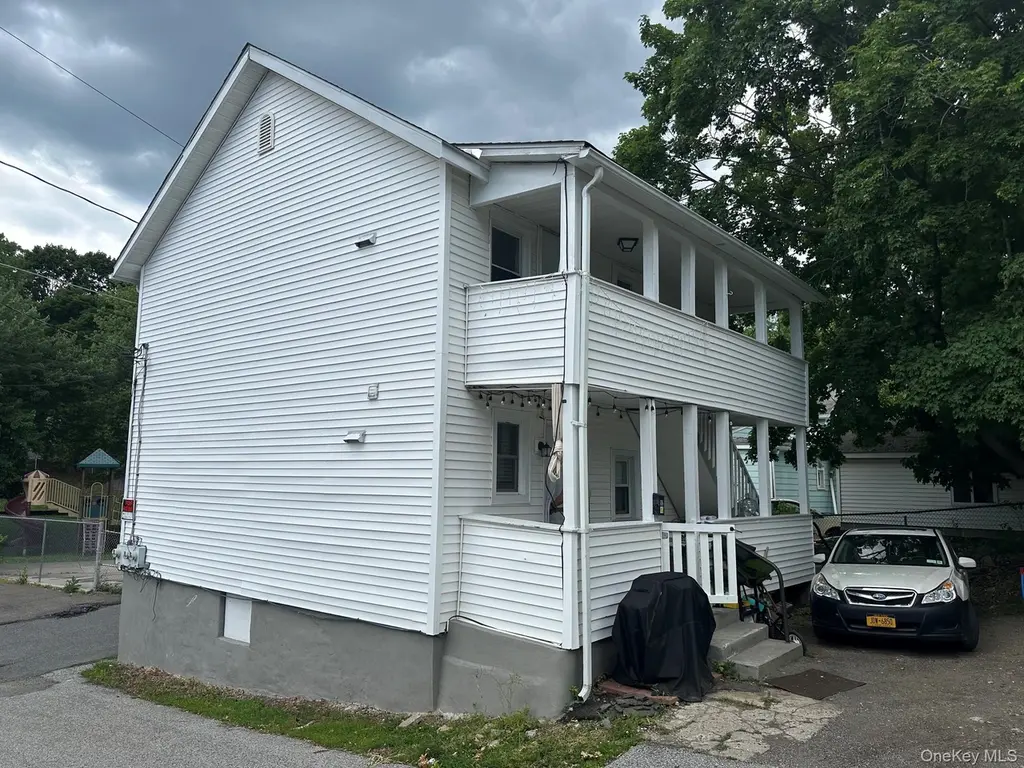
92 Center St · Highland Falls, NY
Flood risk No data
- FEMA flood zone
- —
- Chance of flooding over 30 yrs
- —
- Est. flood insurance / yr
- —
Fire risk No data
- Est. fire insurance / yr
- —
Heat risk No data
- Hot days now (above threshold)
- —
- Hot days in 30 yrs
- —
Wind risk No data
- Chance of severe wind over 30 yrs
- —
Air-quality risk No data
- Unhealthy air days now
- —
- Unhealthy air days in 30 yrs
- —
Risk factors via First Street. Map © Google.
Why this score? — see what drove the D- grade
The composite is a weighted blend of 9 inputs, each scored 0–100. Each bar is that input's sub-score; the figure is the points it added to the 100-point composite (weight × sub-score).
- Appreciation +9.8/10.0
- Cash flow +9.1/30.0
- Schools +4.6/10.0
- Livability +3.7/5.0
- DSCR +2.6/10.0
- Rent growth +2.5/5.0
- Condition / age +2.5/5.0
- 1% rule +2.4/10.0
- ARV discount +2.4/15.0
$479,000
🖨 Deal sheet 📄 Offer letter ✓ Due diligence
Multi-family units
County records classify this as Multi-Family (2-4 Unit). Listing-text estimate: 2 units. confirmed
Listing remarks MLS
Multi-family home now available for sale in the Village of Highland Falls. Building consists of (2 )two bedrooms and one bathroom apartments . Features a new roof , hot water heaters and hardwood floors in each unit. Tenants are responsible for their own utilities. Off-street parking is available for tenants during those winter months . Walking distance to village amenities. Close to Bear Mountain state park , Military Academy at West Point and Metro north train station .
Key facts
- Scenic hiking trails
- New flooring
- 2,526 sq ft lot
Tags
Property features AI
Exterior
- Parking: Driveway parking for two vehicles
- Utilities: Public sewer; Trash collection (public); Electric service by Orange & Rockland
- Home design: Duplex
- Construction: Vinyl siding
- Exterior features: Corner lot; No special exterior features listed
Interior
- Kitchen: Eat-in kitchen(s)
- Bedrooms: Two 2-bedroom units
- Flooring: Laminate flooring
- Bathrooms: Two full bathrooms
- Heating & cooling: Baseboard heating; Natural gas heating; No central air
- Interior features: Eat-in kitchen; Unfinished basement
Neighborhood map
What this means for you Summary
Snapshot
- This is a 2 × 2-bed/1.0-bath units multifamily listed at $479k.
Deal economics
- At list price, monthly cash flow is $-364 ($-4k/yr) — negative. Per door: $-182/mo.
- To cash-flow at today's rent, offer at most $415k (13.4% below list).
- To meet the 1% rule (rent ≥ 1% of price), the offer needs to be $356k (25.6% below list).
- Recommended offer: $356k (25.6% below list) — sets the bar for 1% rule.
Location & tenants
- Location reads 73/100 on livability (#335 in NY) — a middle-class / working-renter tenant base. Strengths: employment A+, housing A+, health & safety A+; Watch: cost of living D, amenities F, commute F.
- Highland Falls Central School District (rural): math 53% / reading 47% proficiency, ranked #328 of 590 in NY (top 56%) — acceptable for families but not a draw, mixed tenant base, ~2y average lease.
- Zoned schools: Fort Montgomery Elementary School (201 students, 52% FRL); Highland Falls Intermediate School (math 32% / reading 47%, grade F, #418 of 729 statewide, top 59%, 324 students, 56% FRL); James I O'Neill High School (math 87% / reading 70%, grade A-, #568 of 1,100 statewide, top 52%, 424 students, 30% FRL).
- Market conditions: 18 active listings in the ZIP; 4 comparable units currently listed for rent nearby; rentals at typical pace (median 24d on market — plan ~3-4 weeks tenant-placement turnaround); 1,746 units permitted in Orange County in 2024 (1,265 in 5+ unit buildings).
Forward outlook
- In year one you build about $50k of equity ($3k loan paydown + $46k appreciation (9.7% local appreciation)).
- By year 2, paydown + projected appreciation supports a ~$80k cash-out refi (75% LTV) — recoverable capital for the next deal without selling this one.
Negotiation context
- Only 11 days on market — expect competitive offers; lowballing is unlikely to land.
- 7 sale attempts since 18y ago with the ask held roughly flat each time — persistent listings suggest the price (not the market) is what's stuck; bring a comps-based counter.
Risks & watch-outs
- Watch-outs: built in 1910 — expect roof / HVAC / electrical / plumbing capex.
Questions for the listing agent
- What do current leases actually rent for vs. the listed asking? Can we see a recent rent roll and the last 12 months of T-12 income?
- Can we see the unit-by-unit rent roll, current vacancy, and any below-market leases? What's the average tenancy length?
- What capital expenditures (roof, boiler, parking lot, exteriors) have been made in the last 5 years, and what's planned in the next 2?
- Built in 1910 — when were the roof, HVAC, electrical panel, plumbing, and water heater last replaced?
- Is there a deadline driving the sale (1031 exchange, divorce, estate, relocation)? That informs how much negotiation room exists.
- The area grade is low — what's the realistic commute time and amenity access for the typical tenant pool here? Any planned neighborhood developments (good or bad) we should know about?
- What's the average days-on-market for RENTAL listings here right now (not sales)? A rising rental-DOM trend means longer vacancies and softer asking-rent achievability than the comps imply.
- What's the recent tenant-quality profile in this submarket — average credit score on applications, eviction rate, late-payment / NSF rate, and stable-employment percentage? A property-management company in the area should have these aggregated.
- How much new apartment / multifamily construction is in the pipeline within 1–3 miles? Heavy new supply (>2% of stock underway) typically softens rents 12–24 months out; light construction supports rent growth.
Investment metrics
- 1% rule
- 0.74% ✗
- Cap rate
- 5.38%
- Cash-on-cash
- -3.26%
- DSCR
- 0.86
- GRM
- 11.2
CMA / ARV
- ARV (on-the-fly)
- $430,560
- Comps found
- 1
Show comp detail 1 sale within ~0.75 mi
| Address | Dist | Beds/Ba | Sqft | Sold | Price | $/sf | Match |
|---|---|---|---|---|---|---|---|
| 92 Center St | 0.00mi | 4/2.0 | 1,248 (0%) | 15mo | $430,000 | $345 | 88 |
Match score weights: distance 35% · size 25% · config 20% · recency 20%. Top-matched comps best support the ARV.
Projected returns pro-forma
9.7% appreciation · 3.0% rent growth · sell at horizon
- IRR
- 21.3%
- Equity multiple
- 2.70×
- Total profit
- $227,718
- Equity at exit
- $420,937
- IRR
- 19.3%
- Equity multiple
- 6.12×
- Total profit
- $686,242
- Equity at exit
- $896,735
Cash invested: $134,120 (down + closing). Projections, not guarantees.
Landlord ↔ Tenant lean methodology
- Overall (STATE)
- 15 Strongly Tenant-Friendly
- State New York
- 15 Strongly Tenant-Friendly · D+10
- County
- — inherits STATE
- City
- — inherits STATE
ZIP-level market 10928
- Home prices YoY
- 3.5%
- Active inventory
- 18
- Price-to-rent
- 22.4×
Monthly cashflow live
- Estimated rent
- $3,564 medium interval (Pro) →
- Mortgage (P&I)
- −$2,512
- Tax from tax record
- −$468 /mo · $5,616/yr
- Insurance
- −$200
- HOA
- −$0
- Vacancy / Maint / Mgmt
- −$748
- Net cashflow
- $-364
Break-even live
2-unit breakdown (identical units grouped — click to expand)
| Units | Beds | Baths | Est. rent |
|---|---|---|---|
| 2× units | 2 | 1 | $3,564 |
| #1 | 2 | 1 | $1,782 |
| #2 | 2 | 1 | $1,782 |
| Total (2 units) | $3,564 | ||
UW: 25.0% down · 7.5% · 30yr · 1.5% tax · 5.0% vac · 8.0% maint · 8.0% mgmt
Financing live
Cash to close
- Down payment
- $119,750
- Closing costs
- $14,370
- Reserves months
- —
- Total cash needed
- —
Loan-product check · same deal, 3 products live
Conventional
25% down · 7.5% · 30yr
- Down + closing
- —
- Monthly P&I
- —
- Monthly cashflow
- —
- DSCR
- —
- Eligible?
- —
Personal DTI + credit; lowest rate.
DSCR
20% down · 8.5% · 30yr
- Down + closing
- —
- Monthly P&I
- —
- Monthly cashflow
- —
- DSCR
- —
- Eligible?
- —
No personal income docs; deal must DSCR.
Hard money
10% down · 12.0% · 12mo
- Down + closing
- —
- Monthly P&I
- —
- Monthly cashflow
- —
- DSCR
- —
- Eligible?
- —
Short-term bridge; refi at stabilization.
Rent comps 4 comps
| Address | Beds | Baths | Sqft | Rent | $/sqft | DOM | Units | Dist |
|---|---|---|---|---|---|---|---|---|
| 29 Tobins Ln #1 Highland Falls, NY | 3.0 | 1.0 | 1000 | $2,850 | $2.85 | 23d | 1 | 0.06mi |
| 29 Tobins Ln Unit 2 Highland Falls, NY | 3.0 | 1.0 | 840 | $2,550 | $3.04 | 43d | 1 | 0.06mi |
| 51 Schneider Ave Unit 2A Highland Falls, NY | 3.0 | 1.0 | 900 | $2,795 | $3.11 | 14d | 1 | 0.10mi |
| 44 Center St Unit 1 Highland Falls, NY | 3.0 | 1.0 | 975 | $2,050 | $2.10 | 14d | 1 | 0.10mi |
Listing history 9 events
-
2026-06-18days on market $479,000 Active 11 DOM
-
2026-06-17days on market $479,000 Active 10 DOM
-
2026-06-16days on market $479,000 Active 9 DOM
-
2026-06-15days on market $479,000 Active 8 DOM
-
2026-06-14days on market $479,000 Active 6 DOM
-
2026-06-10days on market $479,000 Active 3 DOM
-
2026-06-09days on market $479,000 Active 2 DOM
-
2026-06-09remarks 699-char remark
-
2026-06-09$479,000 Active 1 DOM
ⓘ Source: listings_history table (triggers on properties + properties_extension) + one-shot
backfill from property_details.listing_events for pre-trigger history.
Tax reassessment forecast NY · Partial reset (capped growth)
- Current annual tax
- $5,616 · $468/mo
- Projected year-2 tax
- $6,856 · $571/mo
- Expected delta
- +$1,239/yr (+$103/mo · 22.1%)
ⓘ Screening estimate from a state-policy table — verify with the county assessor before closing.
Nearby sold comps map
Loading sold comps map…
Walkable amenities ~0.75 mi
Loading nearby amenities…
Taxation est. · year 1
- Rental income
- $42,768
- − Mortgage interest
- −$26,831
- − Property taxes
- −$5,616
- − Insurance
- −$2,395
- − Repairs & maintenance
- −$3,421
- − Management
- −$3,421
- − Depreciation
- −$13,935
- Taxable loss
- −$12,852
- Est. tax savings @ 24.0%
- +$3,085
- After-tax cash flow
- $-1,283/yr
For passive investors: Depreciation is non-cash, so a rental often shows a tax loss while cash-flowing — sheltering income. Rental losses are passive: they offset passive income freely, and up to $25,000/yr can offset ordinary (W-2) income if you actively participate and your MAGI is under $100k (phasing out to $0 by $150k); unused losses carry forward. On sale, claimed depreciation is recaptured at up to 25%, and gains may owe capital-gains tax (a 1031 exchange can defer both). Figures are a year-1 estimate at your 24.0% rate — not tax advice; consult a CPA.
Schools (NCES district)
- District
- Highland Falls Central School District
- NCES district ID
- 3614430
- Math proficiency
- 53% ▼ -2.00%
- Reading proficiency
- 47% ▼ -6.00%
- Median HH income
- $79,944
- Composite
- 45.68/100
- National rank
- #2577
- State rank
- #328 of 590 in NY
Livability — Highland Falls
- Score
- 73/100
- State rank
- #335
- US rank
- #5653
Category grades
Schools grade is shown separately in the Schools card above.
Census & demographics
- Census place
- Highland Falls, NY
- Population (ZIP)
- 5,273
Population outlook (Orange County) Hauer SSP2
- Today (2025)
- 379,830 people
- By 2030
- 378,955 · -0.2%
- By 2040
- 375,444 · -1.2%
- By 2050
- 369,311 · -2.8%
- By 2075
- 354,233 · -6.7%
- By 2100
- 318,150 · -16.2%
Race, ethnicity, and origin ACS 2023
- Neighborhood character
- Diverse neighborhood (Simpson 0.69)
- Race & ethnicity
- White 44% Hispanic / Latino 30% Two or more races 21% Black 16% Asian 5%
- Hispanic origin (detail)
- Puerto Rican 13% Cuban 1% Dominican 12%
- Common ancestry
- Hispanic 6% Romanian 3% Scotch-Irish 3%
- Foreign-born
- 19% · Canada, China
- Languages at home
- 72% English-only · Spanish 16% French/Haitian/Cajun 6% Chinese 2%
Political lean MEDSL · Orange
- 2024 margin
- Lean R (+8.4) · D 45.8% · R 54.2%
- 2008→2024 swing
- -12.5pp toward R · 2008: 4.1pp · 2024: -8.4pp
- All cycles
- 2024: R+8.4 2020: R+0.2 2016: R+6.5 2012: D+5.2 2008: D+4.1
Not yet ingested
- Civics
- —
Market trends
- HPI YoY
- ▲ 9.70%
- Current HPI
- 284.3368
- Rent YoY
- —
- Metro
- —
- State GDP YoY
- ▲ 2.60%
- F500 in state
- 92
Industry mix (Fortune 500 HQ in NY)
| Industry | F500 HQs | Revenue |
|---|---|---|
| Financial Services | 10 | $950B |
|
||
| Consumer Goods | 9 | $162B |
|
||
| Insurance | 4 | $225B |
|
||
| Telecommunications | 2 | $144B |
|
||
| Pharmaceuticals | 2 | $112B |
|
||
| Media / Entertainment | 2 | $69B |
|
||
Price history
+312.9% since first listed25 events — show timeline
- 2026-06-05 Listed $479,000 OneKey® MLS as Distributed by MLS Grid
- 2025-04-09 Sold (Public Records) $430,000 Public Records
- 2025-03-28 Sold (MLS) $430,000 OneKey® MLS as Distributed by MLS Grid
- 2025-01-21 Pending — OneKey® MLS as Distributed by MLS Grid
- 2025-01-21 Relisted — OneKey® MLS as Distributed by MLS Grid
- 2024-11-17 Relisted — OneKey® MLS as Distributed by MLS Grid
- 2024-11-02 Listed $450,000 OneKey® MLS as Distributed by MLS Grid
- 2016-11-02 Sold (Public Records) $120,000 Public Records
- 2016-11-01 Sold (MLS) $120,000 HGMLS
- 2016-11-01 Price Changed $120,000 HGMLS
- 2016-10-31 Sold (MLS) $120,000 OneKey® MLS as Distributed by MLS Grid
- 2016-07-29 Contingent — HGMLS
- 2016-07-29 Price Changed $145,000 HGMLS
- 2016-05-26 Price Changed $145,000 HGMLS
- 2016-01-06 Price Changed $149,000 HGMLS
- 2015-11-07 Listed $185,000 HGMLS
- 2015-11-07 Listed $145,000 OneKey® MLS as Distributed by MLS Grid
- 2011-04-14 Sold (Public Records) $136,000 Public Records
- 2011-04-04 Sold (MLS) $136,000 HGMLS
- 2011-01-08 Price Changed $178,000 HGMLS
- 2011-01-08 Delisted — HGMLS
- 2008-07-10 Listed $136,000 HGMLS
- 1998-08-04 Sold (Public Records) $82,500 Public Records
- 1998-07-31 Sold (Public Records) $78,500 Public Records
- 1989-04-11 Sold (Public Records) $116,000 Public Records
Property tax history
+1.6%/yrLatest (2025): $5,616 · +40.4% YoY. Source: county tax records.
Cash-flow waterfall
monthlySold comps — $/sqft
last 12 mo · ≤1 miLoading sold comps…