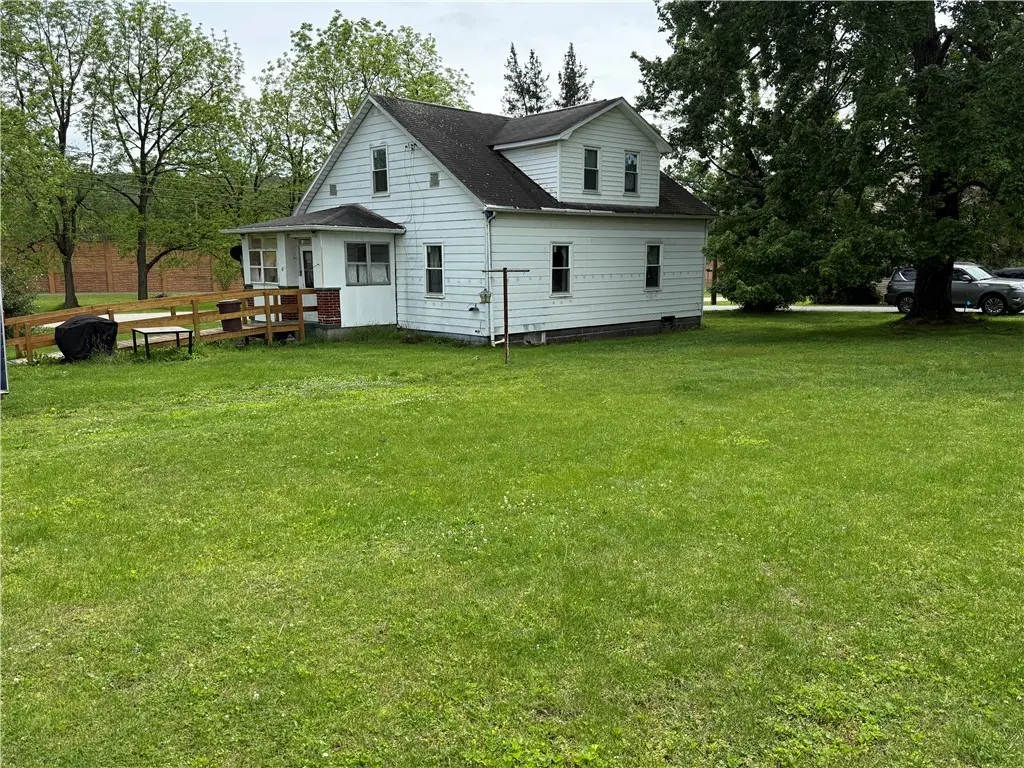
42 Cedar St · Coral, PA
Flood risk 1/10 · Minimal
- FEMA flood zone
- X (unshaded)
- Chance of flooding over 30 yrs
- 0.0%
- Est. flood insurance / yr
- $507 – $1,088
Fire risk 2/10 · Minimal
- Est. fire insurance / yr
- $511 – $949
Heat risk 4/10 · Minor
- Hot days now (above 94°F)
- 7 days/yr
- Hot days in 30 yrs
- 18 days/yr
Wind risk 2/10 · Minimal
- Chance of severe wind over 30 yrs
- —
Air-quality risk 3/10 · Minor
- Unhealthy air days now
- 2 days/yr
- Unhealthy air days in 30 yrs
- 3 days/yr
Risk factors via First Street. Map © Google.
Why this score? — see what drove the C+ grade
The composite is a weighted blend of 9 inputs, each scored 0–100. Each bar is that input's sub-score; the figure is the points it added to the 100-point composite (weight × sub-score).
- Cash flow +17.1/30.0
- ARV discount +15.0/15.0
- Appreciation +7.0/10.0
- DSCR +5.3/10.0
- Schools +4.2/10.0
- 1% rule +4.1/10.0
- Livability +2.9/5.0
- Rent growth +2.5/5.0
- Condition / age +2.5/5.0
$129,000
🖨 Deal sheet 📄 Offer letter ✓ Due diligence
Listing remarks
Situated on a desirable corner double lot in Homer-Center School District, this spacious 4 bedroom, 1 & 1/2 bath home is full of potential and ready for your personal touch! Offering a flexible layout, the main level features 1 bedroom and a convenient half bath, while the upper level hosts 3 additional bedrooms and a full bath. Kitchen is an eat-in and comes with appliances. A detached garage provides extra storage and parking, a a generous yard space offers endless possibilities for outdoor enjoyment, gardening or entertaining. With low taxes and solid bones, this property is the perfect opportunity for buyers looking to bring their vision and creativity to make this their dream hom
Key facts
- Corner double lot
- Flexible layout
- Eat-in kitchen
Tags
Property features AI
Exterior
- Parking: Detached garage; Off-street parking
- Utilities: Public water; Public sewer
- Home design: 2 stories; Resale property
- Construction: Vinyl siding; Composition roof
- Exterior features: Lot approximately 0.32 acres (100 x 140)
Interior
- Kitchen: Refrigerator; Stove
- Flooring: Carpet
- Bathrooms: 1 full bathroom; 1 half bathroom
- Heating & cooling: Forced air gas heating
- Interior features: Carpet flooring; Unfinished walk-up basement
- Laundry & utility: Some gas appliances
Neighborhood map
What this means for you Summary
Snapshot
- This is a 3-bed/1.0-bath single-family listed at $129k.
Deal economics
- At list price, monthly cash flow is $91 ($1k/yr) — positive.
- The deal already cash-flows at list — no discount required.
- To meet the 1% rule (rent ≥ 1% of price), the offer needs to be $118k (8.8% below list).
- Recommended offer: $118k (8.8% below list) — sets the bar for 1% rule.
Location & tenants
- Location reads 58/100 on livability (#1,586 in PA) — a working-class tenant base; expect higher turnover. Strengths: cost of living A+; Watch: employment C-, crime D+, schools F.
- Homer-Center SD (town): math 40% / reading 59% proficiency, ranked #201 of 539 in PA (top 37%) — families likely to look elsewhere, expect single-tenant / working-renter base with shorter leases.
- Market conditions: 1 active listings in the ZIP; 44 units permitted in Indiana County in 2024 (0 in 5+ unit buildings).
Forward outlook
- In year one you build about $6k of equity ($892 loan paydown + $5k appreciation (4.0% local appreciation)).
- Indiana County population projected at -18% by 2050 — secular population decline; favor cash flow + early exit over multi-decade hold.
- At projected returns (4.0% appreciation + 3.0% rent growth), your $36k cash investment doubles in ~5 years — after that, you're playing with house money.
- By year 6, paydown + projected appreciation supports a ~$32k cash-out refi (75% LTV) — recoverable capital for the next deal without selling this one.
Negotiation context
- It's been on market 24 days — a 2% lower offer ($127k) is reasonable based on typical stale-listing flexibility.
Questions for the listing agent
- Built in 1960 — when were the roof, HVAC, electrical panel, plumbing, and water heater last replaced?
- Is there a deadline driving the sale (1031 exchange, divorce, estate, relocation)? That informs how much negotiation room exists.
- Schools are F-rated, which usually means shorter tenancies and higher turnover. Who's the typical renter profile here, and what's been the actual vacancy rate?
- Crime grade is D in this area — have there been break-ins, vandalism, or insurance claims at this property in the last 3 years? What carrier currently insures it and at what premium?
- What's the average days-on-market for RENTAL listings here right now (not sales)? A rising rental-DOM trend means longer vacancies and softer asking-rent achievability than the comps imply.
- What's the recent tenant-quality profile in this submarket — average credit score on applications, eviction rate, late-payment / NSF rate, and stable-employment percentage? A property-management company in the area should have these aggregated.
- How much new for-sale + rental construction is in the pipeline within 1–3 miles? Heavy new supply typically softens prices + rents 12–24 months out; constrained supply supports both.
Investment metrics
- 1% rule
- 0.91% ✗
- Cap rate
- 7.14%
- Cash-on-cash
- 3.02%
- DSCR
- 1.13
- GRM
- 9.1
CMA / ARV
- ARV (on-the-fly)
- $157,500
- Comps found
- 3
Show comp detail 3 sales within ~0.75 mi
| Address | Dist | Beds/Ba | Sqft | Sold | Price | $/sf | Match |
|---|---|---|---|---|---|---|---|
| 60 Apple Ln | 0.24mi | 3/1.5 | 1,232 (-2%) | 12mo | $218,000 | $177 | 74 |
| 38 Locust St | 0.13mi | 2/1.0 (-1) | 1,188 (-6%) | 10mo | $139,000 | $117 | 71 |
| 19 Chestnut St | 0.04mi | 3/1.0 | 1,076 (-15%) | 7mo | $135,000 | $125 | 68 |
Match score weights: distance 35% · size 25% · config 20% · recency 20%. Top-matched comps best support the ARV.
Projected returns pro-forma
3.98% appreciation · 3.0% rent growth · sell at horizon
- IRR
- 12.9%
- Equity multiple
- 1.78×
- Total profit
- $28,099
- Equity at exit
- $65,229
- IRR
- 14.3%
- Equity multiple
- 3.32×
- Total profit
- $83,876
- Equity at exit
- $106,546
Cash invested: $36,120 (down + closing). Projections, not guarantees.
Landlord ↔ Tenant lean methodology
- Overall (STATE)
- 62 Landlord-Friendly
- State Pennsylvania
- 62 Landlord-Friendly · EVEN
- County
- — inherits STATE
- City
- — inherits STATE
ZIP-level market 15731
- Home prices YoY
- 3.0%
- Active inventory
- 1
- Price-to-rent
- 9.1×
Monthly cashflow live
- Estimated rent
- $1,177 medium interval (Pro) →
- Mortgage (P&I)
- −$676
- Tax from tax record
- −$109 /mo · $1,305/yr
- Insurance
- −$54
- HOA
- −$0
- Vacancy / Maint / Mgmt
- −$247
- Net cashflow
- $91
Break-even live
UW: 25.0% down · 7.5% · 30yr · 1.5% tax · 5.0% vac · 8.0% maint · 8.0% mgmt
Financing live
Cash to close
- Down payment
- $32,250
- Closing costs
- $3,870
- Reserves months
- —
- Total cash needed
- —
Loan-product check · same deal, 3 products live
Conventional
25% down · 7.5% · 30yr
- Down + closing
- —
- Monthly P&I
- —
- Monthly cashflow
- —
- DSCR
- —
- Eligible?
- —
Personal DTI + credit; lowest rate.
DSCR
20% down · 8.5% · 30yr
- Down + closing
- —
- Monthly P&I
- —
- Monthly cashflow
- —
- DSCR
- —
- Eligible?
- —
No personal income docs; deal must DSCR.
Hard money
10% down · 12.0% · 12mo
- Down + closing
- —
- Monthly P&I
- —
- Monthly cashflow
- —
- DSCR
- —
- Eligible?
- —
Short-term bridge; refi at stabilization.
Listing history 17 events
-
2026-06-19days on market $129,000 Active 24 DOM
-
2026-06-18days on market $129,000 Active 23 DOM
-
2026-06-17days on market $129,000 Active 22 DOM
-
2026-06-16days on market $129,000 Active 21 DOM
-
2026-06-15days on market $129,000 Active 20 DOM
-
2026-06-14days on market $129,000 Active 18 DOM
-
2026-06-12days on market $129,000 Active 17 DOM
-
2026-06-09days on market $129,000 Active 14 DOM
-
2026-06-08days on market $129,000 Active 13 DOM
-
2026-06-07days on market $129,000 Active 12 DOM
-
2026-06-05days on market $129,000 Active 9 DOM
-
2026-06-03days on market $129,000 Active 8 DOM
-
2026-06-02days on market $129,000 Active 7 DOM
-
2026-06-01days on market $129,000 Active 6 DOM
-
2026-05-31days on market $129,000 Active 5 DOM
-
2026-05-30days on market $129,000 Active 4 DOM
-
2026-05-26$129,000 Active
ⓘ Source: listings_history table (triggers on properties + properties_extension) + one-shot
backfill from property_details.listing_events for pre-trigger history.
Tax reassessment forecast PA · Partial reset (capped growth)
- Current annual tax
- $1,305 · $109/mo
- Projected year-2 tax
- $1,672 · $139/mo
- Expected delta
- +$367/yr (+$31/mo · 28.1%)
ⓘ Screening estimate from a state-policy table — verify with the county assessor before closing.
Climate risk First Street
- Flood 1/10 Low FEMA zone X (unshaded) · 0% chance over 30 yrs
- Wildfire 2/10 Low
- Heat 4/10 Moderate 7 d/yr ≥94°F today · 18 d/yr by 30 yrs out
- Wind 2/10 Low
- Air quality 3/10 Moderate 2 unhealthy d/yr today · 3 by 30 yrs out
Nearby sold comps map
Loading sold comps map…
Walkable amenities ~0.75 mi
Loading nearby amenities…
Taxation est. · year 1
- Rental income
- $14,123
- − Mortgage interest
- −$7,226
- − Property taxes
- −$1,305
- − Insurance
- −$645
- − Repairs & maintenance
- −$1,130
- − Management
- −$1,130
- − Depreciation
- −$3,753
- Taxable loss
- −$1,065
- Est. tax savings @ 24.0%
- +$256
- After-tax cash flow
- $1,345/yr
For passive investors: Depreciation is non-cash, so a rental often shows a tax loss while cash-flowing — sheltering income. Rental losses are passive: they offset passive income freely, and up to $25,000/yr can offset ordinary (W-2) income if you actively participate and your MAGI is under $100k (phasing out to $0 by $150k); unused losses carry forward. On sale, claimed depreciation is recaptured at up to 25%, and gains may owe capital-gains tax (a 1031 exchange can defer both). Figures are a year-1 estimate at your 24.0% rate — not tax advice; consult a CPA.
Schools (NCES district)
- District
- Homer-Center SD
- NCES district ID
- 4213290
- Math proficiency
- 40% ▼ -6.00%
- Reading proficiency
- 59% ▼ -5.00%
- Median HH income
- $43,701
- Composite
- 41.69/100
- National rank
- #3415
- State rank
- #201 of 539 in PA
Livability — Coral
- Score
- 58/100
- State rank
- #1586
- US rank
- #21338
Category grades
Schools grade is shown separately in the Schools card above.
Census & demographics
- Census place
- Coral, PA
- Population (ZIP)
- 191
Population outlook (Indiana County) Hauer SSP2
- Today (2025)
- 84,294 people
- By 2030
- 81,773 · -3.0%
- By 2040
- 75,213 · -10.8%
- By 2050
- 69,348 · -17.7%
- By 2075
- 57,951 · -31.3%
- By 2100
- 47,313 · -43.9%
Race, ethnicity, and origin ACS 2023
- Neighborhood character
- Predominantly White (100%)
- Race & ethnicity
- White 100%
- Common ancestry
- Romanian 35% Serbian 3%
- Languages at home
- 90% English-only · Other Indo-European 10%
Political lean MEDSL · Indiana
- 2024 margin
- Solid R (+39.1) · D 30.1% · R 69.2%
- 2008→2024 swing
- -32.0pp toward R · 2008: -7.1pp · 2024: -39.1pp
- All cycles
- 2024: R+39.1 2020: R+37.5 2016: R+35.6 2012: R+18.8 2008: R+7.1
Not yet ingested
- Civics
- —
Market trends
- HPI YoY
- ▲ 3.98%
- Current HPI
- 137.5558
- Rent YoY
- —
- Metro
- —
- State GDP YoY
- ▲ 1.68%
- F500 in state
- 34
Industry mix (Fortune 500 HQ in PA)
| Industry | F500 HQs | Revenue |
|---|---|---|
| Healthcare | 2 | $309B |
|
||
| Insurance | 2 | $27B |
|
||
| Telecommunications / Media | 1 | $124B |
|
||
| Industrial Distribution | 1 | $22B |
|
||
| Financial Services | 1 | $20B |
|
||
| Chemicals / Materials | 1 | $18B |
|
||
Price history
1 event — show timeline
- 2026-05-26 Listed $129,000 West Penn MLS
Property tax history
+3.4%/yrLatest (2026): $1,305 · +2.1% YoY. Source: county tax records.
Cash-flow waterfall
monthlySold comps — $/sqft
last 12 mo · ≤1 miLoading sold comps…