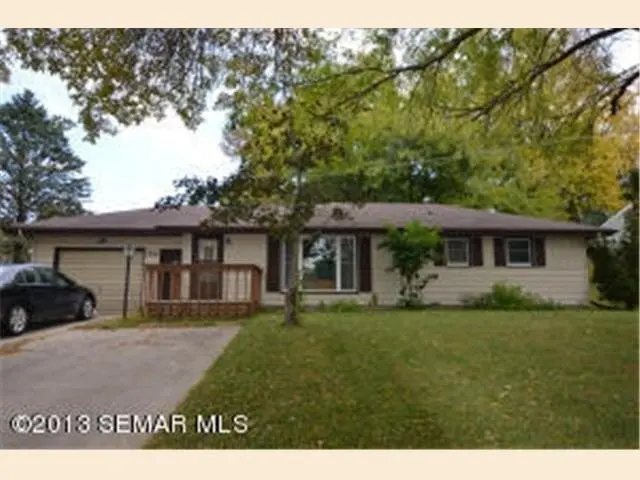
808 2nd Ave NW · Byron, MN
Flood risk 1/10 · Minimal
- FEMA flood zone
- X (unshaded)
- Chance of flooding over 30 yrs
- 0.0%
- Est. flood insurance / yr
- $473 – $860
Fire risk 1/10 · Minimal
- Est. fire insurance / yr
- $888 – $1,650
Heat risk 2/10 · Minimal
- Hot days now (above 100°F)
- 7 days/yr
- Hot days in 30 yrs
- 15 days/yr
Wind risk 2/10 · Minimal
- Chance of severe wind over 30 yrs
- —
Air-quality risk 2/10 · Minimal
- Unhealthy air days now
- 1 days/yr
- Unhealthy air days in 30 yrs
- 1 days/yr
Risk factors via First Street. Map © Google.
Why this score? — see what drove the D grade
The composite is a weighted blend of 9 inputs, each scored 0–100. Each bar is that input's sub-score; the figure is the points it added to the 100-point composite (weight × sub-score).
- Cash flow +11.8/30.0
- ARV discount +7.5/15.0
- Schools +5.5/10.0
- Livability +4.2/5.0
- DSCR +3.5/10.0
- 1% rule +3.4/10.0
- Rent growth +2.5/5.0
- Condition / age +2.5/5.0
- Appreciation +0.0/10.0
$200,000
🖨 Deal sheet 📄 Offer letter ✓ Due diligence
Listing remarks MLS
3 bedrooms and 1 bath all on main floor. Updated windows and hardwood floors. Beautiful lot that features mature trees. One car attached garage, large deck, covered patio, and storage shed.
Key facts
- 0.25 acre lot
- Garage
- Built 1963
Property features AI
Finance
- Other: Property type: Residential; Other on-site structure(s) present
Exterior
- Parking: Attached garage (1 car)
- Utilities: City water (connected); City sewer (connected); Electric with fuses; Natural gas
- Home design: Residential one-level home; Main entry and all living spaces on one level
- Construction: Block foundation; Pitched asphalt roof (over 8 years old); Built with block foundation area of 1,056 and foundation dimensions approximately 44x24
- Exterior features: Vinyl exterior; Deck; Medium tree coverage; City street with curbs and paved roads
Interior
- Kitchen: Cooktop; Range; Wall oven; Microwave; Dishwasher; Refrigerator; Kitchen window
- Bedrooms: Three bedrooms, all on the main level (sizes: 11x11, 11x11, 10x10)
- Flooring: Hardwood floors
- Bathrooms: One full bathroom on the main floor (9x5); One quarter bathroom
- Heating & cooling: Forced air heating; Central air conditioning
- Interior features: Main-floor primary bedroom; Natural woodwork; Kitchen window; Hardwood floors; Unfinished full basement with sump pump; 3 bedrooms on one level
- Laundry & utility: Washer and dryer; Laundry located in the basement; Gas water heater
Neighborhood map
What this means for you Summary
Snapshot
- This is a 3-bed/1.0-bath single-family listed at $200k.
Deal economics
- At list price, monthly cash flow is $-54 ($-647/yr) — negative.
- To cash-flow at today's rent, offer at most $190k (4.8% below list).
- To meet the 1% rule (rent ≥ 1% of price), the offer needs to be $167k (16.4% below list).
- Recommended offer: $167k (16.4% below list) — sets the bar for 1% rule.
- Cap rate 6.0% vs local median 2.5% in Byron — top-decile yield for the area; either an underpriced asset or a hidden risk that comps aren't pricing in. Stress-test before assuming the spread holds.
Location & tenants
- Location reads 83/100 on livability (#30 in MN, #956 nationally) — a professional / high-income tenant draw. Strengths: commute A+, employment A+, housing A+; Watch: amenities F, health & safety D-.
- Byron Public School District (town): math 60% / reading 63% proficiency, ranked #24 of 301 in MN (top 8%) — acceptable for families but not a draw, mixed tenant base, ~2y average lease; only 10% free/reduced lunch — higher-income household profile.
- Market conditions: 162 active listings in the ZIP; 3 comparable units currently listed for rent nearby; rentals leasing fast (median 13d on market — plan ~1-2 weeks tenant-placement turnaround); 1,267 units permitted in Olmsted County in 2024 (915 in 5+ unit buildings).
Forward outlook
- Local home prices are declining (-3.0%/yr); year-one equity from $1k of loan paydown is wiped out by about $6k of value loss. Plan a longer hold.
- Olmsted County population projected at +16% by 2050 — long-run rental-demand tailwind backs the buy-and-hold thesis.
Negotiation context
- Only 4 days on market — expect competitive offers; lowballing is unlikely to land.
- 5 sale attempts since 16y ago with the ask held roughly flat each time — persistent listings suggest the price (not the market) is what's stuck; bring a comps-based counter.
Questions for the listing agent
- What do current leases actually rent for vs. the listed asking? Can we see a recent rent roll and the last 12 months of T-12 income?
- Built in 1963 — when were the roof, HVAC, electrical panel, plumbing, and water heater last replaced?
- Is there a deadline driving the sale (1031 exchange, divorce, estate, relocation)? That informs how much negotiation room exists.
- Schools are A-rated — typically a magnet for longer-tenancy family renters. What's the average tenant stay here, and is there a school-zone premium baked into asking?
- The area grade is low — what's the realistic commute time and amenity access for the typical tenant pool here? Any planned neighborhood developments (good or bad) we should know about?
- What's the average days-on-market for RENTAL listings here right now (not sales)? A rising rental-DOM trend means longer vacancies and softer asking-rent achievability than the comps imply.
- What's the recent tenant-quality profile in this submarket — average credit score on applications, eviction rate, late-payment / NSF rate, and stable-employment percentage? A property-management company in the area should have these aggregated.
- How much new for-sale + rental construction is in the pipeline within 1–3 miles? Heavy new supply typically softens prices + rents 12–24 months out; constrained supply supports both.
Investment metrics
- 1% rule
- 0.84% ✗
- Cap rate
- 5.97%
- Cash-on-cash
- -1.16%
- DSCR
- 0.95
- GRM
- 10.0
CMA / ARV
No comps found within radius.
Projected returns pro-forma
-3.0% appreciation · 3.0% rent growth · sell at horizon
- IRR
- -18.2%
- Equity multiple
- 0.36×
- Total profit
- $-35,823
- Equity at exit
- $29,821
- IRR
- -10.4%
- Equity multiple
- 0.37×
- Total profit
- $-35,533
- Equity at exit
- $17,292
Cash invested: $56,000 (down + closing). Projections, not guarantees.
Landlord ↔ Tenant lean methodology
- Overall (STATE)
- 46 Balanced
- State Minnesota
- 46 Balanced · D+2
- County
- — inherits STATE
- City
- — inherits STATE
ZIP-level market 55920
- Home prices YoY
- -21.4%
- Active inventory
- 162
- Price-to-rent
- 10.0×
Monthly cashflow live
- Estimated rent
- $1,673 medium interval (Pro) →
- Mortgage (P&I)
- −$1,049
- Tax from tax record
- −$243 /mo · $2,918/yr
- Insurance
- −$83
- HOA
- −$0
- Vacancy / Maint / Mgmt
- −$351
- Net cashflow
- $-54
Break-even live
UW: 25.0% down · 7.5% · 30yr · 1.5% tax · 5.0% vac · 8.0% maint · 8.0% mgmt
Financing live
Cash to close
- Down payment
- $50,000
- Closing costs
- $6,000
- Reserves months
- —
- Total cash needed
- —
Loan-product check · same deal, 3 products live
Conventional
25% down · 7.5% · 30yr
- Down + closing
- —
- Monthly P&I
- —
- Monthly cashflow
- —
- DSCR
- —
- Eligible?
- —
Personal DTI + credit; lowest rate.
DSCR
20% down · 8.5% · 30yr
- Down + closing
- —
- Monthly P&I
- —
- Monthly cashflow
- —
- DSCR
- —
- Eligible?
- —
No personal income docs; deal must DSCR.
Hard money
10% down · 12.0% · 12mo
- Down + closing
- —
- Monthly P&I
- —
- Monthly cashflow
- —
- DSCR
- —
- Eligible?
- —
Short-term bridge; refi at stabilization.
Rent comps 3 comps
| Address | Beds | Baths | Sqft | Rent | $/sqft | DOM | Units | Dist |
|---|---|---|---|---|---|---|---|---|
| 739 Valley View Ct NE Byron, MN | 2.0 | 1.5 | 880 | $1,295 | $1.47 | 13d | 4 | 0.47mi |
| 642 Shardlow Ln NE Byron, MN | 2.0 | 2.0 | 1180 | $1,795 | $1.52 | 13d | 1 | 0.96mi |
| 620 Stone Haven Dr NE Byron, MN | 3.0 | 1.0–2.5 | 1125 | $2,420 | $2.15 | 13d | 17 | 1.25mi |
Listing history 11 events
-
2026-05-15historical $200,000 298-char remark
-
2018-12-10historical 189-char remark
Show marketing remark (189 chars)
3 bedrooms and 1 bath all on main floor. Updated windows and hardwood floors. Beautiful lot that features mature trees. One car attached garage, large deck, covered patio, and storage shed.
-
2018-12-10historical
Show marketing remark (189 chars)
3 bedrooms and 1 bath all on main floor. Updated windows and hardwood floors. Beautiful lot that features mature trees. One car attached garage, large deck, covered patio, and storage shed.
-
2013-12-11soldstatus $110,000 189-char remark
Show marketing remark (189 chars)
3 bedrooms and 1 bath all on main floor. Updated windows and hardwood floors. Beautiful lot that features mature trees. One car attached garage, large deck, covered patio, and storage shed.
-
2013-12-11soldstatus $110,000
Show marketing remark (189 chars)
3 bedrooms and 1 bath all on main floor. Updated windows and hardwood floors. Beautiful lot that features mature trees. One car attached garage, large deck, covered patio, and storage shed.
-
2013-10-10$114,900 189-char remark
Show marketing remark (189 chars)
3 bedrooms and 1 bath all on main floor. Updated windows and hardwood floors. Beautiful lot that features mature trees. One car attached garage, large deck, covered patio, and storage shed.
-
2013-10-10$114,900
Show marketing remark (189 chars)
3 bedrooms and 1 bath all on main floor. Updated windows and hardwood floors. Beautiful lot that features mature trees. One car attached garage, large deck, covered patio, and storage shed.
-
2010-01-18$117,000
-
2010-01-18$117,000
-
2003-12-16soldstatus $122,000
-
1999-09-28soldstatus $97,000
ⓘ Source: listings_history table (triggers on properties + properties_extension) + one-shot
backfill from property_details.listing_events for pre-trigger history.
Tax reassessment forecast MN · Partial reset (capped growth)
- Current annual tax
- $2,918 · $243/mo
- Projected year-2 tax
- $2,918 · $243/mo
- Expected delta
- $0/yr ($0/mo · 0.0%)
ⓘ Screening estimate from a state-policy table — verify with the county assessor before closing.
Climate risk First Street
- Flood 1/10 Low FEMA zone X (unshaded) · 0% chance over 30 yrs
- Wildfire 1/10 Low
- Heat 2/10 Low 7 d/yr ≥100°F today · 15 d/yr by 30 yrs out
- Wind 2/10 Low
- Air quality 2/10 Low 1 unhealthy d/yr today · 1 by 30 yrs out
Nearby sold comps map
Loading sold comps map…
Walkable amenities ~0.75 mi
Loading nearby amenities…
Taxation est. · year 1
- Rental income
- $20,072
- − Mortgage interest
- −$11,203
- − Property taxes
- −$2,918
- − Insurance
- −$1,000
- − Repairs & maintenance
- −$1,606
- − Management
- −$1,606
- − Depreciation
- −$5,818
- Taxable loss
- −$4,079
- Est. tax savings @ 24.0%
- +$979
- After-tax cash flow
- $332/yr
For passive investors: Depreciation is non-cash, so a rental often shows a tax loss while cash-flowing — sheltering income. Rental losses are passive: they offset passive income freely, and up to $25,000/yr can offset ordinary (W-2) income if you actively participate and your MAGI is under $100k (phasing out to $0 by $150k); unused losses carry forward. On sale, claimed depreciation is recaptured at up to 25%, and gains may owe capital-gains tax (a 1031 exchange can defer both). Figures are a year-1 estimate at your 24.0% rate — not tax advice; consult a CPA.
Schools (NCES district)
- District
- Byron Public School District
- NCES district ID
- 2707350
- Math proficiency
- 60% ▼ -14.00%
- Reading proficiency
- 63% ▼ -13.00%
- Median HH income
- $78,267
- Composite
- 55.01/100
- National rank
- #1296
- State rank
- #24 of 301 in MN
Livability — Byron
- Score
- 83/100
- State rank
- #30
- US rank
- #956
Category grades
Schools grade is shown separately in the Schools card above.
Census & demographics
- Census place
- Byron, MN
- Population (ZIP)
- 8,747
Population outlook (Olmsted County) Hauer SSP2
- Today (2025)
- 165,999 people
- By 2030
- 172,425 · +3.9%
- By 2040
- 183,785 · +10.7%
- By 2050
- 192,981 · +16.3%
- By 2075
- 215,284 · +29.7%
- By 2100
- 224,887 · +35.5%
Race, ethnicity, and origin ACS 2023
- Neighborhood character
- Predominantly White (90%)
- Race & ethnicity
- White 90% Hispanic / Latino 3% Two or more races 3% Asian 2% Black 1%
- Common ancestry
- Portuguese 16% Romanian 7% Italian 2%
- Foreign-born
- 2% · Canada
- Languages at home
- 98% English-only · Other Asian/Pacific 1%
Political lean MEDSL · Olmsted
- 2024 margin
- D (+10.7) · D 54.3% · R 43.6% · Other 2.1%
- 2008→2024 swing
- +7.4pp toward D · 2008: 3.3pp · 2024: 10.7pp
- All cycles
- 2024: D+10.7 2020: D+10.7 2016: D+0.8 2012: D+3.2 2008: D+3.3
Not yet ingested
- Civics
- —
Market trends
- HPI YoY
- ▼ -70.79%
- Current HPI
- 260.7113
- Rent YoY
- —
- Metro
- —
- State GDP YoY
- ▲ 2.41%
- F500 in state
- 34
Industry mix (Fortune 500 HQ in MN)
| Industry | F500 HQs | Revenue |
|---|---|---|
| Healthcare | 2 | $407B |
|
||
| Retail | 2 | $150B |
|
||
| Consumer Goods | 2 | $32B |
|
||
| Industrial Machinery | 2 | $6B |
|
||
| Agriculture | 1 | $40B |
|
||
| Healthcare / Medical Devices | 1 | $32B |
|
||
Price history
+132.0% since first listed14 events — show timeline
- 2026-06-15 Sold (MLS) $225,000 NORTHSTARMLS as Distributed by MLS Grid
- 2026-05-22 Pending — NORTHSTARMLS as Distributed by MLS Grid
- 2026-05-19 Listed $200,000 NORTHSTARMLS as Distributed by MLS Grid
- 2026-05-15 Coming Soon $200,000 NORTHSTARMLS as Distributed by MLS Grid
- 2018-12-10 Listing Removed — NORTHSTARMLS as Distributed by MLS Grid
- 2018-12-10 Listing Removed — NORTHSTARMLS as Distributed by MLS Grid
- 2013-12-11 Sold (MLS) $110,000 NORTHSTARMLS as Distributed by MLS Grid
- 2013-12-11 Sold (MLS) $110,000 NORTHSTARMLS as Distributed by MLS Grid
- 2013-10-10 Listed $114,900 NORTHSTARMLS as Distributed by MLS Grid
- 2013-10-10 Listed $114,900 NORTHSTARMLS as Distributed by MLS Grid
- 2010-01-18 Listed $117,000 NORTHSTARMLS as Distributed by MLS Grid
- 2010-01-18 Listed $117,000 NORTHSTARMLS as Distributed by MLS Grid
- 2003-12-16 Sold (Public Records) $122,000 Public Records
- 1999-09-28 Sold (Public Records) $97,000 Public Records
Property tax history
+4.7%/yrLatest (2025): $2,918 · +0.0% YoY. Source: county tax records.
Cash-flow waterfall
monthlySold comps — $/sqft
last 12 mo · ≤1 miLoading sold comps…