226 E 95th St #506 · New York, NY
Flood risk 4/10 · Minor
- FEMA flood zone
- X (unshaded)
- Chance of flooding over 30 yrs
- 0.13%
- Est. flood insurance / yr
- $507 – $1,088
Fire risk 1/10 · Minimal
- Est. fire insurance / yr
- $691 – $1,283
Heat risk 6/10 · Moderate
- Hot days now (above 99°F)
- 7 days/yr
- Hot days in 30 yrs
- 15 days/yr
Wind risk 6/10 · Moderate
- Chance of severe wind over 30 yrs
- 27.0%
Air-quality risk 4/10 · Minor
- Unhealthy air days now
- 5 days/yr
- Unhealthy air days in 30 yrs
- 6 days/yr
Risk factors via First Street. Map © Google.
Why this score? — see what drove the D+ grade
The composite is a weighted blend of 9 inputs, each scored 0–100. Each bar is that input's sub-score; the figure is the points it added to the 100-point composite (weight × sub-score).
- ARV discount +9.7/15.0
- Cash flow +7.8/30.0
- Appreciation +6.9/10.0
- 1% rule +5.1/10.0
- Schools +5.0/10.0
- Rent growth +4.3/5.0
- Livability +3.8/5.0
- Condition / age +2.5/5.0
- DSCR +1.9/10.0
$549,000
🖨 Deal sheet (PDF) 📄 Offer letter ✓ Due diligence
Listing remarks
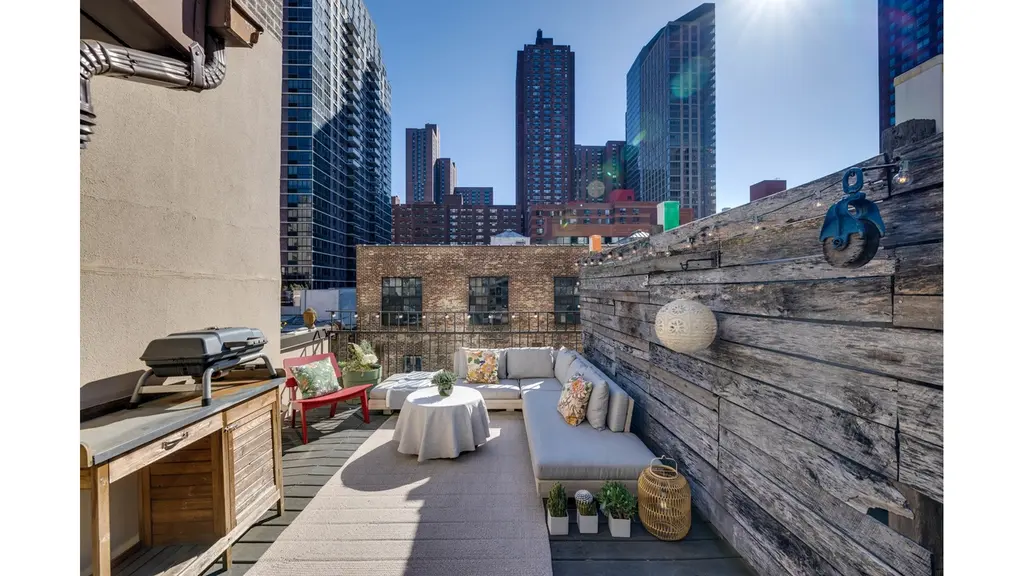
Welcome home to this stunning pre-war duplex penthouse with private roof terrace, spanning the top two floors of an elevator building on the Upper East Side. This one-bedroom, one-bathroom residence features a working wood-burning fireplace, gorgeous southern exposure, exposed brick, and a spa-worthy bathroom. The sleek, modern open kitchen is well designed with stainless appliances, including a Fisher & Paykel dishwasher, Gaggenau cooktop, Franke sink mahogany cabinets, glass tile backsplash, and custom concrete counters. A skylight-illuminated staircase leads to a peaceful bedroom with access to your own private roof terrace. The perfect setting for outdoor entertaining, morning
Key facts
- Modern open kitchen
- Exposed brick
- Private roof terrace
Tags
Property features AI
Finance
- Other: Building contains 29 total units; Pets allowed in building (restrictions apply)
- HOA & community: Monthly association fee
Exterior
- Home design: Condo/co-op in a 5-story building; Entry on 5th level; Zoned R8
- Construction: Building name: Fireside; Elevator in building
- Exterior features: Private outdoor terrace (over 60 sqft); South exposure; Has a view
Interior
- Kitchen: Dishwasher
- Bedrooms: 3 total rooms (bedroom count not specified)
- Bathrooms: 1 full bathroom
- Interior features: High ceilings; Building has a fireplace (1)
- Laundry & utility: Laundry located in building basement
Neighborhood map
What this means for you Summary
Snapshot
- This is a 1-bed/1.0-bath townhouse listed at $549k.
Deal economics
- At list price, monthly cash flow is $-617 ($-7k/yr) — negative.
- To cash-flow at today's rent, offer at most $460k (16.3% below list).
- Meets the 1% rule at list price ($6k rent vs $549k).
- Recommended offer: $460k (16.3% below list) — sets the bar for cash-flow.
- Cap rate 4.9% vs local median 2.6% in New York — top-decile yield for the area; either an underpriced asset or a hidden risk that comps aren't pricing in. Stress-test before assuming the spread holds.
Location & tenants
- Location reads 75/100 on livability (#268 in NY, #4,188 nationally) — a middle-class / working-renter tenant base. Strengths: amenities A+, commute A+, health & safety A; Watch: crime F, cost of living F.
- Zoned schools: Elm Tree Elementary School (math 27% / reading 52%, grade F, #1,444 of 2,108 statewide, top 71%, 806 students, 94% FRL); Mark Twain Is 239 For The Gifted And Talented (math 90% / reading 96%, grade A+, #6 of 729 statewide, top 1%, 1,207 students, 44% FRL); Midwood High School (math 94% / reading 96%, grade A+, #83 of 1,100 statewide, top 8%, 4,062 students, 73% FRL).
- Market conditions: Rents rising fast (+7.0%/yr); 313 active listings in the ZIP; 40 comparable units currently listed for rent nearby; rentals at typical pace (median 18d on market — plan ~3-4 weeks tenant-placement turnaround); high-income renter base; 4,467 units permitted in New York County in 2024 (4,463 in 5+ unit buildings).
- This rent runs 45% of the median local income ($148k/yr) — at the standard rent-burdened threshold; future hikes will face affordability resistance.
Forward outlook
- In year one you build about $24k of equity ($4k loan paydown + $21k appreciation (3.7% local appreciation)).
- New York County population projected at +21% by 2050 — long-run rental-demand tailwind backs the buy-and-hold thesis.
- By year 2, paydown + projected appreciation supports a ~$39k cash-out refi (75% LTV) — recoverable capital for the next deal without selling this one.
Negotiation context
- It's been on market 89 days — a 6% lower offer ($516k) is reasonable based on typical stale-listing flexibility.
- 7 sale attempts since 14y ago; this cycle's ask has dropped $100k (15%) from the opening price — seller is motivated, your offer sets the floor, not the list.
Risks & watch-outs
- Watch-outs: HOA is 22% of rent; built in 1920 — expect roof / HVAC / electrical / plumbing capex.
- Climate carrying-cost: major wind risk, 27% chance of damaging wind over 30y; extreme-heat days projected 7→15/yr by 2055 (HVAC capex compounding) — expect insurance premiums to compound above CPI over the hold.
Questions for the listing agent
- What do current leases actually rent for vs. the listed asking? Can we see a recent rent roll and the last 12 months of T-12 income?
- It's been on market 89 days. Have you received any prior offers? Is the seller open to a 16% concession, seller financing, or rate buy-down credit?
- Built in 1920 — when were the roof, HVAC, electrical panel, plumbing, and water heater last replaced?
- What does the HOA fee cover, when was the last increase, and are there any pending special assessments or reserve-fund shortfalls?
- Why hasn't it sold? Are there any deal-killer items the seller is aware of (foundation, flood, title, zoning, code violations)?
- Is there a deadline driving the sale (1031 exchange, divorce, estate, relocation)? That informs how much negotiation room exists.
- Schools are B-rated — typically a magnet for longer-tenancy family renters. What's the average tenant stay here, and is there a school-zone premium baked into asking?
- Crime grade is F in this area — have there been break-ins, vandalism, or insurance claims at this property in the last 3 years? What carrier currently insures it and at what premium?
- The area grade is low — what's the realistic commute time and amenity access for the typical tenant pool here? Any planned neighborhood developments (good or bad) we should know about?
- What's the average days-on-market for RENTAL listings here right now (not sales)? A rising rental-DOM trend means longer vacancies and softer asking-rent achievability than the comps imply.
- What's the recent tenant-quality profile in this submarket — average credit score on applications, eviction rate, late-payment / NSF rate, and stable-employment percentage? A property-management company in the area should have these aggregated.
- How much new for-sale + rental construction is in the pipeline within 1–3 miles? Heavy new supply typically softens prices + rents 12–24 months out; constrained supply supports both.
Investment metrics
- 1% rule
- 1.01% ✓
- Cap rate
- 4.94%
- Cash-on-cash
- -4.82%
- DSCR
- 0.79
- GRM
- 8.3
CMA / ARV
- ARV (on-the-fly)
- $577,500
- Comps found
- 2
Show comp detail 2 sales within ~0.75 mi
| Address | Dist | Beds/Ba | Sqft | Sold | Price | $/sf | Match |
|---|---|---|---|---|---|---|---|
| 313 E 89th St Unit 3E | 0.29mi | 1/1.0 | 550 (0%) | 22mo | $350,000 | $636 | 68 |
| 401 E 86 St Unit 12n | 0.47mi | 1/1.0 | 500 (-9%) | 12mo | $525,000 | $1,050 | 53 |
Match score weights: distance 35% · size 25% · config 20% · recency 20%. Top-matched comps best support the ARV.
Projected returns pro-forma
3.74% appreciation · 7.04% rent growth · sell at horizon
- IRR
- 7.7%
- Equity multiple
- 1.47×
- Total profit
- $72,703
- Equity at exit
- $269,914
- IRR
- 12.3%
- Equity multiple
- 3.15×
- Total profit
- $330,554
- Equity at exit
- $434,866
Cash invested: $153,720 (down + closing). Projections, not guarantees.
Landlord ↔ Tenant lean methodology
- Overall (CITY)
- 0 Strongly Tenant-Friendly
- State New York
- 15 Strongly Tenant-Friendly · D+10
- County
- — inherits STATE
- City New York
- 0 Strongly Tenant-Friendly · D+34
ZIP-level market 10128
- Home prices YoY
- 2.0%
- Rents YoY
- 7.0%
- Active inventory
- 313
- Price-to-rent
- 8.3×
Monthly cashflow live
- Estimated rent
- $5,530 high interval (Pro) →
- Mortgage (P&I)
- −$2,879
- Tax est. 1.5%
- −$686 /mo · $8,235/yr
- Insurance
- −$229
- HOA
- −$1,192
- Vacancy / Maint / Mgmt
- −$1,161
- Net cashflow
- $-617
Break-even live
Sensitivity live
| Price | -10% $-238 | -5% $-428 | +0% $-617 | +5% $-807 | +10% $-997 |
|---|---|---|---|---|---|
| Rent | -10% $-1,054 | -5% $-836 | +0% $-617 | +5% $-399 | +10% $-180 |
| Rate | -1.0pp $-341 | -0.5pp $-478 | base $-617 | +0.5pp $-760 | +1.0pp $-904 |
UW: 25.0% down · 7.5% · 30yr · 1.5% tax · 5.0% vac · 8.0% maint · 8.0% mgmt
Financing live
Cash to close
- Down payment
- $137,250
- Closing costs
- $16,470
- Reserves months
- —
- Total cash needed
- —
Loan-product check · same deal, 3 products live
Conventional
25% down · 7.5% · 30yr
- Down + closing
- —
- Monthly P&I
- —
- Monthly cashflow
- —
- DSCR
- —
- Eligible?
- —
Personal DTI + credit; lowest rate.
DSCR
20% down · 8.5% · 30yr
- Down + closing
- —
- Monthly P&I
- —
- Monthly cashflow
- —
- DSCR
- —
- Eligible?
- —
No personal income docs; deal must DSCR.
Hard money
10% down · 12.0% · 12mo
- Down + closing
- —
- Monthly P&I
- —
- Monthly cashflow
- —
- DSCR
- —
- Eligible?
- —
Short-term bridge; refi at stabilization.
Rent comps 40 comps
| Address | Beds | Baths | Sqft | Rent | $/sqft | DOM | Units | Dist |
|---|---|---|---|---|---|---|---|---|
| 215 E 95th St #1293 New York, NY | 1.0–2.0 | 1.0–1.5 | 740 | $5,420 | $7.32 | 1d | 2 | 0.04mi |
| 215 E 96th St Unit 688 New York, NY | 1.0 | 1.0 | 717 | $7,810 | $10.89 | 0d | 1 | 0.08mi |
| 175 E 96th St Unit 1251683P New York, NY | 2.0 | 1.0 | 600 | $5,305 | $8.84 | 4d | 2 | 0.14mi |
| 345 E 94th St #1470 New York, NY | 2.0 | 1.0–2.0 | 710 | $5,645 | $7.95 | 5d | 3 | 0.16mi |
| 1501 Lexington Ave #932 New York, NY | 1.0 | 1.0 | 583 | $7,403 | $12.69 | 1d | 3 | 0.20mi |
| 354 E 91st St #648 New York, NY | 1.0–2.0 | 1.0 | 692 | $5,520 | $7.97 | 1d | 2 | 0.27mi |
| 235 E 89th St Unit 1495783P New York, NY | 2.0 | 1.0 | 699 | $7,443 | $10.65 | 22d | 1 | 0.30mi |
| 200 E 89th St Unit 12G New York, NY | 1.0 | 1.0 | 650 | $5,000 | $7.69 | 19d | 1 | 0.34mi |
| 122 E 102nd St Unit 1021896P New York, NY | 2.0 | 1.0 | 742 | $5,429 | $7.32 | 18d | 1 | 0.40mi |
| 160 E 88th St #1332 New York, NY | 1.0 | 1.0 | 560 | $5,670 | $10.12 | 8d | 1 | 0.42mi |
| 315 E 86th St Unit 1327 New York, NY | 1.0 | 2.0 | 726 | $6,460 | $8.90 | 26d | 1 | 0.44mi |
| 201 E 86th St #298 New York, NY | 1.0–2.0 | 1.0–1.5 | 700 | $7,210 | $10.30 | 1d | 2 | 0.45mi |
| 244 E 86th St #604 New York, NY | 1.0–2.0 | 1.0–2.0 | 950 | $4,920 | $5.18 | 5d | 2 | 0.48mi |
| 501 E 87th St #2094 New York, NY | 1.0 | 1.0 | 618 | $7,050 | $11.41 | 1d | 2 | 0.51mi |
| 515 E 86th St Unit 589 New York, NY | 1.0 | 1.0 | 695 | $6,070 | $8.73 | 21d | 1 | 0.57mi |
| 515 E 86th St Unit 1760 New York, NY | 1.0 | 1.0 | 485 | $5,360 | $11.05 | 1d | 1 | 0.57mi |
| 1567 York Ave Unit 1021866P New York, NY | 2.0 | 1.0 | 742 | $5,910 | $7.96 | 24d | 1 | 0.67mi |
| 200 E 82nd St #505 New York, NY | 2.0 | 1.0 | 636 | $6,715 | $10.55 | 3d | 3 | 0.69mi |
| 501 1/2 E 83rd St #1998 New York, NY | 2.0 | 1.0 | 525 | $4,710 | $8.97 | 26d | 2 | 0.70mi |
| 301 E 79th St Unit 28P New York, NY | 1.0 | 1.0 | 700 | $5,500 | $7.86 | 26d | 1 | 0.81mi |
| 420 E 80th St #198 New York, NY | 1.0 | 1.0 | 623 | $4,760 | $7.64 | 20d | 1 | 0.82mi |
| 1001 5th Ave Unit 3 New York, NY | 1.0 | 1.0 | 450 | $5,400 | $12.00 | 26d | 1 | 0.83mi |
| 315 E 78th St Unit 1021894P New York, NY | 1.0 | 1.0 | 548 | $5,643 | $10.30 | 24d | 1 | 0.87mi |
| 315 E 78th St Unit 1021847P New York, NY | 1.0 | 1.0 | 516 | $4,880 | $9.46 | 21d | 1 | 0.87mi |
| 315 E 78th St Unit 1021885P New York, NY | 1.0 | 1.0 | 516 | $6,242 | $12.10 | 1d | 1 | 0.87mi |
| 315 E 78th St Unit 1021994P New York, NY | 1.0 | 1.0 | 441 | $5,037 | $11.42 | 22d | 1 | 0.87mi |
| 347 E 78th St Unit 1530420P New York, NY | 2.0 | 1.0 | 645 | $6,270 | $9.72 | 24d | 1 | 0.87mi |
| 347 E 78th St Unit 1460467P New York, NY | 2.0 | 1.0 | 645 | $7,606 | $11.79 | 26d | 1 | 0.87mi |
| 308 E 78th St #2024 New York, NY | 1.0–2.0 | 1.0 | 550 | $4,610 | $8.38 | 26d | 2 | 0.90mi |
| 231 E 76th St #1530 New York, NY | 1.0 | 1.0 | 650 | $6,470 | $9.95 | 22d | 1 | 0.96mi |
| 240e E 75th St Unit 1021876P New York, NY | — | 1.0 | 441 | $5,981 | $13.56 | 9d | 1 | 1.03mi |
| 240e E 75th St Unit 1021873P New York, NY | — | 1.0 | 441 | $5,227 | $11.85 | 7d | 1 | 1.03mi |
| 952 5th Ave #998 New York, NY | 1.0–2.0 | 1.0 | 800 | $6,460 | $8.07 | 1d | 2 | 1.07mi |
| 888 Main St New York, NY | 3.0 | 1.0–2.0 | 908 | $4,928 | $5.43 | 1d | 8 | 1.08mi |
| 7 E 75th St #1615 New York, NY | 1.0–3.0 | 1.0–2.0 | 656 | $4,850 | $7.39 | 1d | 3 | 1.10mi |
| 1373 1st Ave Unit 1952 New York, NY | 2.0 | 2.0 | 650 | $7,260 | $11.17 | 26d | 1 | 1.10mi |
| 70 W 95th St New York, NY | 1.0–4.0 | 1.0–2.0 | 1095 | $9,999 | $9.13 | 19d | 1 | 1.15mi |
| 43 W 85th St Unit 1470323P New York, NY | 1.0 | 1.0 | 699 | $6,466 | $9.25 | 7d | 1 | 1.22mi |
| 515 E 72nd St Unit 17D New York, NY | 1.0 | 1.0 | 687 | $5,500 | $8.01 | 26d | 1 | 1.22mi |
| 808 Columbus Ave New York, NY | 2.0 | 1.0–2.0 | 773 | $6,906 | $8.93 | 0d | 30 | 1.23mi |
HOA detail
- Monthly dues
- $1,192 · $14,304/yr
Listing history 20 events
-
2026-06-21days on market $549,000 Active 89 DOM
-
2026-06-18days on market $549,000 Active 86 DOM
-
2026-06-17pricedays on market $549,000 Active 85 DOM
-
2026-06-15days on market $595,000 Active 83 DOM
-
2026-06-13days on market $595,000 Active 81 DOM
-
2026-06-10days on market $595,000 Active 77 DOM
-
2026-06-08days on market $595,000 Active 76 DOM
-
2026-06-08days on market $595,000 Active 75 DOM
-
2026-06-04days on market $595,000 Active 72 DOM
-
2026-06-03days on market $595,000 Active 71 DOM
-
2026-06-01days on market $595,000 Active 69 DOM
-
2026-05-31days on market $595,000 Active 68 DOM
-
2026-05-13price $595,000
-
2026-03-24$649,000 Active
-
2017-07-06$575,000
-
2017-07-06$595,000
-
2013-07-23$475,000
-
2013-07-23$475,000
-
2012-11-29$550,000
-
2012-09-04$550,000
ⓘ Source: listings_history table (triggers on properties + properties_extension) + one-shot
backfill from property_details.listing_events for pre-trigger history.
Climate risk First Street
- Flood 4/10 Moderate FEMA zone X (unshaded) · 13% chance over 30 yrs
- Wildfire 1/10 Low
- Heat 6/10 Major 7 d/yr ≥99°F today · 15 d/yr by 30 yrs out
- Wind 6/10 Major 27% chance of damaging wind over 30 yrs
- Air quality 4/10 Moderate 5 unhealthy d/yr today · 6 by 30 yrs out
Nearby sold comps map
Loading sold comps map…
Walkable amenities ~0.75 mi
Loading nearby amenities…
Taxation est. · year 1
- Rental income
- $66,360
- − Mortgage interest
- −$30,753
- − Property taxes
- −$8,235
- − Insurance
- −$2,745
- − Repairs & maintenance
- −$5,309
- − Management
- −$5,309
- − HOA
- −$14,304
- − Depreciation
- −$15,971
- Taxable loss
- −$16,265
- Est. tax savings @ 24.0%
- +$3,904
- After-tax cash flow
- $-3,504/yr
For passive investors: Depreciation is non-cash, so a rental often shows a tax loss while cash-flowing — sheltering income. Rental losses are passive: they offset passive income freely, and up to $25,000/yr can offset ordinary (W-2) income if you actively participate and your MAGI is under $100k (phasing out to $0 by $150k); unused losses carry forward. On sale, claimed depreciation is recaptured at up to 25%, and gains may owe capital-gains tax (a 1031 exchange can defer both). Figures are a year-1 estimate at your 24.0% rate — not tax advice; consult a CPA.
Schools (NCES district)
No district data.
Livability — New York
- Score
- 75/100
- State rank
- #268
- US rank
- #4188
Category grades
Schools grade is shown separately in the Schools card above.
Census & demographics
- Census place
- New York, NY
- County
- New York County · 1,599,927 people
- City population
- 7,731,280
- Metro
- New York-Newark-Jersey City, NY-NJ-PA
- Population (ZIP)
- 57,976
- Household income
- $147,772
- Rent vs Own
- Severe rent burden
- 4892.0
Population outlook (New York County) Hauer SSP2
- Today (2025)
- 1,825,725 people
- By 2030
- 1,904,611 · +4.3%
- By 2040
- 2,052,719 · +12.4%
- By 2050
- 2,206,601 · +20.9%
- By 2075
- 2,509,427 · +37.4%
- By 2100
- 2,702,933 · +48.0%
Race, ethnicity, and origin ACS 2023
- Neighborhood character
- Predominantly White (67%)
- Race & ethnicity
- White 67% Hispanic / Latino 13% Asian 10% Two or more races 9% Black 5%
- Hispanic origin (detail)
- Mexican 2% Puerto Rican 3% Cuban 1% Dominican 2%
- Common ancestry
- Scotch-Irish 6% Romanian 6% Lithuanian 2%
- Foreign-born
- 25% · Canada, China, South Korea
- Languages at home
- 71% English-only · Spanish 9% Other Indo-European 6% Other Asian/Pacific 3%
Political lean MEDSL · New York
- 2024 margin
- Solid D (+64.8) · D 82.4% · R 17.6%
- 2008→2024 swing
- -7.4pp toward R · 2008: 72.2pp · 2024: 64.8pp
- All cycles
- 2024: D+64.8 2020: D+74.5 2016: D+77.2 2012: D+69.6 2008: D+72.2
Not yet ingested
- Civics
- —
Market trends
- HPI YoY
- ▲ 3.74%
- Current HPI
- 187.2161
- Rent YoY
- ▲ 7.04%
- Metro
- New York-Newark-Jersey City, NY-NJ-PA
- State GDP YoY
- ▲ 2.60%
- F500 in state
- 92
Industry mix (Fortune 500 HQ in NY)
| Industry | F500 HQs | Revenue |
|---|---|---|
| Financial Services | 10 | $950B |
|
||
| Consumer Goods | 9 | $162B |
|
||
| Insurance | 4 | $225B |
|
||
| Telecommunications | 2 | $144B |
|
||
| Pharmaceuticals | 2 | $112B |
|
||
| Media / Entertainment | 2 | $69B |
|
||
Price history
+8.2% since first listed8 events — show timeline
- 2026-05-13 Price Changed $595,000 RLS at REBNY
- 2026-03-24 Listed $649,000 RLS at REBNY
- 2017-07-06 Listed $595,000 RLS at REBNY
- 2017-07-06 Listed $575,000 RLS at REBNY
- 2013-07-23 Listed $475,000 RLS at REBNY
- 2013-07-23 Listed $475,000 RLS at REBNY
- 2012-11-29 Listed $550,000 RLS at REBNY
- 2012-09-04 Listed $550,000 RLS at REBNY
Cash-flow waterfall
monthlySold comps — $/sqft
last 12 mo · ≤1 miLoading sold comps…