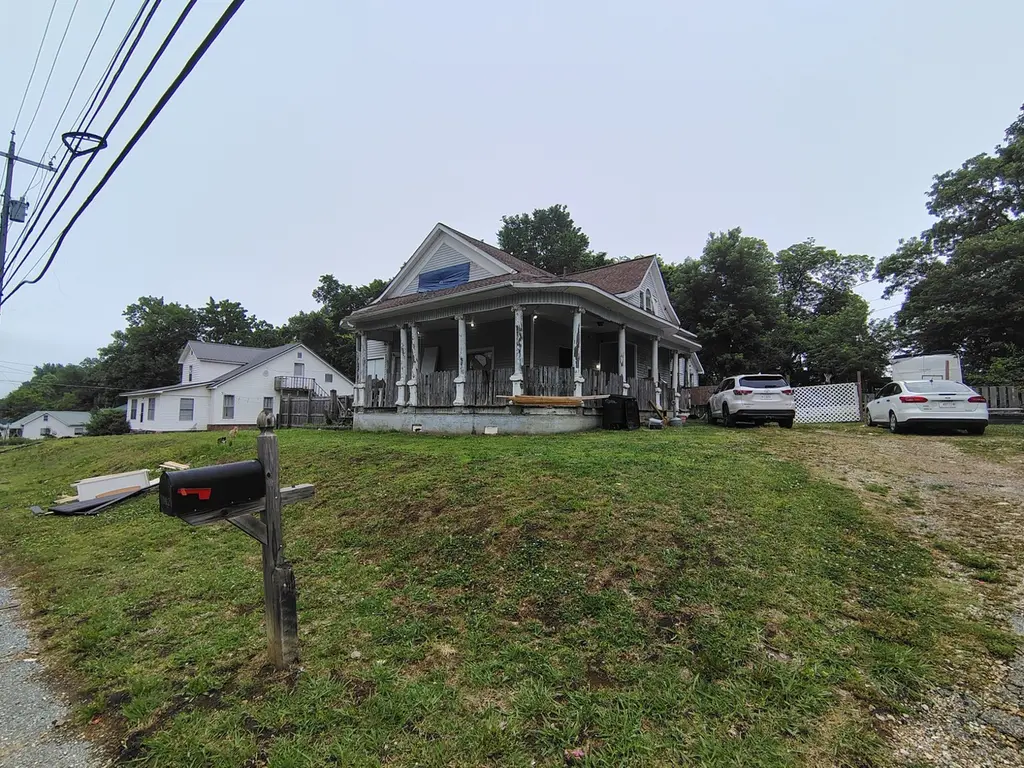
112 N Grayson St · Newbern, TN
Flood risk 1/10 · Minimal
- FEMA flood zone
- X (unshaded)
- Chance of flooding over 30 yrs
- 0.0%
- Est. flood insurance / yr
- $507 – $1,088
Fire risk 1/10 · Minimal
- Est. fire insurance / yr
- $949 – $1,763
Heat risk 6/10 · Moderate
- Hot days now (above 107°F)
- 7 days/yr
- Hot days in 30 yrs
- 21 days/yr
Wind risk 4/10 · Minor
- Chance of severe wind over 30 yrs
- 9.0%
Air-quality risk 2/10 · Minimal
- Unhealthy air days now
- 0 days/yr
- Unhealthy air days in 30 yrs
- 1 days/yr
Risk factors via First Street. Map © Google.
Why this score? — see what drove the C grade
The composite is a weighted blend of 9 inputs, each scored 0–100. Each bar is that input's sub-score; the figure is the points it added to the 100-point composite (weight × sub-score).
- Cash flow +25.5/30.0
- DSCR +8.5/10.0
- ARV discount +7.5/15.0
- 1% rule +5.6/10.0
- Livability +3.5/5.0
- Schools +3.3/10.0
- Rent growth +2.5/5.0
- Condition / age +2.5/5.0
- Appreciation +0.0/10.0
$125,000
🖨 Deal sheet 📄 Offer letter ✓ Due diligence
Listing remarks
112 N Grayson St, Newbern, TN 38059 offers 5 bedrooms and 1.5 baths across 2,410 sq ft of living space. Recently updated with a new roof and fully upgraded electrical and plumbing systems. The HVAC system and ductwork are brand new for improved efficiency. Spacious layout with great potential for customization. Property sold AS-IS
Key facts
- New ductwork
- New roof
- 0.42 acre lot
Tags
Property features AI
Exterior
- Parking: No designated covered or total parking spaces listed
- Utilities: Electricity available; Water available; Public water; Public sewer
- Home design: Single-family residential home; One level
- Construction: Wood siding exterior; Existing structure (year built listed as existing)
- Exterior features: Lot approximately 0.42 acres (101 x 185 irregular); Public water and public sewer available
Interior
- Kitchen: Kitchen (approx. 14x16)
- Bedrooms: 5 bedrooms total; 1 bedroom on the main level; Bedroom sizes include 16x18, 12x13, 12x12, 11x12
- Flooring: Wood flooring; Laminate flooring
- Bathrooms: 2 full bathrooms; 1 half bathroom
- Heating & cooling: Electric heating; Electric cooling; Additional heating/cooling: Other
- Interior features: No basement; Wood and laminate flooring; Energy-efficient windows
- Laundry & utility: No appliances listed
Neighborhood map
What this means for you Summary
Snapshot
- This is a 5-bed/3.0-bath single-family listed at $125k.
Deal economics
- At list price, monthly cash flow is $292 ($4k/yr) — positive.
- The deal already cash-flows at list — no discount required.
- Meets the 1% rule at list price ($1k rent vs $125k).
- Recommended offer: $123k (1.5% below list) — sets the bar for market timing.
- Cap rate 9.1% vs local median 3.9% in Newbern — top-decile yield for the area; either an underpriced asset or a hidden risk that comps aren't pricing in. Stress-test before assuming the spread holds.
Location & tenants
- Location reads 69/100 on livability (#75 in TN) — a middle-class / working-renter tenant base. Strengths: cost of living A+, housing A+, health & safety A+; Watch: amenities F, commute F, employment F.
- Dyer County (rural): math 40% / reading 38% proficiency, ranked #16 of 139 in TN (top 12%) — families likely to look elsewhere, expect single-tenant / working-renter base with shorter leases.
- Zoned schools: Newbern Elementary School (math 39% / reading 33%, grade F, #305 of 952 statewide, top 32%, 561 students, 0% FRL); Dyer County High School (math 21% / reading 48%, grade F, #41 of 332 statewide, top 15%, 1,070 students, 0% FRL) — zoned schools average 0% FRL vs 54% district-wide (54 pts lower); this property's tenant base skews higher-income than the district average.
- Market conditions: 34 active listings in the ZIP; 74 units permitted in Dyer County in 2024 (6 in 5+ unit buildings).
Forward outlook
- Local home prices are declining (-3.0%/yr); year-one equity from $864 of loan paydown is wiped out by about $4k of value loss. Plan a longer hold.
- Dyer County population projected at -13% by 2050 — secular population decline; favor cash flow + early exit over multi-decade hold.
Negotiation context
- It's been on market 16 days — a 2% lower offer ($123k) is reasonable based on typical stale-listing flexibility.
Risks & watch-outs
- Watch-outs: built in 1924 — expect roof / HVAC / electrical / plumbing capex.
- Climate carrying-cost: extreme-heat days projected 7→21/yr by 2055 (HVAC capex compounding) — expect insurance premiums to compound above CPI over the hold.
Questions for the listing agent
- Built in 1924 — when were the roof, HVAC, electrical panel, plumbing, and water heater last replaced?
- Is there a deadline driving the sale (1031 exchange, divorce, estate, relocation)? That informs how much negotiation room exists.
- Schools are D-rated, which usually means shorter tenancies and higher turnover. Who's the typical renter profile here, and what's been the actual vacancy rate?
- What's the average days-on-market for RENTAL listings here right now (not sales)? A rising rental-DOM trend means longer vacancies and softer asking-rent achievability than the comps imply.
- What's the recent tenant-quality profile in this submarket — average credit score on applications, eviction rate, late-payment / NSF rate, and stable-employment percentage? A property-management company in the area should have these aggregated.
- How much new for-sale + rental construction is in the pipeline within 1–3 miles? Heavy new supply typically softens prices + rents 12–24 months out; constrained supply supports both.
Investment metrics
- 1% rule
- 1.06% ✓
- Cap rate
- 9.10%
- Cash-on-cash
- 10.01%
- DSCR
- 1.45
- GRM
- 7.8
CMA / ARV
No comps found within radius.
Projected returns pro-forma
-3.0% appreciation · 3.0% rent growth · sell at horizon
- IRR
- -1.3%
- Equity multiple
- 0.95×
- Total profit
- $-1,698
- Equity at exit
- $18,638
- IRR
- 8.4%
- Equity multiple
- 1.64×
- Total profit
- $22,291
- Equity at exit
- $10,808
Cash invested: $35,000 (down + closing). Projections, not guarantees.
Landlord ↔ Tenant lean methodology
- Overall (STATE)
- 87 Strongly Landlord-Friendly
- State Tennessee
- 87 Strongly Landlord-Friendly · R+13
- County
- — inherits STATE
- City
- — inherits STATE
ZIP-level market 38059
- Home prices YoY
- -11.8%
- Active inventory
- 34
- Price-to-rent
- 7.8×
Monthly cashflow live
- Estimated rent
- $1,328 medium interval (Pro) →
- Mortgage (P&I)
- −$656
- Tax from tax record
- −$50 /mo · $596/yr
- Insurance
- −$52
- HOA
- −$0
- Vacancy / Maint / Mgmt
- −$279
- Net cashflow
- $292
Break-even live
UW: 25.0% down · 7.5% · 30yr · 1.5% tax · 5.0% vac · 8.0% maint · 8.0% mgmt
Financing live
Cash to close
- Down payment
- $31,250
- Closing costs
- $3,750
- Reserves months
- —
- Total cash needed
- —
Loan-product check · same deal, 3 products live
Conventional
25% down · 7.5% · 30yr
- Down + closing
- —
- Monthly P&I
- —
- Monthly cashflow
- —
- DSCR
- —
- Eligible?
- —
Personal DTI + credit; lowest rate.
DSCR
20% down · 8.5% · 30yr
- Down + closing
- —
- Monthly P&I
- —
- Monthly cashflow
- —
- DSCR
- —
- Eligible?
- —
No personal income docs; deal must DSCR.
Hard money
10% down · 12.0% · 12mo
- Down + closing
- —
- Monthly P&I
- —
- Monthly cashflow
- —
- DSCR
- —
- Eligible?
- —
Short-term bridge; refi at stabilization.
Listing history 13 events
-
2026-06-19days on market $125,000 Active 16 DOM
-
2026-06-18days on market $125,000 Active 15 DOM
-
2026-06-17days on market $125,000 Active 14 DOM
-
2026-06-16days on market $125,000 Active 13 DOM
-
2026-06-15pricedays on market $125,000 Active 12 DOM
-
2026-06-14days on market $130,000 Active 10 DOM
-
2026-06-12days on market $130,000 Active 9 DOM
-
2026-06-09days on market $130,000 Active 6 DOM
-
2026-06-08days on market $130,000 Active 5 DOM
-
2026-06-07days on market $130,000 Active 4 DOM
-
2026-06-07days on market $130,000 Active 3 DOM
-
2026-06-03remarks 332-char remark
-
2026-06-03$130,000 Active 1 DOM
ⓘ Source: listings_history table (triggers on properties + properties_extension) + one-shot
backfill from property_details.listing_events for pre-trigger history.
Tax reassessment forecast TN · Resets to sale price
- Current annual tax
- $596 · $50/mo
- Projected year-2 tax
- $888 · $74/mo
- Expected delta
- +$292/yr (+$24/mo · 48.9%)
ⓘ Screening estimate from a state-policy table — verify with the county assessor before closing.
Climate risk First Street
- Flood 1/10 Low FEMA zone X (unshaded) · 0% chance over 30 yrs
- Wildfire 1/10 Low
- Heat 6/10 Major 7 d/yr ≥107°F today · 21 d/yr by 30 yrs out
- Wind 4/10 Moderate 9% chance of damaging wind over 30 yrs
- Air quality 2/10 Low 0 unhealthy d/yr today · 1 by 30 yrs out
Nearby sold comps map
Loading sold comps map…
Walkable amenities ~0.75 mi
Loading nearby amenities…
Taxation est. · year 1
- Rental income
- $15,939
- − Mortgage interest
- −$7,002
- − Property taxes
- −$596
- − Insurance
- −$625
- − Repairs & maintenance
- −$1,275
- − Management
- −$1,275
- − Depreciation
- −$3,636
- Taxable income
- $1,530
- Est. tax owed @ 24.0%
- −$367
- After-tax cash flow
- $3,138/yr
For passive investors: Depreciation is non-cash, so a rental often shows a tax loss while cash-flowing — sheltering income. Rental losses are passive: they offset passive income freely, and up to $25,000/yr can offset ordinary (W-2) income if you actively participate and your MAGI is under $100k (phasing out to $0 by $150k); unused losses carry forward. On sale, claimed depreciation is recaptured at up to 25%, and gains may owe capital-gains tax (a 1031 exchange can defer both). Figures are a year-1 estimate at your 24.0% rate — not tax advice; consult a CPA.
Schools (NCES district)
- District
- Dyer County
- NCES district ID
- 4701050
- Math proficiency
- 40% ▼ -14.00%
- Reading proficiency
- 38% ▼ -1.00%
- Median HH income
- $44,865
- Composite
- 33.19/100
- National rank
- #5536
- State rank
- #16 of 139 in TN
Livability — Newbern
- Score
- 69/100
- State rank
- #75
- US rank
- #9033
Category grades
Schools grade is shown separately in the Schools card above.
Census & demographics
- Census place
- Newbern, TN
- Population (ZIP)
- 8,822
Population outlook (Dyer County) Hauer SSP2
- Today (2025)
- 36,770 people
- By 2030
- 35,863 · -2.5%
- By 2040
- 33,989 · -7.6%
- By 2050
- 32,124 · -12.6%
- By 2075
- 28,702 · -21.9%
- By 2100
- 25,745 · -30.0%
Race, ethnicity, and origin ACS 2023
- Neighborhood character
- Predominantly White (82%)
- Race & ethnicity
- White 82% Two or more races 9% Hispanic / Latino 7% Black 5%
- Hispanic origin (detail)
- Mexican 7%
- Common ancestry
- Serbian 6% Lithuanian 6% Slovak 1%
- Foreign-born
- 1% · Canada
- Languages at home
- 99% English-only · Spanish 1%
Political lean MEDSL · Dyer
- 2024 margin
- Solid R (+61.8) · D 18.8% · R 80.6%
- 2008→2024 swing
- -24.1pp toward R · 2008: -37.7pp · 2024: -61.8pp
- All cycles
- 2024: R+61.8 2020: R+57.1 2016: R+55.4 2012: R+44.7 2008: R+37.7
Not yet ingested
- Civics
- —
Market trends
- HPI YoY
- ▼ -28.08%
- Current HPI
- 209.849
- Rent YoY
- —
- Metro
- —
- State GDP YoY
- ▲ 2.78%
- F500 in state
- 22
Industry mix (Fortune 500 HQ in TN)
| Industry | F500 HQs | Revenue |
|---|---|---|
| Healthcare | 3 | $91B |
|
||
| Retail | 3 | $72B |
|
||
| Transportation / Logistics | 1 | $88B |
|
||
| Paper / Packaging | 1 | $19B |
|
||
| Insurance | 1 | $13B |
|
||
| Energy | 1 | $12B |
|
||
Price history
1 event — show timeline
- 2026-06-03 Listed $130,000 REALTRACS as Distributed by MLS Grid
Property tax history
-0.6%/yrLatest (2025): $596 · +5.5% YoY. Source: county tax records.
Cash-flow waterfall
monthlySold comps — $/sqft
last 12 mo · ≤1 miLoading sold comps…