 Duplex
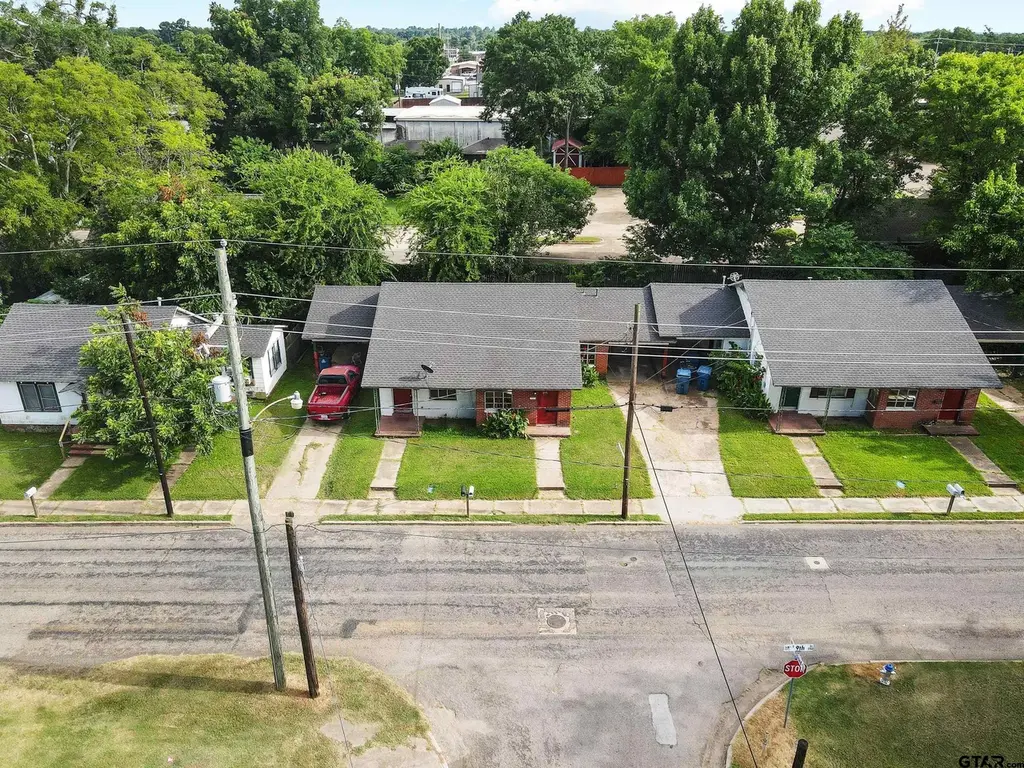
104-110/204 E 9th St · Mount Pleasant, TX
Flood risk 1/10 · Minimal
- FEMA flood zone
- X (unshaded)
- Chance of flooding over 30 yrs
- 0.0%
- Est. flood insurance / yr
- $507 – $1,088
Fire risk 5/10 · Moderate
- Est. fire insurance / yr
- $1,222 – $2,270
Heat risk 7/10 · Major
- Hot days now (above 113°F)
- 7 days/yr
- Hot days in 30 yrs
- 23 days/yr
Wind risk 6/10 · Moderate
- Chance of severe wind over 30 yrs
- 27.0%
Air-quality risk 2/10 · Minimal
- Unhealthy air days now
- 1 days/yr
- Unhealthy air days in 30 yrs
- 1 days/yr
Risk factors via First Street. Map © Google.
Why this score? — see what drove the C+ grade
The composite is a weighted blend of 9 inputs, each scored 0–100. Each bar is that input's sub-score; the figure is the points it added to the 100-point composite (weight × sub-score).
- Cash flow +27.0/30.0
- DSCR +9.3/10.0
- ARV discount +7.5/15.0
- 1% rule +7.3/10.0
- Livability +3.9/5.0
- Schools +3.7/10.0
- Rent growth +2.5/5.0
- Condition / age +1.0/5.0
- Appreciation +0.0/10.0
$285,000
🖨 Deal sheet (PDF) 📄 Offer letter ✓ Due diligence
Multi-family units
County records classify this as Multi-Family (2-4 Unit). Listing-text estimate: 2 units. confirmed
Listing remarks MLS
Don’t miss this unique multi-unit investment opportunity in the heart of Mount Pleasant! This property includes a duplex style property offering four 1-bedroom, 1-bathroom units, each with a living room and kitchen, perfect for rental income once renovated. With strong bones and spacious layouts, these units are ready for a full remodel and the right investor’s touch. In addition, the property includes a charming white home featuring 2 bedrooms, 1 bathroom, a dining room, and a kitchen. Whether you're looking to expand your rental portfolio, flip for profit, or create a unique mixed-use property, this setup provides the flexibility and square footage to do it all.
Key facts
- Full remodel
- Dining room
- Rental income
Tags
Neighborhood map
What this means for you Summary
Snapshot
- This is a 2 × 2-bed/?-bath units multifamily listed at $285k. Condition is rated poor.
Deal economics
- At list price, monthly cash flow is $799 ($10k/yr) — positive. Per door: $399/mo.
- The deal already cash-flows at list — no discount required.
- Meets the 1% rule at list price ($4k rent vs $285k).
- Recommended offer: $251k (12.0% below list) — sets the bar for market timing.
- Cap rate 9.7% vs local median 3.4% in Mount Pleasant — top-decile yield for the area; either an underpriced asset or a hidden risk that comps aren't pricing in. Stress-test before assuming the spread holds.
Location & tenants
- Location reads 77/100 on livability (#81 in TX, #2,808 nationally) — a middle-class / working-renter tenant base. Strengths: cost of living A+, housing A+, health & safety A+; Watch: employment C-, amenities D-, commute F.
- Mount Pleasant ISD (town): math 45% / reading 44% proficiency, ranked #291 of 826 in TX (top 35%) — families likely to look elsewhere, expect single-tenant / working-renter base with shorter leases; 74% free/reduced lunch — lower-income household profile, screen leases tightly.
- Zoned schools: Annie Sims El (math 47% / reading 52%, grade D, #865 of 4,322 statewide, top 21%, 493 students, 76% FRL); Mount Pleasant J H (math 40% / reading 45%, grade D-, #553 of 1,662 statewide, top 34%, 760 students, 81% FRL); Mount Pleasant H S (math 68% / reading 54%, grade C+, #258 of 1,632 statewide, top 16%, 1,521 students, 79% FRL).
- Market conditions: 382 active listings in the ZIP; 1 comparable units currently listed for rent nearby; 47 units permitted in Titus County in 2024 (10 in 5+ unit buildings).
- At $3,504/mo this rent would consume 75% of the median local household income ($56k/yr) (locally 758% of renters already pay >50% of income on rent) — very limited rent-growth headroom before tenants either downsize or default.
Forward outlook
- Local home prices are declining (-3.0%/yr); year-one equity from $2k of loan paydown is wiped out by about $9k of value loss. Plan a longer hold.
- At projected returns (-3.0% appreciation + 3.0% rent growth), your $80k cash investment doubles in ~10 years — after that, you're playing with house money.
Negotiation context
- It's been on market 179 days — a 12% lower offer ($251k) is reasonable based on typical stale-listing flexibility.
- 3 sale attempts with the ask held roughly flat each time — persistent listings suggest the price (not the market) is what's stuck; bring a comps-based counter.
Risks & watch-outs
- Watch-outs: built in 1952 — expect roof / HVAC / electrical / plumbing capex.
- Climate carrying-cost: major wind risk, 27% chance of damaging wind over 30y; moderate wildfire risk; extreme-heat days projected 7→23/yr by 2055 (HVAC capex compounding) — expect insurance premiums to compound above CPI over the hold.
Questions for the listing agent
- It's been on market 179 days. Have you received any prior offers? Is the seller open to a 12% concession, seller financing, or rate buy-down credit?
- Can we see the unit-by-unit rent roll, current vacancy, and any below-market leases? What's the average tenancy length?
- What capital expenditures (roof, boiler, parking lot, exteriors) have been made in the last 5 years, and what's planned in the next 2?
- Have any recent inspections been done? Can we get a copy of the seller's disclosures and any deferred-maintenance estimates?
- Built in 1952 — when were the roof, HVAC, electrical panel, plumbing, and water heater last replaced?
- Why hasn't it sold? Are there any deal-killer items the seller is aware of (foundation, flood, title, zoning, code violations)?
- Is there a deadline driving the sale (1031 exchange, divorce, estate, relocation)? That informs how much negotiation room exists.
- Schools are D-rated, which usually means shorter tenancies and higher turnover. Who's the typical renter profile here, and what's been the actual vacancy rate?
- What's the average days-on-market for RENTAL listings here right now (not sales)? A rising rental-DOM trend means longer vacancies and softer asking-rent achievability than the comps imply.
- What's the recent tenant-quality profile in this submarket — average credit score on applications, eviction rate, late-payment / NSF rate, and stable-employment percentage? A property-management company in the area should have these aggregated.
- How much new apartment / multifamily construction is in the pipeline within 1–3 miles? Heavy new supply (>2% of stock underway) typically softens rents 12–24 months out; light construction supports rent growth.
Investment metrics
- 1% rule
- 1.23% ✓
- Cap rate
- 9.66%
- Cash-on-cash
- 12.01%
- DSCR
- 1.53
- GRM
- 6.8
CMA / ARV
No comps found within radius.
Projected returns pro-forma
-3.0% appreciation · 3.0% rent growth · sell at horizon
- IRR
- 1.5%
- Equity multiple
- 1.06×
- Total profit
- $4,733
- Equity at exit
- $42,494
- IRR
- 11.2%
- Equity multiple
- 1.88×
- Total profit
- $69,830
- Equity at exit
- $24,642
Cash invested: $79,800 (down + closing). Projections, not guarantees.
Landlord ↔ Tenant lean methodology
- Overall (STATE)
- 87 Strongly Landlord-Friendly
- State Texas
- 87 Strongly Landlord-Friendly · R+5
- County
- — inherits STATE
- City
- — inherits STATE
ZIP-level market 75455
- Home prices YoY
- -27.0%
- Active inventory
- 382
- Price-to-rent
- 13.6×
Monthly cashflow live
- Estimated rent
- $3,504 medium interval (Pro) →
- Mortgage (P&I)
- −$1,495
- Tax est. 1.5%
- −$356 /mo · $4,275/yr
- Insurance
- −$119
- HOA
- −$0
- Vacancy / Maint / Mgmt
- −$736
- Net cashflow
- $799
Break-even live
Sensitivity live
| Price | -10% $996 | -5% $897 | +0% $799 | +5% $700 | +10% $602 |
|---|---|---|---|---|---|
| Rent | -10% $522 | -5% $660 | +0% $799 | +5% $937 | +10% $1,075 |
| Rate | -1.0pp $942 | -0.5pp $871 | base $799 | +0.5pp $725 | +1.0pp $650 |
2-unit breakdown (identical units grouped — click to expand)
| Units | Beds | Baths | Est. rent |
|---|---|---|---|
| 2× units | 2 | — | $3,504 |
| #1 | 2 | — | $1,752 |
| #2 | 2 | — | $1,752 |
| Total (2 units) | $3,504 | ||
UW: 25.0% down · 7.5% · 30yr · 1.5% tax · 5.0% vac · 8.0% maint · 8.0% mgmt
Financing live
Cash to close
- Down payment
- $71,250
- Closing costs
- $8,550
- Reserves months
- —
- Total cash needed
- —
Loan-product check · same deal, 3 products live
Conventional
25% down · 7.5% · 30yr
- Down + closing
- —
- Monthly P&I
- —
- Monthly cashflow
- —
- DSCR
- —
- Eligible?
- —
Personal DTI + credit; lowest rate.
DSCR
20% down · 8.5% · 30yr
- Down + closing
- —
- Monthly P&I
- —
- Monthly cashflow
- —
- DSCR
- —
- Eligible?
- —
No personal income docs; deal must DSCR.
Hard money
10% down · 12.0% · 12mo
- Down + closing
- —
- Monthly P&I
- —
- Monthly cashflow
- —
- DSCR
- —
- Eligible?
- —
Short-term bridge; refi at stabilization.
Rent comps 1 comps
| Address | Beds | Baths | Sqft | Rent | $/sqft | DOM | Units | Dist |
|---|---|---|---|---|---|---|---|---|
| 410 E 4th St Mt Pleasant, TX | 3.0 | 2.5 | 2953 | $2,250 | $0.76 | 22d | 1 | 0.39mi |
Listing history 18 events
-
2026-06-08days on market $285,000 Active 179 DOM
-
2026-06-07days on market $285,000 Active 178 DOM
-
2026-06-07days on market $285,000 Active 177 DOM
-
2026-06-03days on market $285,000 Active 174 DOM
-
2026-06-02days on market $285,000 Active 173 DOM
-
2026-06-01days on market $285,000 Active 172 DOM
-
2026-05-31days on market $285,000 Active 171 DOM
-
2026-05-30days on market $285,000 Active 170 DOM
-
2025-12-11$285,000 Active 684-char remark
Show marketing remark (684 chars)
Don’t miss this unique multi-unit investment opportunity in the heart of Mount Pleasant! This property includes a duplex style property offering four 1-bedroom, 1-bathroom units, each with a living room and kitchen, perfect for rental income once renovated. With strong bones and spacious layouts, these units are ready for a full remodel and the right investor’s touch. In addition, the property includes a charming white home featuring 2 bedrooms, 1 bathroom, a dining room, and a kitchen. Whether you're looking to expand your rental portfolio, flip for profit, or create a unique mixed-use property, this setup provides the flexibility and square footage to do it all.
-
2025-12-07historical
-
2025-09-23price $285,000
-
2025-09-23price $285,000
-
2025-09-23price $285,000
-
2025-09-03price $299,900
-
2025-09-03price $299,900
-
2025-09-03price $299,900
-
2025-07-17$349,000 Active
-
2025-07-17$349,000 Active
ⓘ Source: listings_history table (triggers on properties + properties_extension) + one-shot
backfill from property_details.listing_events for pre-trigger history.
Climate risk First Street
- Flood 1/10 Low FEMA zone X (unshaded) · 0% chance over 30 yrs
- Wildfire 5/10 Major
- Heat 7/10 Severe 7 d/yr ≥113°F today · 23 d/yr by 30 yrs out
- Wind 6/10 Major 27% chance of damaging wind over 30 yrs
- Air quality 2/10 Low 1 unhealthy d/yr today · 1 by 30 yrs out
Nearby sold comps map
Loading sold comps map…
Walkable amenities ~0.75 mi
Loading nearby amenities…
Taxation est. · year 1
- Rental income
- $42,048
- − Mortgage interest
- −$15,964
- − Property taxes
- −$4,275
- − Insurance
- −$1,425
- − Repairs & maintenance
- −$3,364
- − Management
- −$3,364
- − Depreciation
- −$8,291
- Taxable income
- $5,365
- Est. tax owed @ 24.0%
- −$1,288
- After-tax cash flow
- $8,295/yr
For passive investors: Depreciation is non-cash, so a rental often shows a tax loss while cash-flowing — sheltering income. Rental losses are passive: they offset passive income freely, and up to $25,000/yr can offset ordinary (W-2) income if you actively participate and your MAGI is under $100k (phasing out to $0 by $150k); unused losses carry forward. On sale, claimed depreciation is recaptured at up to 25%, and gains may owe capital-gains tax (a 1031 exchange can defer both). Figures are a year-1 estimate at your 24.0% rate — not tax advice; consult a CPA.
Condition & rehab AI · 12 photos
This multi-family property requires extensive renovations to bring it up to code and improve its value. Immediate repairs and maintenance are needed to address structural issues and potential water damage.
Repairs flagged
- Major Exposed plumbing in kitchen — Exposed plumbing indicates potential water damage
- Major Missing cabinets in kitchen — Missing cabinets require replacement
- Major Worn countertops in kitchen — Worn countertops need replacement
- Major Worn fixtures in bathrooms — Worn fixtures need replacement
- Major Worn flooring in bathrooms — Worn flooring needs replacement
- Major Peeling paint on exterior — Peeling paint indicates structural issues
- Major Exposed ductwork in HVAC — Exposed ductwork indicates potential HVAC issues
- Major Missing components in HVAC — Missing components indicate potential HVAC issues
Value-add opportunities
- Both New kitchen cabinets and countertops — New cabinets and countertops will improve both resale and rental value
- Both New flooring and fixtures — New flooring and fixtures will improve both resale and rental value
- Both Paint exterior and landscaping — Painting and landscaping will improve both resale and rental value
Renovation cost estimate screening
| Repair item | Severity | Est. cost |
|---|---|---|
| Exposed plumbing in kitchen · Exposed plumbing indicates potential water damage | Major | $15,000–50,000 |
| Missing cabinets in kitchen · Missing cabinets require replacement | Major | $15,000–50,000 |
| Worn countertops in kitchen · Worn countertops need replacement | Major | $15,000–50,000 |
| Worn fixtures in bathrooms · Worn fixtures need replacement | Major | $15,000–50,000 |
| Worn flooring in bathrooms · Worn flooring needs replacement | Major | $15,000–50,000 |
| Peeling paint on exterior · Peeling paint indicates structural issues | Major | $15,000–50,000 |
| Exposed ductwork in HVAC · Exposed ductwork indicates potential HVAC issues | Major | $15,000–50,000 |
| Missing components in HVAC · Missing components indicate potential HVAC issues | Major | $15,000–50,000 |
| Total estimated repair cost · 8 items | $120,000–400,000 |
Value-add ROI direction
- Both New kitchen cabinets and countertops — New cabinets and countertops will improve both resale and rental value ↑
- Both New flooring and fixtures — New flooring and fixtures will improve both resale and rental value ↑
- Both Paint exterior and landscaping — Painting and landscaping will improve both resale and rental value ↑
ⓘ Cost ranges are severity-bucket heuristics (US national rule-of-thumb). Get contractor quotes + a written scope before underwriting a rehab budget.
Schools (NCES district)
- District
- Mount Pleasant ISD
- NCES district ID
- 4831760
- Math proficiency
- 45% ▼ -7.00%
- Reading proficiency
- 44% ▲ 2.00%
- Median HH income
- $40,642
- Composite
- 37.35/100
- National rank
- #4437
- State rank
- #291 of 826 in TX
Livability — Mount Pleasant
- Score
- 77/100
- State rank
- #81
- US rank
- #2808
Category grades
Schools grade is shown separately in the Schools card above.
Census & demographics
- Census place
- Mount Pleasant, TX
- County
- Titus County · 26,903 people
- City population
- 26,903
- Metro
- Mount Pleasant, TX
- Population (ZIP)
- 26,903
- Household income
- $56,163
- Rent vs Own
- Severe rent burden
- 758.0
Population outlook (Titus County) Hauer SSP2
- Today (2025)
- 33,205 people
- By 2030
- 33,187 · -0.1%
- By 2040
- 32,931 · -0.8%
- By 2050
- 32,231 · -2.9%
- By 2075
- 29,507 · -11.1%
- By 2100
- 25,369 · -23.6%
Race, ethnicity, and origin ACS 2023
- Neighborhood character
- Diverse neighborhood (Simpson 0.61)
- Race & ethnicity
- Hispanic / Latino 45% White 42% Two or more races 15% Black 10% Asian 1%
- Hispanic origin (detail)
- Mexican 42%
- Common ancestry
- Lithuanian 1% Slovak 1% Italian 1%
- Foreign-born
- 18% · Canada, Vietnam
- Languages at home
- 61% English-only · Spanish 37% Vietnamese 1%
Political lean MEDSL · Titus
- 2024 margin
- Solid R (+54.7) · D 22.3% · R 77.0%
- 2008→2024 swing
- -23.5pp toward R · 2008: -31.2pp · 2024: -54.7pp
- All cycles
- 2024: R+54.7 2020: R+44.7 2016: R+42.1 2012: R+39.0 2008: R+31.2
Not yet ingested
- Civics
- —
Market trends
- HPI YoY
- ▼ -79.66%
- Current HPI
- 215.4205
- Rent YoY
- —
- Metro
- Mount Pleasant, TX
- State GDP YoY
- ▲ 3.95%
- F500 in state
- 110
Industry mix (Fortune 500 HQ in TX)
| Industry | F500 HQs | Revenue |
|---|---|---|
| Energy | 16 | $1,198B |
|
||
| Technology | 5 | $198B |
|
||
| Engineering / Construction | 4 | $72B |
|
||
| Energy Services | 3 | $60B |
|
||
| Utilities | 3 | $41B |
|
||
| Healthcare | 2 | $330B |
|
||
Price history
-18.3% since first listed10 events — show timeline
- 2025-12-11 Listed $285,000 GTAR
- 2025-12-07 Listing Removed — NTREIS
- 2025-09-23 Price Changed $285,000 NTREIS
- 2025-09-23 Price Changed $285,000 LAAR
- 2025-09-23 Price Changed $285,000 GTAR
- 2025-09-03 Price Changed $299,900 NTREIS
- 2025-09-03 Price Changed $299,900 LAAR
- 2025-09-03 Price Changed $299,900 GTAR
- 2025-07-17 Listed $349,000 LAAR
- 2025-07-17 Listed $349,000 NTREIS
Cash-flow waterfall
monthlySold comps — $/sqft
last 12 mo · ≤1 miLoading sold comps…